The stock market crashed more than 85% from 1929-1932 during The Great Depression.
Millions saw their finances get decimated in that period but for most people it was from the economy getting crushed, not their portfolios.
Back then the stock market was a place reserved only for the wealthy and bucket shop speculators. In fact, less than 1% of the population was even invested in the stock market heading into the great crash.
There is still inequality in the stock market today but far more people take part in one form or another. The latest estimate is close to 60%:
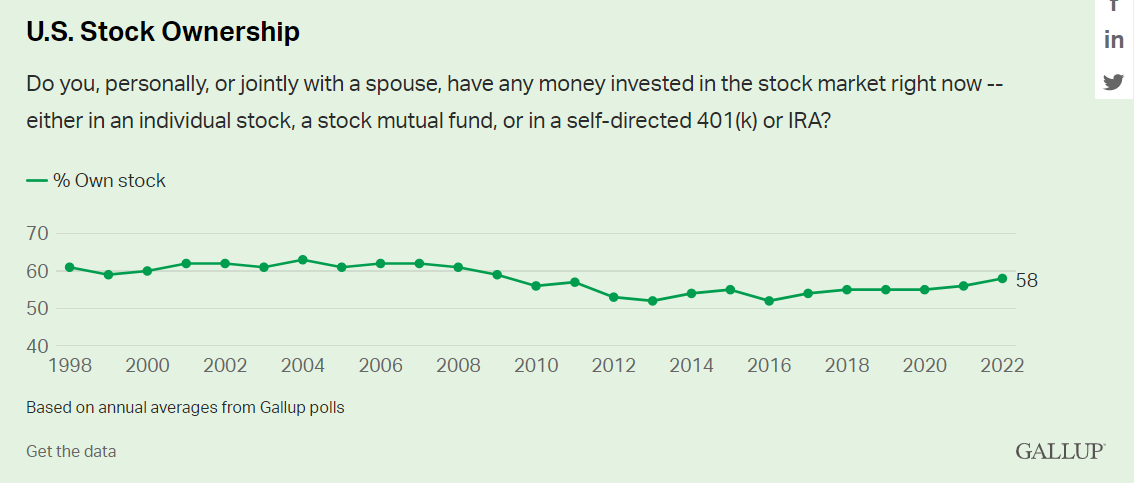
The advent of index funds, IRAs, 401ks, discount brokerages, ETFs and online access have all made it much easier to take part in the greatest wealth-building machine ever created.
The fact that you can buy the entire stock market for pennies on the dollar in fees with the push of a button is one of the best things to ever happen to individual investors.
Most people simply don’t have the ability, know-how or time to build a portfolio of individual stocks on their own.
A diversified, tax-efficient, low-cost, low-turnover investment vehicle exists for the stock market but not the housing market.
While stock market ownership during the Great Depression was a rounding error of the total population, plenty of people owned houses.
Real estate got obliterated just like everything else in the economy back then but the homeownership rate still only got as low as 44% following the Great Depression.
Following the post-WWII boom the U.S. homeownership rate1 quickly increased to more than 60%. That number has been close to two-thirds ever since:
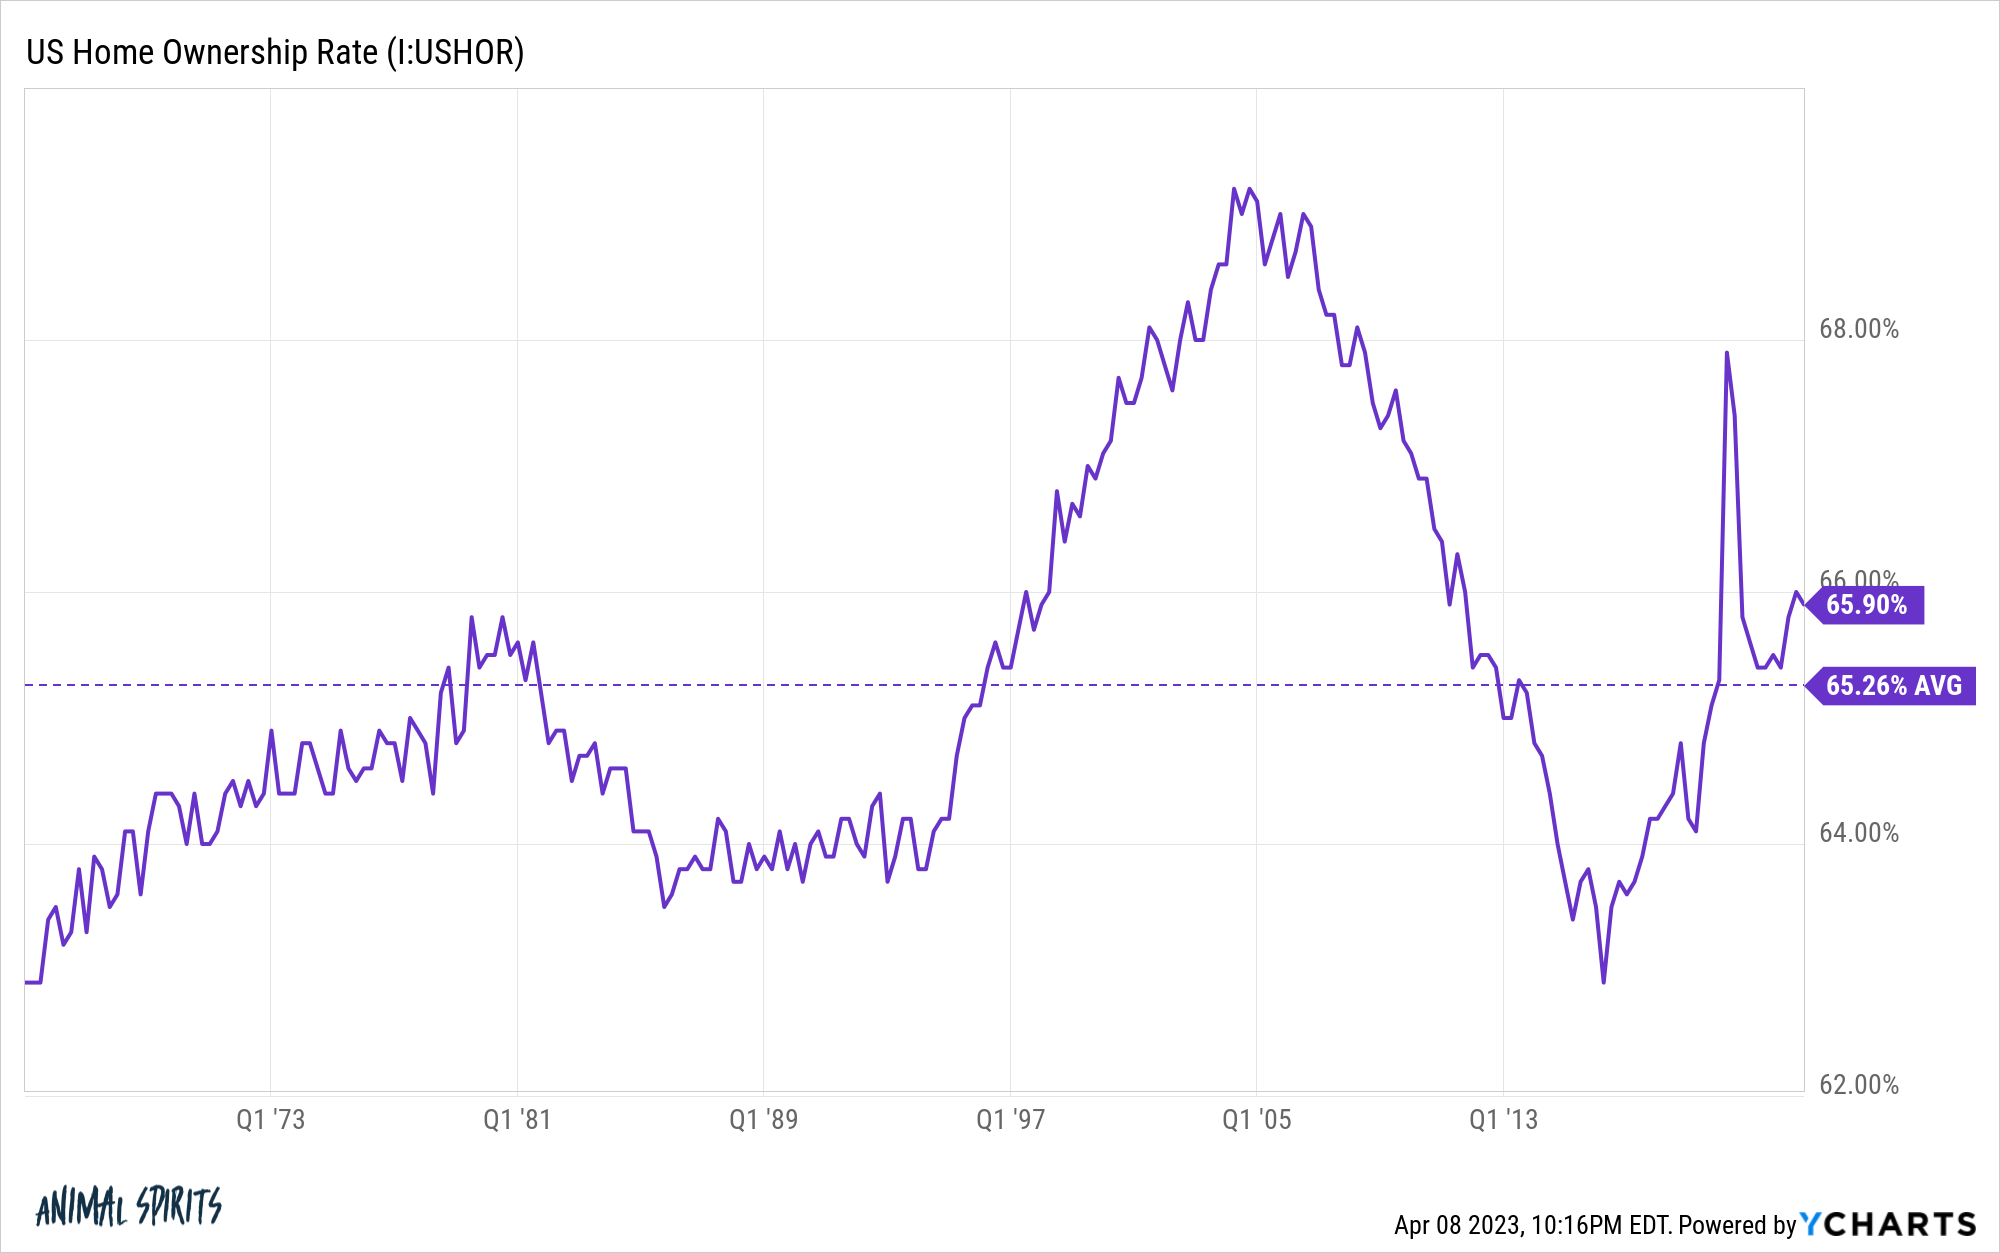
The homeownership rate is high but diversification for the vast majority of those homeowners remains low.
Institutions own most of the shares in the stock market. The housing market is dominated by regular people and small individual investors.
There is a conspiracy theory that large financial firms like BlackRock have been buying all of the houses in recent years but even with an uptick in institutional players during the low mortgage rate days, they still constitute less than 3% of the purchase market:
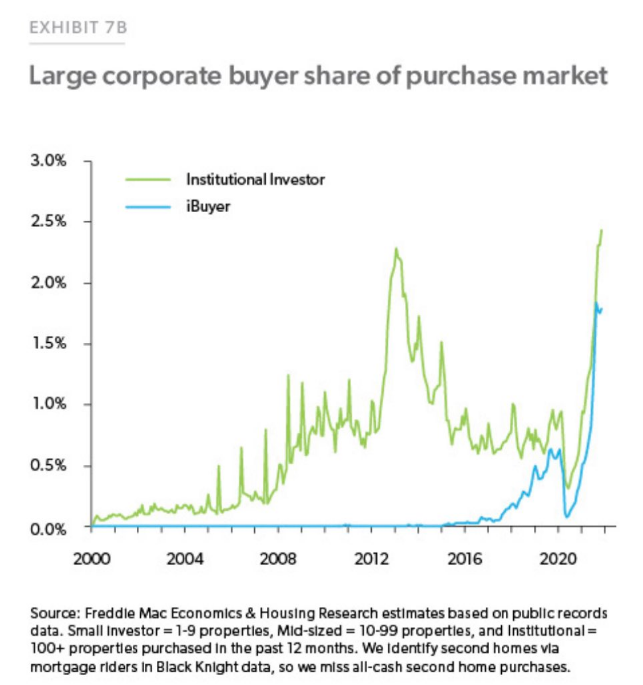
Most houses are owned by individuals that live in them while the rental market is owned by mostly small-time investors.
People in the finance industry like to talk about the housing market as if it’s a single entity just like the stock market but residential real estate remains hyper-local.
If we equate buying a house with buying stocks, most people have their money concentrated in a single position where the actual returns are dominated by micro factors as much as the macroeconomy.
Case-Shiller tracks the performance of the 20 largest housing markets in the country. You can see plenty of divergences in the returns since the start of the pandemic:
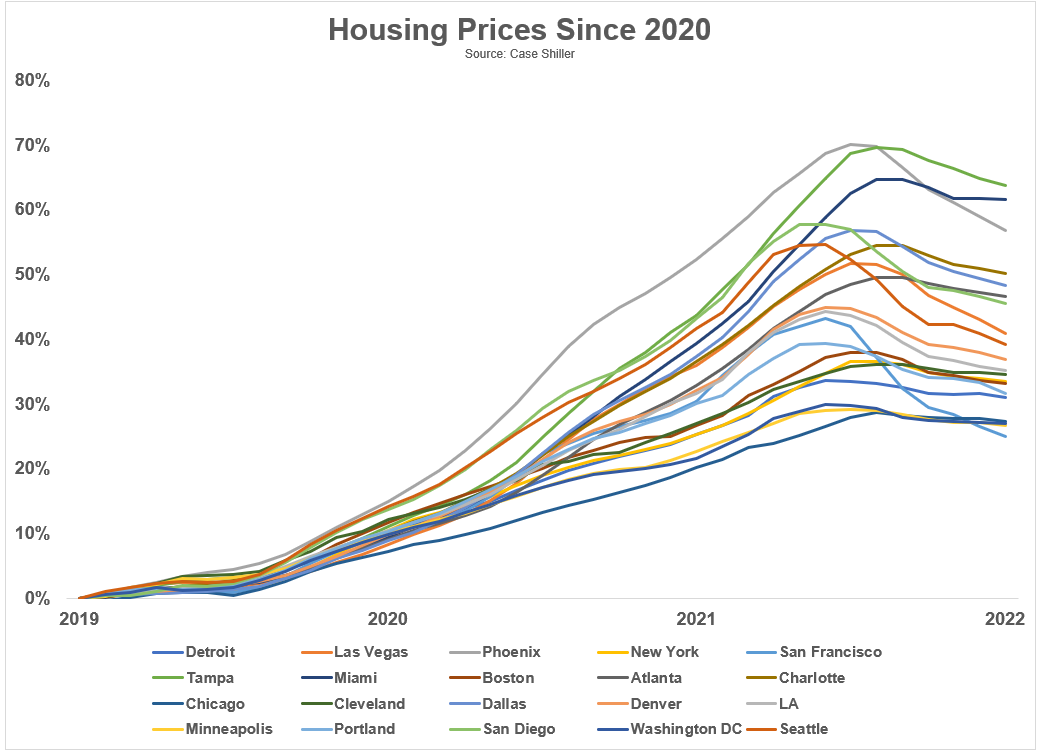
Prices went crazier in some places than in others. Now some locations are seeing prices roll over faster than others.
Redfin’s latest housing market update shows how certain cities have seen prices come in considerably while other areas of the country continue to experience strong price appreciation:
Home prices dropped in more than half (28) of the 50 most populous U.S. metros, with the biggest drop in Austin, TX (-14.7% YoY). Next come four West Coast metros: Sacramento (-11.7%), Oakland, CA (-10.4%), San Jose, CA (-10.2%) and Seattle (-9.6%). That’s the biggest annual decline since at least 2015 for Seattle.
On the other end of the spectrum, sale prices increased most in Milwaukee, where they rose 11.4% year over year. Next come Fort Lauderdale, FL (8.9%), West Palm Beach, FL (8.2%), Miami (7.9%) and Columbus, OH (6.3%).
On a national level, the median U.S. home-sale price fell 2.1% year over year to roughly $362,000, marking the seventh straight week of declines after more than a decade of increases.
That national median price makes for good macro talking head fodder but is essentially useless to anyone actually buying a house in their own community.
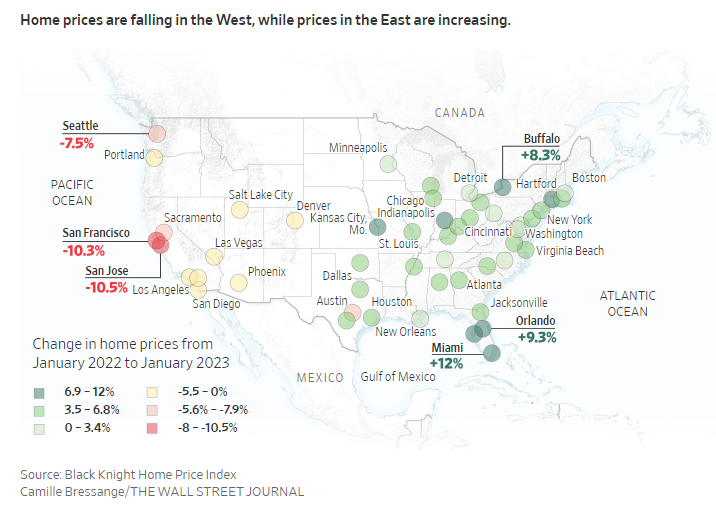
The Wall Street Journal recently broke down the bifurcation in housing market prices by east versus west:
There are obviously macroeconomic factors that impact buyers and sellers all across the country. Mortgage rates, of course, are a big one, especially now.
But if you’re trying to calculate the actual returns on housing there are so many idiosyncratic elements involved. Location is a big one but you also have to factor in property taxes, the age of the house, amenities, maintenance, insurance, potential HOA fees, the cost of living and weather-related risks.
Housing is far and away the biggest financial asset for most households in the United States and it’s nearly impossible to diversify the risk of that concentrated position.
Sure there are REITs, real estate ETFs, mutual funds or other investment vehicles that build, buy or develop real estate but there is no S&P 500 or total stock market index fund for housing.
You have your house in your city in your school district in your neighborhood with your specific housing characteristics.
It’s a good thing index funds do exist for other financial assets. They allow you to diversify your financial assets outside the roof over your head.
Further Reading:
Where Have All the $200,000 Houses Gone?
1The homeownership rate is calculated by dividing the number of owner-occupied housing units by the number of occupied housing units or households. It’s never been clear to me how multi-family housing units like apartments or townhouses impact this calculation.

