Last week I looked at some worst-case numbers for a 50/50 portfolio.
A handful of readers reached out and asked for some comparisons to other portfolios to be able to see how things look on a relative basis.
I already had the numbers handy so I decided to see how things looked compared to both a 75/25 mix of stocks and bonds as well as a 100% stock portfolio.
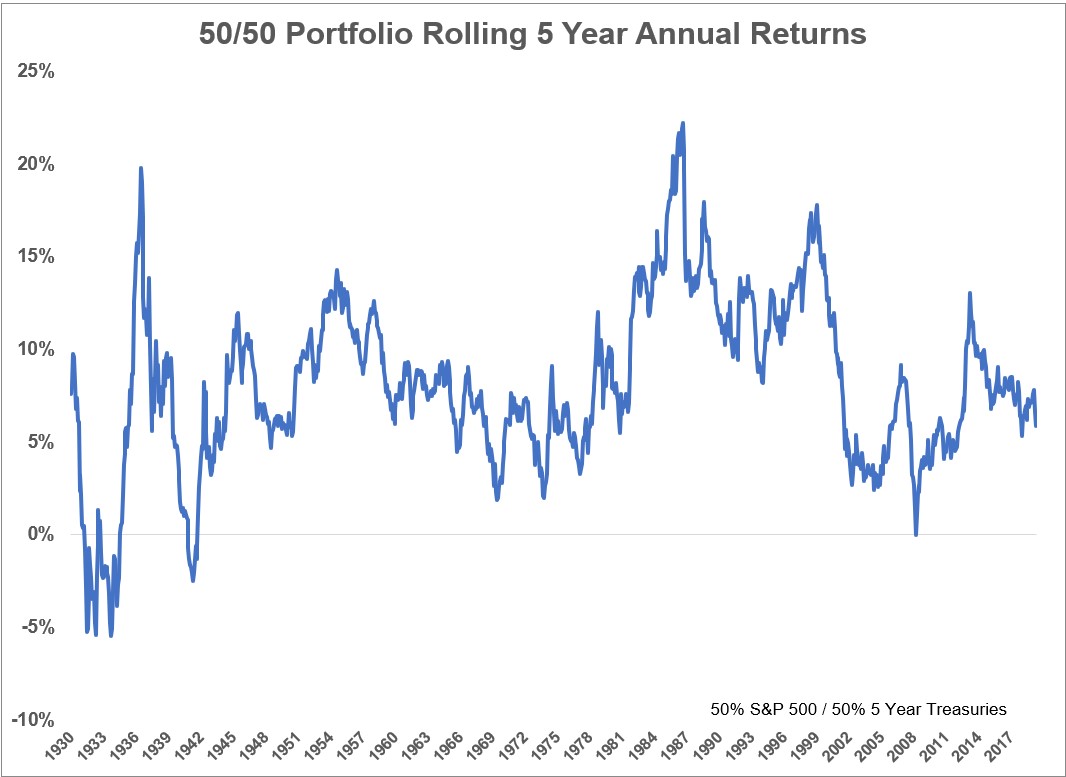
As a refresher, here was the 5 year rolling returns for a 50/50 portfolio:
And the 10 year rolling returns:
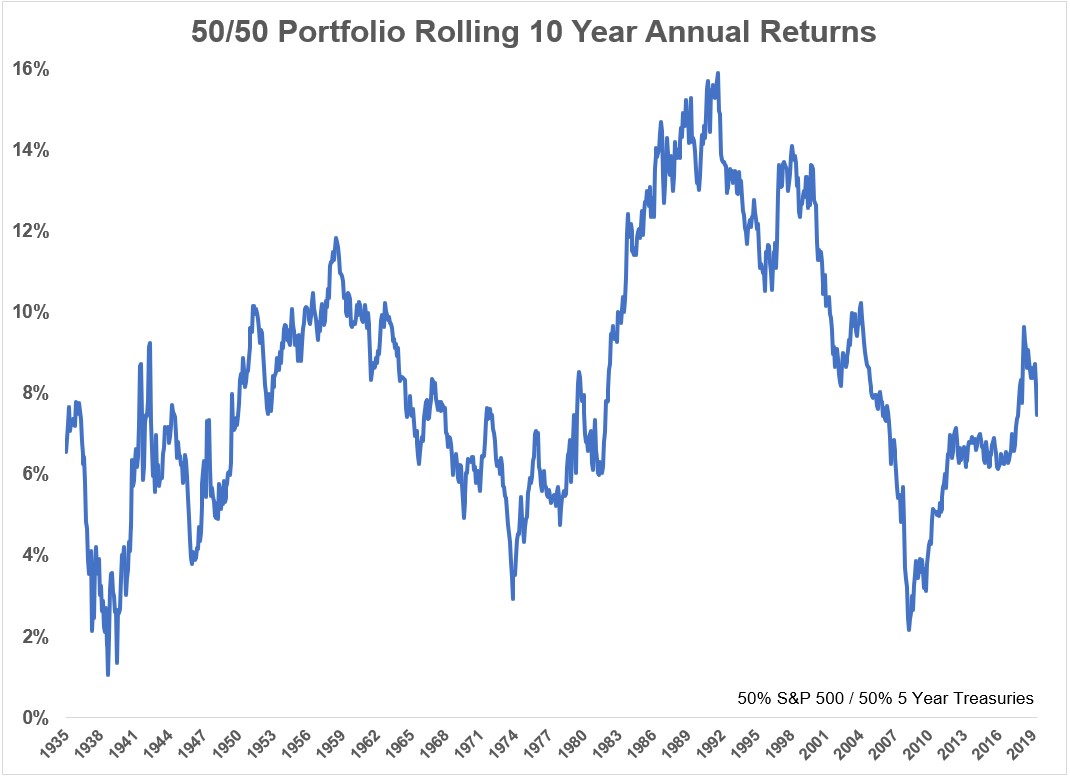
There was never a negative return in any 10 year rolling period for a 50/50 portfolio and just 4.5% of the time saw negative returns over 5 year rolling periods.
Now here’s a look at the 75/25 mix over 5 years:
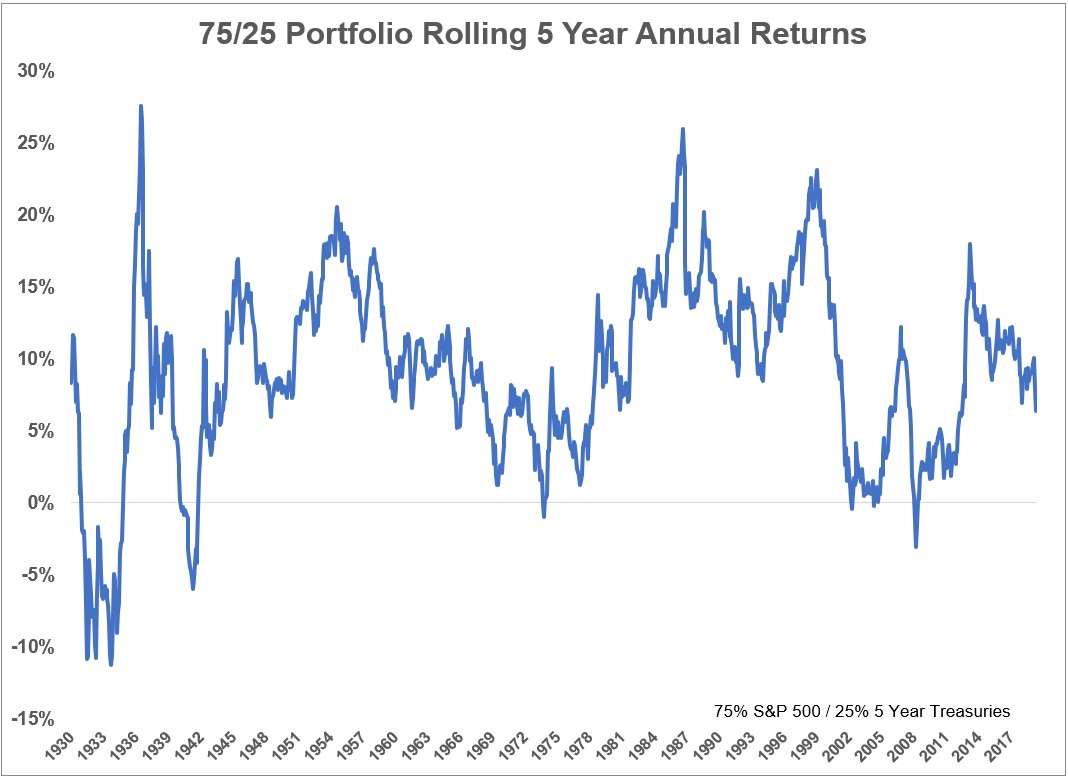
The 75/25 allocation experienced negative returns roughly 7% of the time, with the usual culprits as the reason (Great Depression, 1973-74 bear market, the dot-com crash and Great Recession).
The 10 year rolling returns for the 75/25 mix showed negative returns in the 1930s and depths of the GFC:
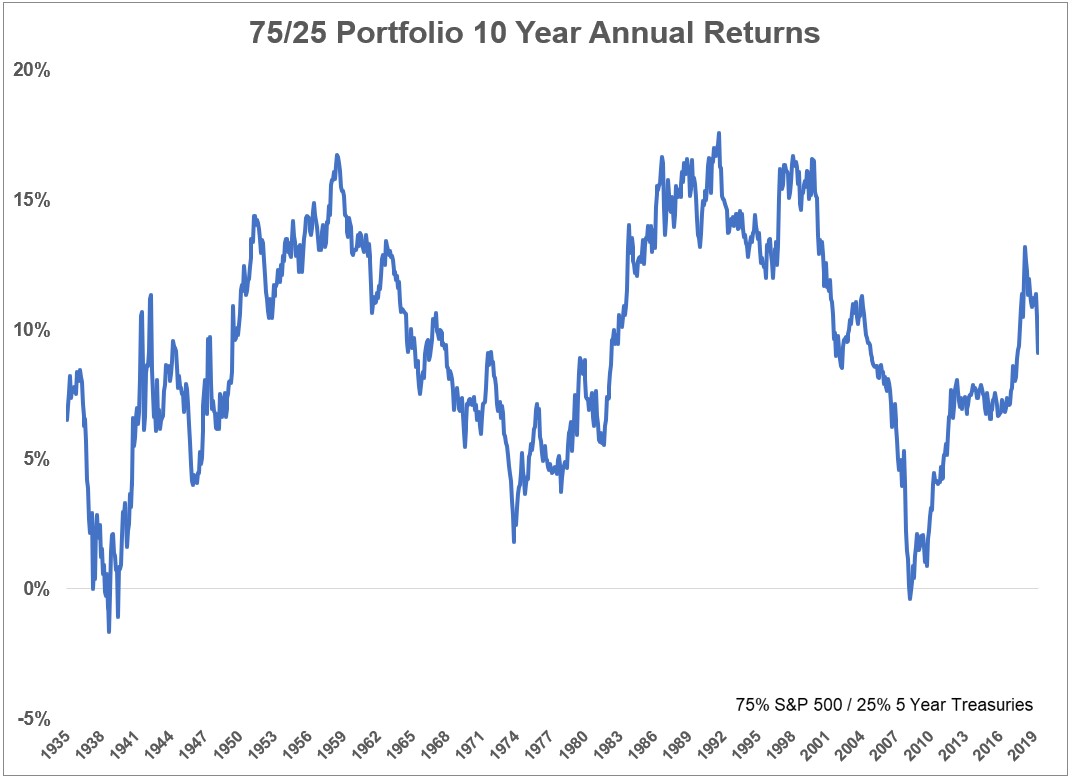
Rolling 10 year returns were positive 99% of the time.
When you move to a 100% all-stock portfolio things get a little wilder:
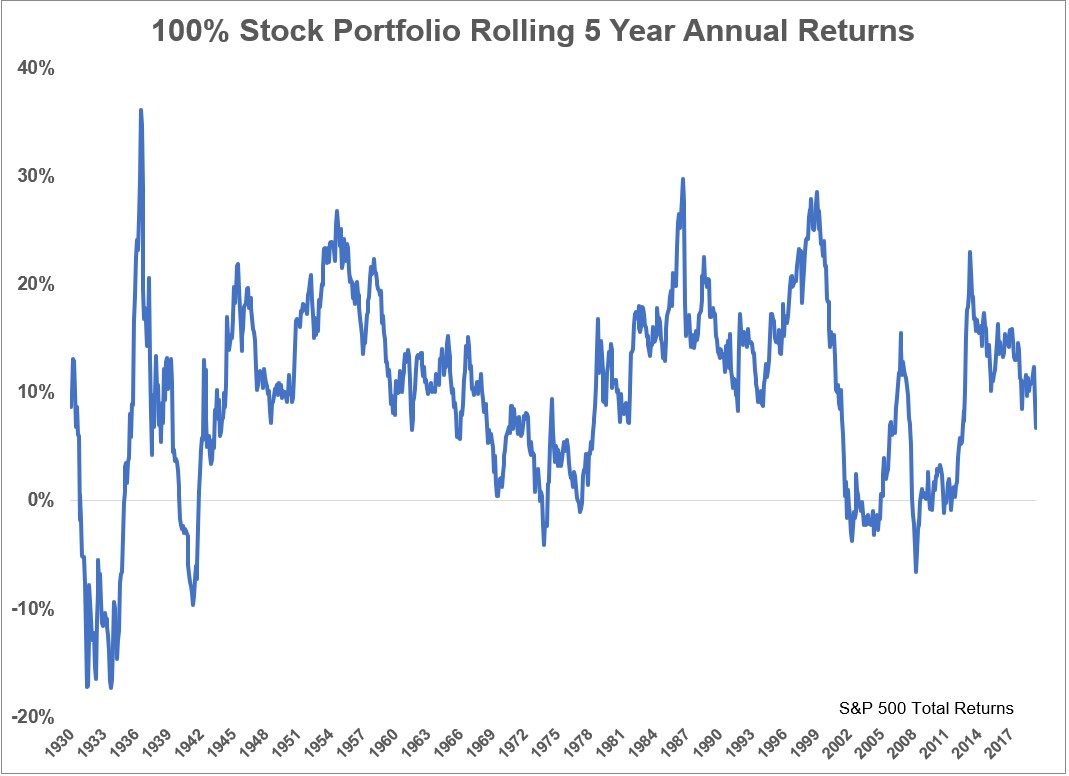
Since 1926, the S&P 500 has seen positive returns roughly 88% of the time for all 5 year rolling periods. That means 12% of the time returns were negative 5 years out.
The all-stock portfolio was up in nearly 95% of all rolling 10 year periods:
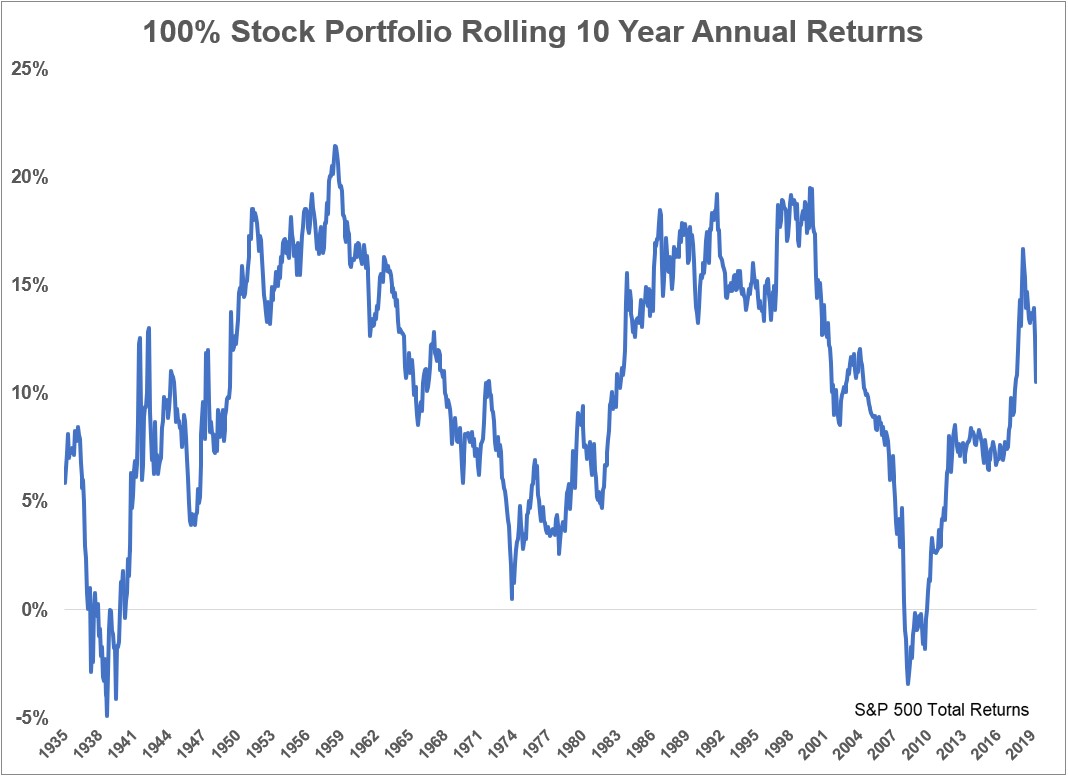
So 5% of the time 100% invested in the S&P 500 would have seen negative returns 10 years out.
You can see as we work our way up the risk spectrum from 50/50 to 75/25 to 100% in stocks the range of returns increases.
Here’s a table that summarizes how these ranges look for the various portfolios discussed here:
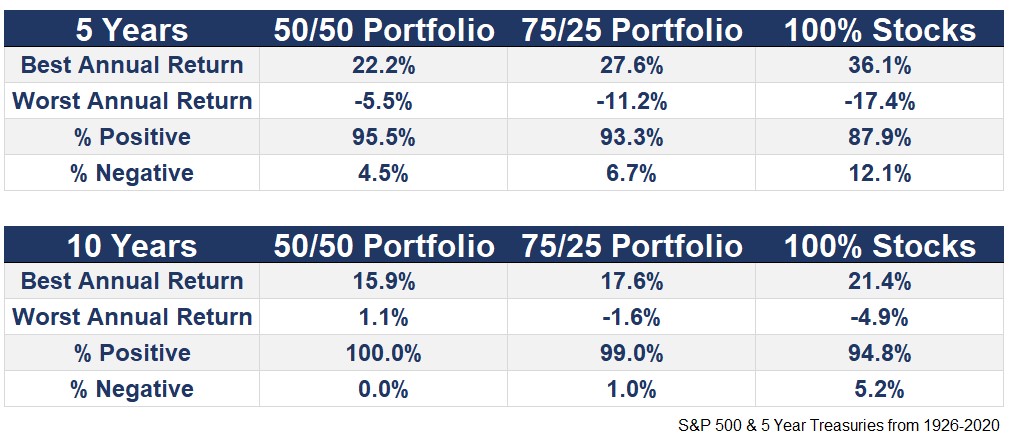
The relationships are fairly obvious but allow me to summarize:
- The more money you have in bonds the lower your long-term returns have been (relative to the all-stock portfolio). But you also have a lower risk of seeing negative returns 5 and 10 years out and the best- and worst-case scenarios have a much narrower range than an all-stock portfolio.
- The more money you have in stocks the higher your long-term returns have been. But you also have an increased risk of seeing negative returns 5 and 10 years out and the best- and worst-case scenarios have a much wider range than a more diversified portfolio.
Basically, this provides a nice illustration of the risk-reward spectrum. More money in stocks means the opportunity for much higher-highs and potentially lower-lows.
A number of people pointed out the fact that bond yields are now much lower than they were historically. This is true. Investors cannot expect the bond side of their portfolio to add much to the reward side of the equation from current levels.
Bonds have always been more of a risk-reducer. It’s just that in the past, that reduction in risk came with much better yields.
But this doesn’t really change the risk-reward relationship going forward. If you want to earn higher returns, you have to be willing to accept more volatility and higher losses. And if you want to see less volatility and shallower losses, you will have to accept lower returns.
It would be nice if we could all earn 7-8% risk-free returns in government bonds like investors could in the past but we have to invest in the markets as they are not as we wish them to be.
Risk and rewards are still attached at the hip. Investors just have to get used to the fact that the rewards are going to be lower than they were in the past for a while.
Further Reading:
What’s the Worst-Case Scenario for Diversified Portfolios?
