Diversification can make you feel like you’re running uphill with a weighted vest on during a bull market.
It’s only during a bear market that you realize its importance as a form of risk management. A 50/50 portfolio of the S&P 500 and Barclays Aggregate Bond Index is down 3.9% or so this year compared to a 12.7% decline in the stock market:
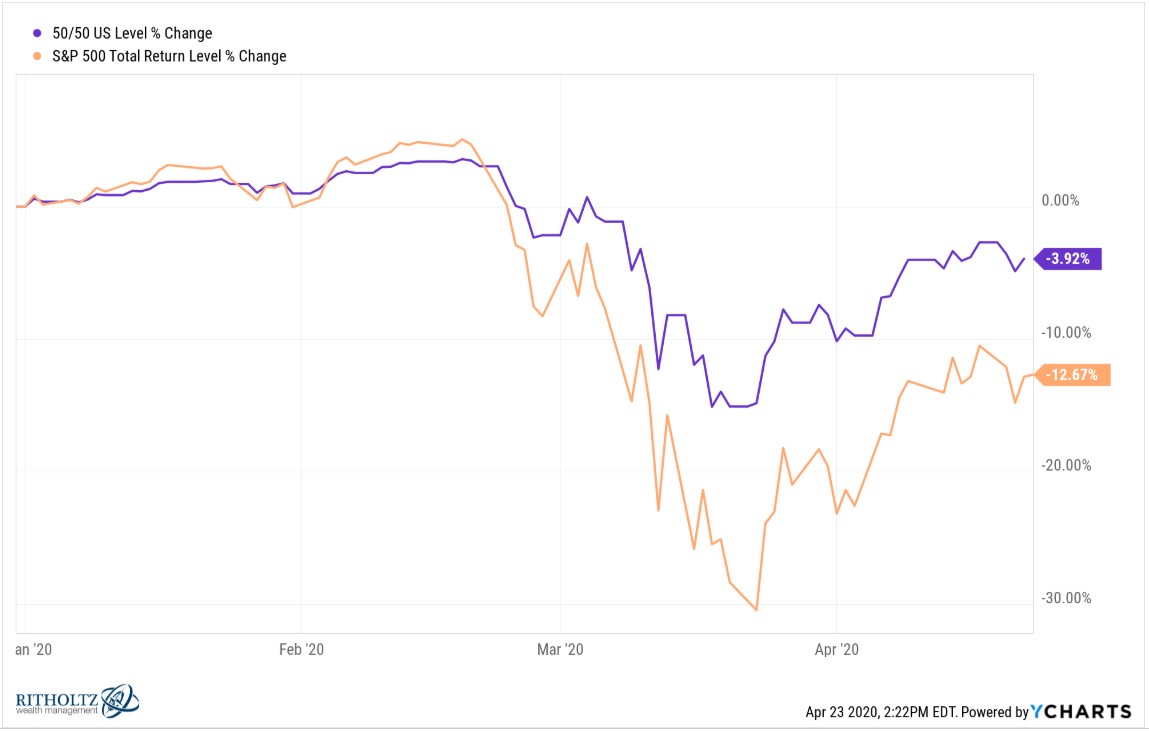
I’m guessing many diversified investors are pleasantly surprised at their performance during the crisis thus far because bonds have been holding up their end of the bargain.
But these are short-term results. The only returns that truly matter to investors are those of the long-term variety.
It’s possible this crisis is with us for some time. No one really knows when things will go back to normal. If this thing drags on it’s possible the markets could be in for a rough patch that lasts longer than a few months.
What is the worst-case scenario for a diversified portfolio of stocks and bonds?
The worst-case is both get dinged at the same time but I wanted to look back historically to see what the long-term results look like for a 50/50 portfolio to give investors a sense of how bad things have looked following past crises.
I constructed a simple portfolio using the S&P 500 and 5 year U.S. treasuries going back to 1926, rebalanced annually.1
Here are the rolling 5 years annual returns:
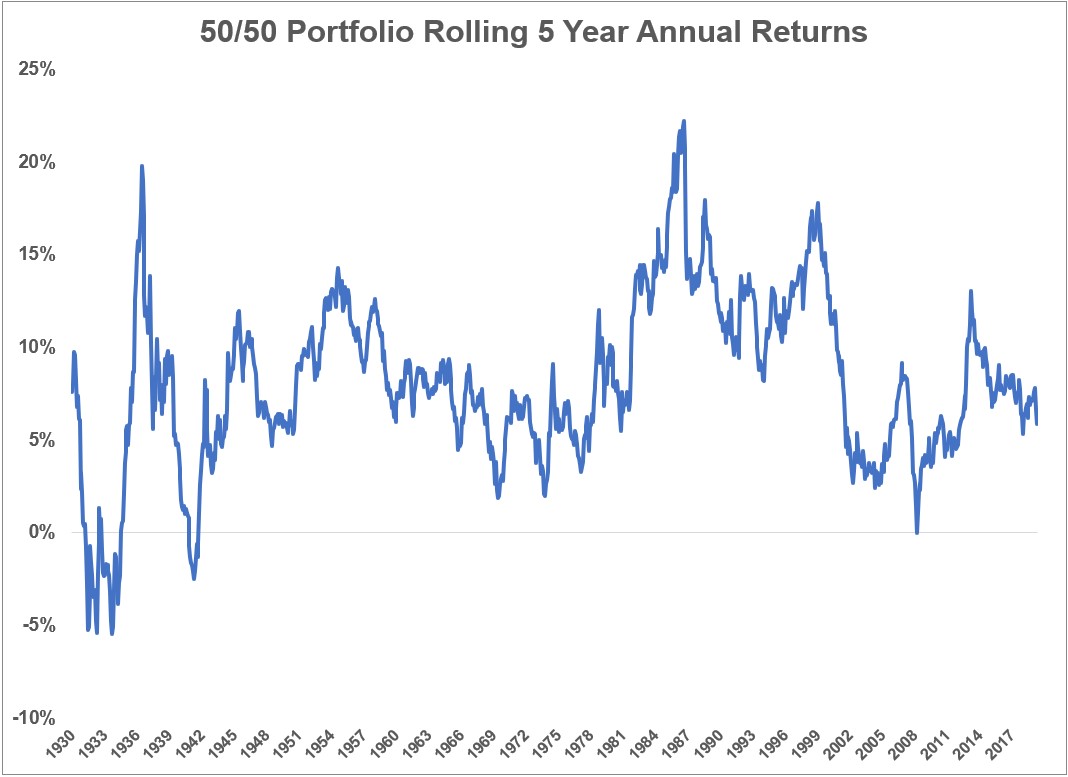
Annual returns over 5 years were negative just 4.4% of the time going back to 1926. The last time this happened was ever so briefly at the end of February 2009 when the trailing 5 year annual return was -0.02%.
Before that the worst periods were in the 1930s as stocks fell 5.5% annually during the Great Depression and its aftermath.
Annual returns over 10 years have never gone negative on a 50/50 portfolio:
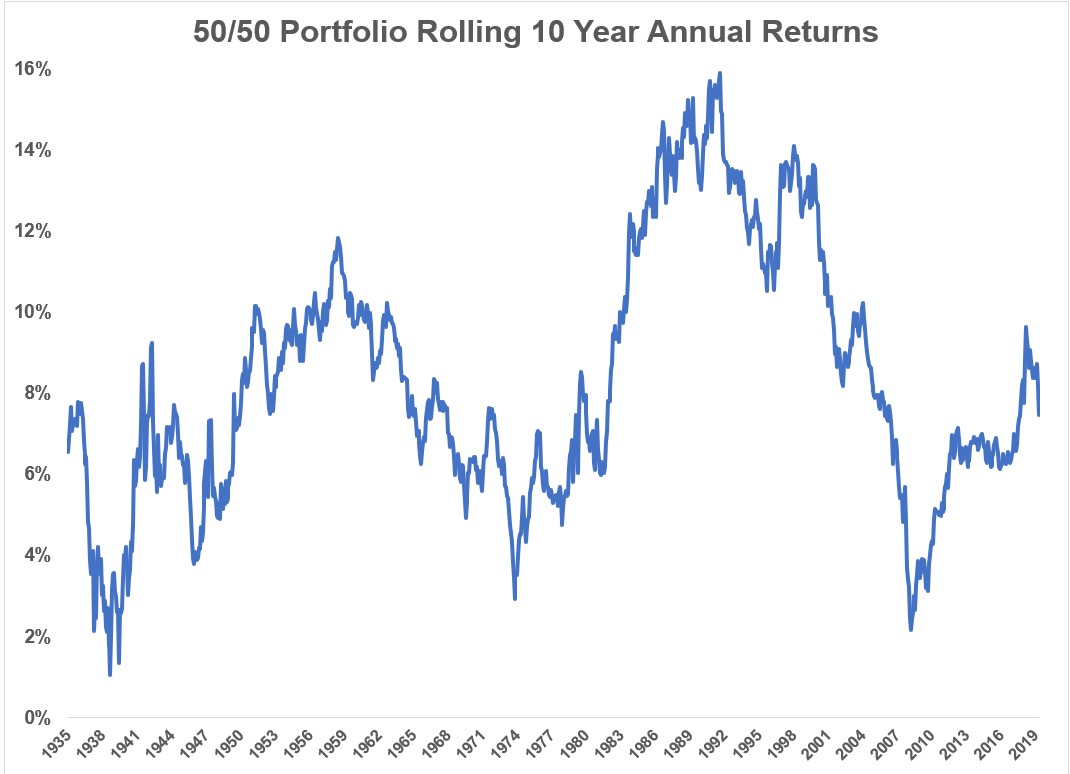
The worst 10 year annual returns for a 50/50 portfolio were just over 1% per year by the summer of 1939.
If there is a silver lining to subpar returns in a diversified portfolio in the past it’s that the ensuing returns were much stronger on the other side of it.
The worst 5 year period ended in the summer of 1934. From there a 50/50 portfolio went on to earn more than 9% annually over the next 5 years.
The worst 10 year period ended in the summer of 1939. From there a 50/50 portfolio went on to earn nearly 6% annually over the next 10 years.
The 5 years following the last negative 5 year period in February 2009 saw annual 5 year returns of more than 13%.
I looked at real returns as well to see what the impact of inflation was on these results:
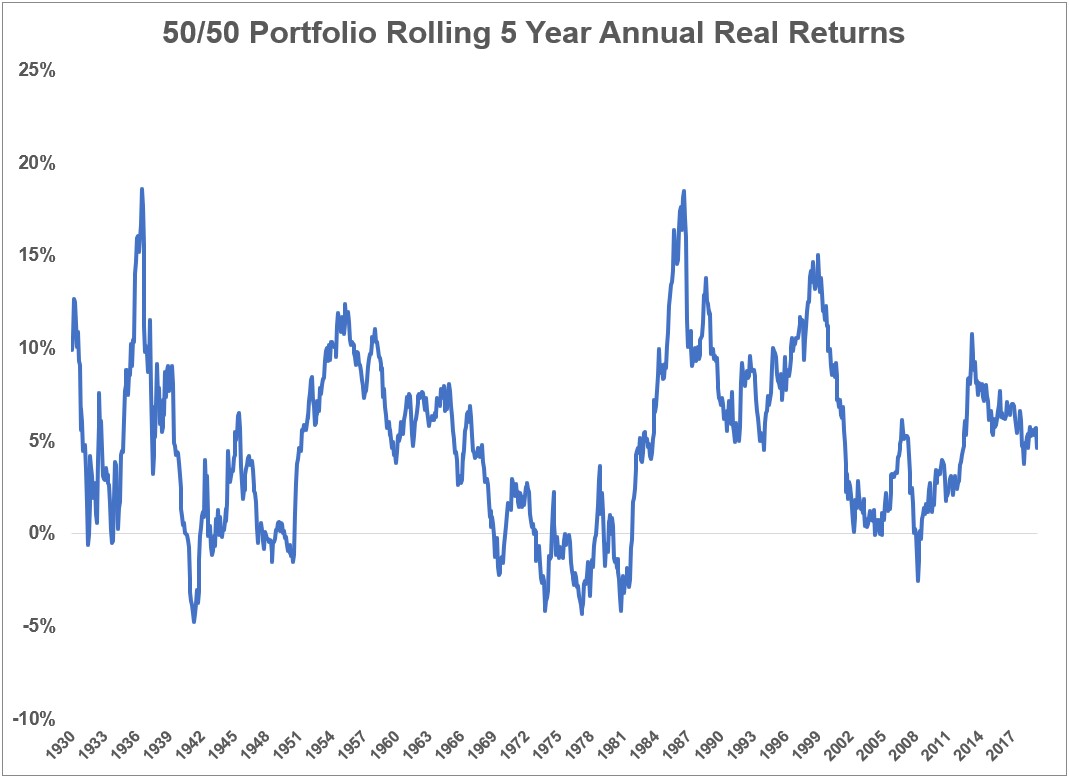
On a real basis returns were negative roughly 15% of the time over 5 years.
Surprisingly the results in the 1930s are actually better because deflation was so severe and much worse in the 1970s because inflation was running rampant.
The 10 year results skew these results even further:
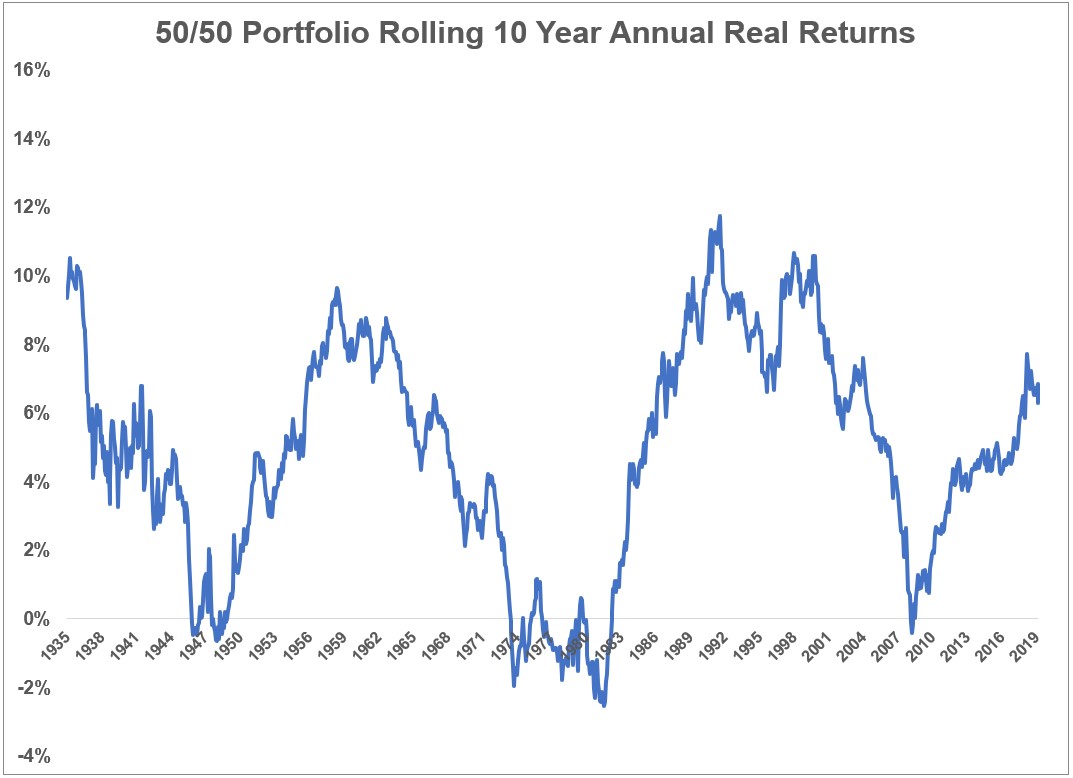
On a real basis this portfolio was down roughly 10% of the time over 10 years with the worst return of -2.5% coming in the 1970s.
It’s important to remember over the long haul how inflation/deflation can play a huge role in not only your investment results but also your financial results. The whole point of investing is delaying current consumption for future consumption.
This is also one of the reasons a diversified portfolio is such a useful tool for investors.
When things are going well the stock market can be a great place to draw from for consumption purposes. When things aren’t going well the bond market can be a great place to draw from for consumption purposes.
Diversification doesn’t always work perfectly but the track record suggests it’s pretty hard to beat in terms of both portfolio growth and risk management.
Further Reading:
How Are Diversified Portfolios Holding Up During the Crash?
1These are just the index numbers so no taxes, fees, or commissions included. These are monthly total returns.

