We have a handful of traditions in my family.
We watch the Lions lose every year on Thanksgiving.
We wear Hawaiian shirts at holiday dinners (try it…it’s fun).
We get Chinese takeout for lunch every year on Christmas day.
And we update my asset allocation quilt once a year when the calendar turns (OK that’s just me).
Let’s do this.
Here’s the updated quilt with 2022 data:
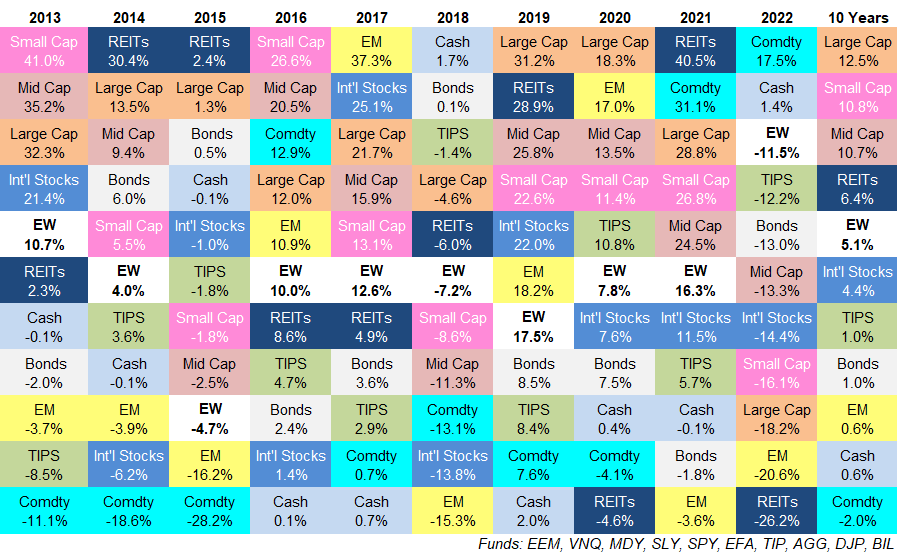
I have A LOT of thoughts on the latest numbers so let’s dive right in:
Best-to-worst strikes again. Emerging markets were the best-performing asset class in 2017 and followed that up with the worst performance in 2018.
Cash was the worst-performing asset class in 2016 and 2017, the top performer in 2018 and then at the bottom of the heap yet again in 2019.
REITs were in the toilet bowl in 2020. In 2021, they shot to the top of the charts. It was back to last place last year.
Did the present value of future cash flows for real estate really change that much from year-to-year or are we humans inconsistent with how we price these things?
I’m leaning towards the latter but it’s always good to remind yourself that nothing lasts forever in the financial markets.
It was not a great year. 2022 was the first year since 2018 that only two asset classes experienced gains.
This time it was commodities and cash while the last time around it was bonds and cash (same as it was in 2008 too).
Eight out of the 10 asset classes I’ve been tracking here were down double-digits in 2022.
Stock market diversification finally helped. For the first time in a number of years, having some diversification in your equity holdings made a difference in 2022.
International stocks, mid caps and small caps all outperformed the S&P 500 for the first time in what feels like forever.
The S&P 500 has had an amazing run. This was bound to happen.
Bonds were down bad. If you owned a total bond market index fund, 2022 was your worst year of performance ever.
Bonds being down double-digits was painful but makes sense in the context of interest rates rising from their lowest levels in history and inflation spiking to 9%.
The more surprising performance number here is the fact that TIPS were down double-digits as well and barely outperformed the aggregate bond index.
Are commodities the only true short-term inflation hedge? There are reasons TIPS were down in a year with rapidly rising inflation — namely, TIPS act like bonds when interest rates rise quickly (more on that here).
A lot of investors were perplexed by the lack of protection from treasury INFLATION-protected securities.
Some people assumed Bitcoin would be a good hedge against inflation. Nope.
Cash and short-term bonds are relatively decent hedges against inflation because there is little-to-no interest rate risk and you can reinvest more quickly at higher interest rates when they rise.
But it appears the best short-term inflation hedge (stocks are still the best long-run inflation protection) is commodities.
This makes sense when you consider input costs tend to rise in reaction to or because of inflationary pressures.
Hedging inflation perfectly is hard. Commodities might be the best answer…in the short run.
It was a lost decade for emerging markets. The first decade of this century was a lost one for the S&P 500. On a total return basis it was down nearly 10%.
This makes sense considering the decade was bookended by two 50% crashes.
In that same decade, emerging market stocks were up more than 160%.
That’s diversification for you.
Since then the opposite has occurred.
Over the past 10 years, the S&P 500 is up more than 220% while emerging market stocks have risen a total of less than 6%.
Things don’t always work out so neatly in the markets but this role reversal from lost decade (outperformance) to outperformance (lost decade) shows just how difficult this can be for investors.
Everyone loved emerging markets (especially the BRICs) and wanted to throw U.S. stocks out the window in the aughts.
Now everyone loves the U.S. stock market and wants nothing to do with stock outside of our borders.
I will be interested to see how the 2020s play out from here for both of these asset classes.
The bull market sandwich. My asset allocation quilt spreadsheet goes back to 2008.
It’s fascinating the view the performance numbers for these asset classes starting with a bad year in 2008 followed by a bull market for a number of years and ending with another bad year in 2022.
Here are the annual returns from 2008-2022:
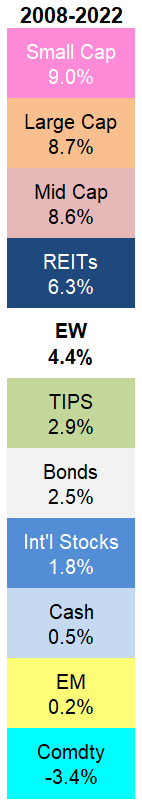
For U.S. stocks, combining two really bad markets with one really good market, basically led to average long-term returns of around 9% per year.
Bond returns have been relatively low compared to the past 40 years or so. Low starting yields tend to have that effect.
Even with strong performance in the past 2 years and four decade high inflation, commodities have had a terrible run in the past decade and a half.
Stocks outside of the U.S. have had one of their worst runs in history.
I wonder what this quilt will look like by the end of this decade.
Will U.S. stocks continue to dominate?
Will bonds look a lot better with higher start yields?
Will foreign stocks experience some mean reversion?
I don’t have the answers to these questions but as long as I’m still around I’ll be here to provide the update when we get there.
Further Reading:
Updating My Favorite Performance Chart For 2021
*EW on the chart is for equal-weight and is simply an equally weighted average return of these asset classes.

