It’s that time again.
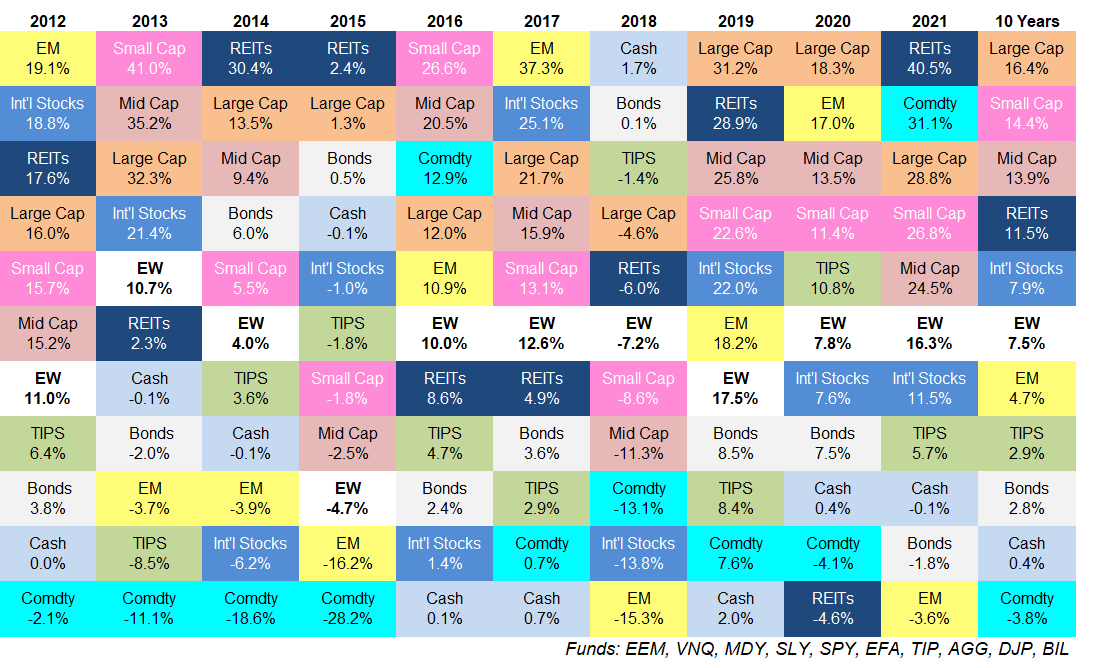
Here’s an update of my asset allocation quilt over the past 10 years:
 Some thoughts:
I was surprised REITs did so well last year. I pay attention to this stuff. I track returns for a wide variety of markets, strategies and asset classes.
Yet somehow I didn’t realize REITs had such a wonderful year.
I suppose it makes sense when you consider real estate investment trusts were at the bottom of the barrel last year.
Sometimes that works, sometimes it doesn’t.
Commodities still have plenty of lost ground to make up. Commodities had a banner year in 2021, up more than 30%.
Yet over the last 10 years, a basket of real assets (as defined here by the DJP ETF) are still down more than 32%.
On the one hand, higher inflation could keep the good times rolling.
On the other hand, technology is the biggest deflationary force on the planet.
Choose your fighter.
Cash has been trash for a long time now. The highest return for short-term t-bills (basically cash, savings accounts, money market funds, etc.) over the past 10 years is 2%. The average return over this period is just 0.4%.
Ouch.
Cash can still serve a purpose for its optionality, short-term safety and ability to act as a volatility shock absorber. But since 2008, parking your money in cash has not offered anything approaching a respectable yield.
It’s possible this situation will continue for a very long time.
The consistency of the S&P 500 is impressive. My quilt includes 10 assets classes. Over the past 10 years, the S&P 500 has not finished worst than 4th place in terms of performance rank.
Professional investors would kill for this combination of consistency and outperformance.
It’s crazy the best way to outperform over the past decade required you to simply let the market do all of the heavy lifting for you.
And over the next 10 years?
I don’t know. We’ll see.
10 year returns for U.S. stocks are silly. The S&P 500 has had an unbelievable run but small caps and mid caps have experienced wonderful returns as well.
I know it feels like this entire run-up in U.S. stocks has been driven by a handful of names but small and mid-sized companies have given investors annual returns of 14.4% and 13.9%, respectively.
It’s not just Apple, Amazon, Microsoft, Google and Facebook that have been carrying the market higher.
Plenty of other stocks are doing their part.
2008 is becoming a distant memory to performance numbers. My asset allocation quilt spreadsheet numbers go back to 2008. I simply add the new returns every year when updating the quilt but keep those older returns for posterity.
So I have a running total of returns beginning during the worst economic crisis of my lifetime.
The 37% loss for the S&P 500 in 2008 is the second worse calendar year return over the past 100 years.
Yet even with that downright awful year included, the S&P 500 is still up well over 300% or 11% per year from 2008-2021.
You could have invested your money going into the worst financial crisis since the Great Depression and still seen above-average returns in the stock market if you held on.
That’s how good U.S. stock market returns have been since the 2008 crash.
It’s quite possible we will never see returns like this again in my lifetime.
Maybe I’m wrong but this would not surprise me.
Expect a wide range of outcomes every year. The range of returns between the best and worst-performing asset classes in 2021 was 44.1% (40.5% for REITs and -3.6% for emerging market stocks).
This seems obscene until you look at the other years on this chart. The average difference between the best and worst-performing asset classes over the past 10 years is 33%.
There are always going to be relative winners and relative losers in a given year. This is how markets work.
Diversification means you miss out on both home runs and strikeouts. A few years ago I began included an equally-weighted return for all 10 asset classes listed here (aptly named EW for those of you wondering what that box is all about).
You can see this very simple form of diversification means you’re never going to be the best performer in a given year. The equal-weight portfolio is basically always in the middle of the pack.
But this portfolio is never the worst performance either.
This is the trade-off you make when trying to control for risk. Being diversified means always investing in both the best and worst performers but never having the best or worst performance in your portfolio.
I guess that’s the biggest takeaway I get from updating this chart every year.
Further Reading:
Updating My Favorite Performance Chart For 2020

