These are the calendar year returns for the S&P 500 since 2009:
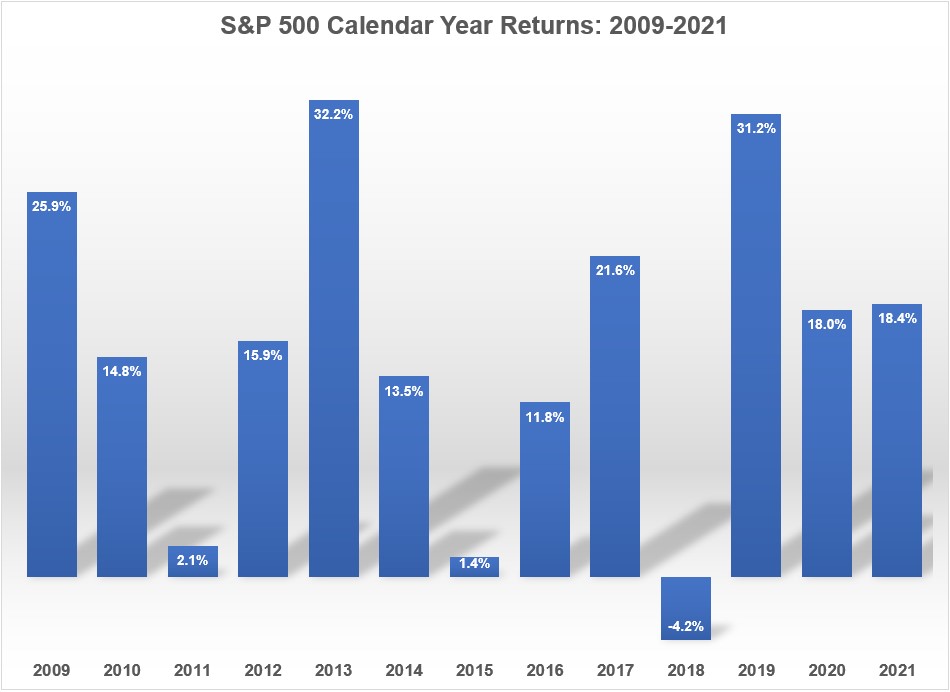
That’s a pretty good run. By my calculations, that’s good enough for annual returns of around 16% per year.
The U.S. stock market is not only up 12 out of the past 13 years (assuming this year’s gain holds), but 10 out of those 13 years have been double-digit gains. And the worst down year was a loss of just 4%.
It hasn’t always been easy of course. There have been downturns:
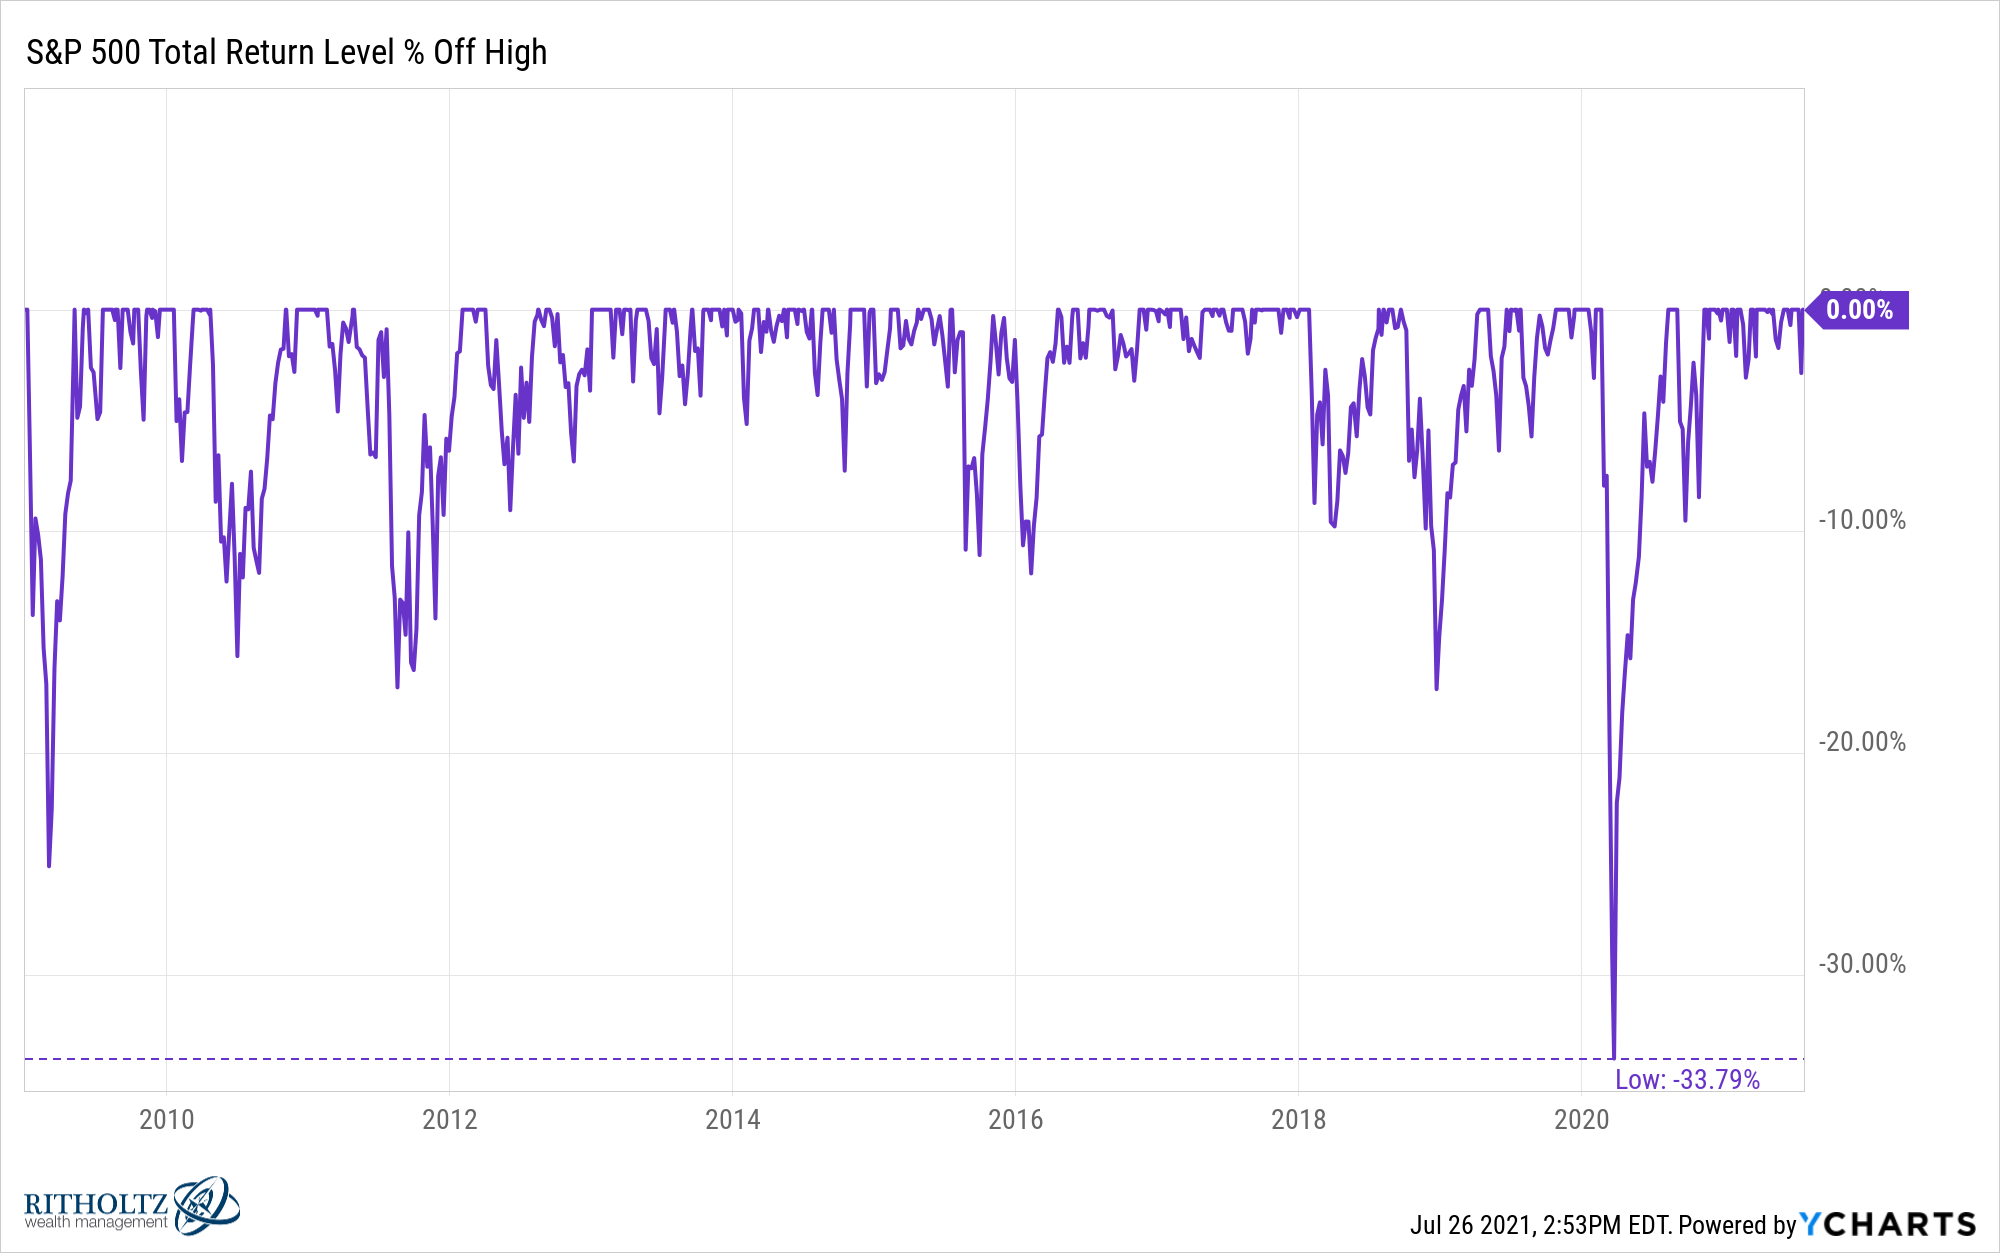
I count seven different corrections of 10% or worse over these 12+ years.1
But those corrections have all been fairly short-lived.
Which leads me to ask — is this as good as it gets?
As a millennial, will this be the best stock market run of my lifetime?
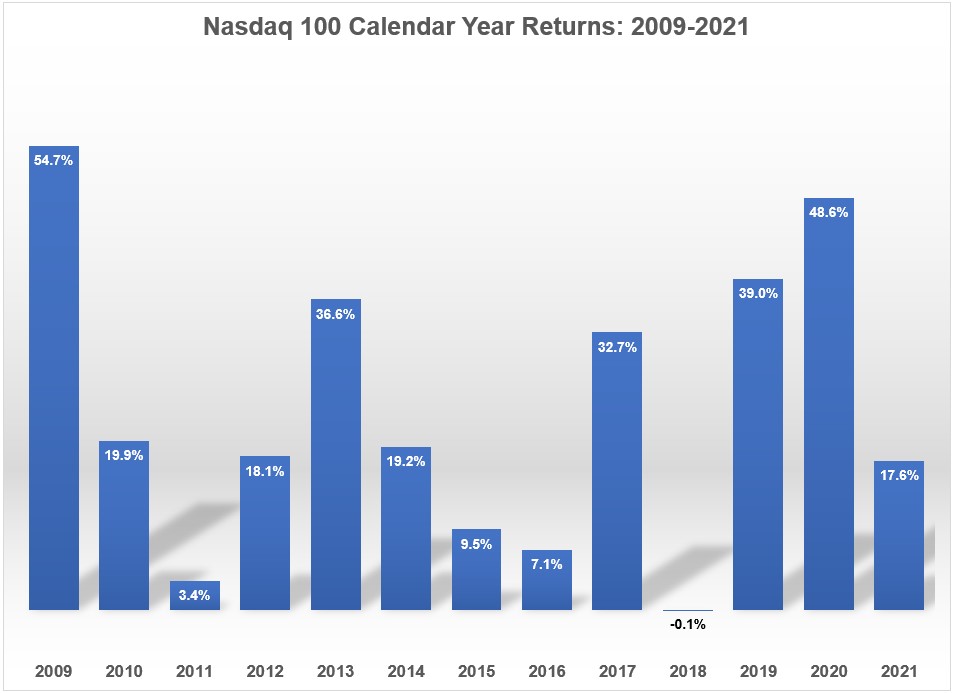
Before putting these numbers into historical context, allow me to present one more piece of evidence to the jury. Here are the calendar year returns for the tech-heavy Nasdaq 100 over the same time frame:
Dear lord.
Annual returns of more than 23% per year. For more than 12 years!
Eat your heart out, Warren Buffett.
This cycle has been mighty kind to investors.
I’m not saying this cycle is coming to an end but let’s look at some historical data to put the current run into perspective. The following chart shows the rolling total returns over 12 years and 7 months going back to 1926 on the S&P 500:
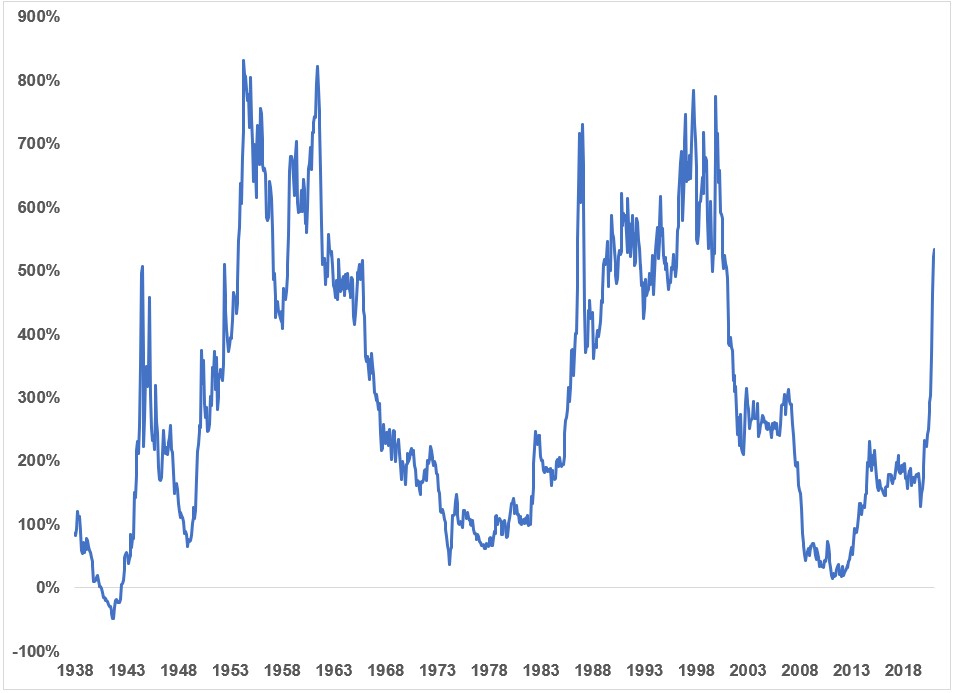
Yes I’m cherry-picking a random time frame here but just wanted to stay consistent with the numbers I used to start out this post. So the last data point on this chart with a total return of +534% was from January 2009 through July 2021.2
You can see those returns are now fast approaching the glorious performance of the 1950s and 1980/1990s.
So maybe millennials will get one more crack at an unbelievable run in the stock market before all is said and done. Baby boomers got to experience the wonderful returns in the 80s and 90s along with the current cycle.
It is important to understand one of the main causes of the current high returns in stocks — the low returns that preceded this cycle.
These are the annual returns for the S&P 500 from 2000-2008:
2000: -9.0%
2001: -11.9%
2002: -22.0%
2003: +28.4%
2004: +10.7%
2005: +4.8%
2006: +15.6%
2007: +5.5%
2008: -36.6%
From 2000-2008 the S&P 500 was down 28% in total. That’s a 9 year run where you lost close to one-third of your money in the market. Stocks were down in 4 out of 9 years and this period included two gut-wrenching 50% declines.
You don’t get to experience the incredible returns of the current cycle without experiencing the awful returns of the previous cycle.
The one glaringly obvious takeaway from the rolling returns chart above is the stock market is cyclical. Above-average returns are eventually followed by below-average returns and below-average returns are eventually followed by above-average returns.
The hard part of this equation is we don’t know how long the cycles will last and we don’t know how high or low things will get in the meantime.
It’s also worth pointing out that a down cycle wouldn’t be the worst thing in the world for millennials. My generation is still in the wealth-building phase of our lifecycle.
I’m an old when it comes to millennials and I still have 2-3 decades as a net saver ahead of me. A period of below-average stock market returns in the coming years will feel painful as it’s happening but if you’re putting money into the market at lower prices that’s a good thing over the long-term.
You don’t want markets to constantly hit new highs all the time when you have money to put to work.
I have no idea how much longer this current cycle will last. It could go for the rest of the decade or come to an end tomorrow.
The important thing to remember as an investor is where you sit in your lifecycle to determine how an end to the current cycle would impact you and invest accordingly.
Risk means different things to different investors depending on their time horizons.
Further Reading:
When Dollar Cost Averaging Matters Most
1And obviously that initial downturn in 2009 was the tail-end of the 2008 crash that bled into 2009.
2This number will go even higher in the next few months as early-2009 returns roll-off.
