It feels like every 12 months or so we get a chart like this one from Goldman Sachs:
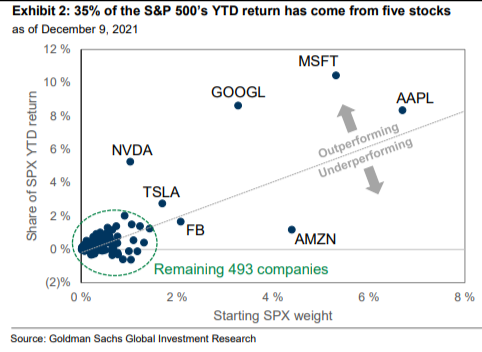
It shows that more than one-third of the return in the S&P 500 this year has come from just 5 stocks.
Some investors become concerned when they see statistics like this.
It’s all a house of cards.
What happens when these companies take a dive?
This isn’t healthy market behavior.
Stocks are detached from reality.
Sure, if and when the biggest stocks fall, the market will likely fall as well. That’s just how the stock market is constructed.
But it actually makes sense these companies would have such an outsized impact on returns since they have an outsized impact on fundamentals.
After hearing Michael and me on Animal Spirits discuss how the biggest companies are carrying the index this year, Pranav Ghai from CalcBench sent me some research to show why it’s justified that the market is so top-heavy.
Here’s what he did:
- Took the profits numbers from 2016-2021 by calendar year for every company in the S&P 500.
- Sorted those companies from most to least profitable.
- Took the top 25 companies in terms of net income and compared their profits to market cap weights in the index.
- Compared the top 25 names each year to the remaining stocks in the S&P.
This is the result:
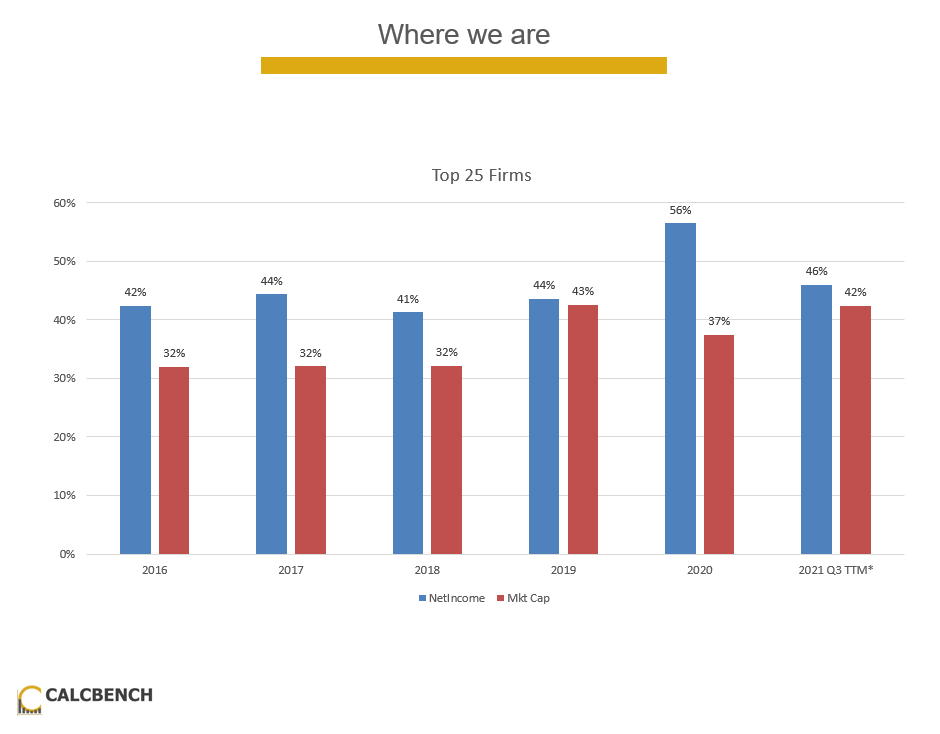
Each year since 2016, the 25 biggest companies have produced even more profits than their weighting in the S&P 500.
Not only are the 25 biggest companies becoming larger relative to the index, but so are their fundamentals. In 2020, the top 25 names made up 37% of the index but 56% of the profits!
So far this year, the 25 most profitable companies make up 42% of the S&P 500 and 46% of the net income.
You can shake your head at how big these companies are getting but they are big for a reason. The fundamentals more than back up their market caps.
For example, through the end of the third quarter of 2021, Apple makes up a little more than 6% of the index but also brought in around 6% of the profits. Google made up 4.5% of the index and 4.3% of net income. Facebook (sorry I’m not calling it Meta) had a 2.4% weighting with 2.5% of profits.
The numbers don’t always match up so neatly1 but these companies sit on the throne for a reason. They have become such a large part of the overall market because their fundamentals have been so strong.
As certain segments of the market have been getting crushed of late it may feel like it’s only huge tech stocks that are doing well but that’s just not the case.
In fact, 85% of S&P 500 companies have positive returns this year.
The S&P is now up 26% on the year. It certainly helps that Apple (+31%), Microsoft (+47%) and Google (+65%) are all having strong years.
But 48% of all stocks in the index are up by more than 26% this year. Nearly three-quarters of stocks in the S&P 500 have risen 10% or more this year.
Interestingly enough, the equal-weighted S&P 500 is also up 26% this year just like the market-cap weighted version.
The mid cap index is up 20% this year. The energy sector is up more than 50%. Financials have climbed 36%. Small cap value stocks are up 24%.
It’s not just big tech stocks soaring. It just feels like that because these stocks are now so important to the overall market.
And there is a reason they are so big and important.
They’ve earned their place at the top of the mountain.
But these aren’t the only stocks rising this year. It just feels that way.
Further Reading:
Market Cap Rules Everything Around Me
1Here are some stocks where this ratio isn’t perfect: Berkshire Hathaway (1.6% market cap vs. 5.3% of profits) and Amazon (4.3% vs 1.6%).
