Consumer debt is on the rise.
This comes from a recent report by the New York Fed:
Total household debt rose $312 billion, or 2 percent, in the second quarter of 2022 to reach $16.15 billion, according to the latest Quarterly Report on Household Debt and Credit. Mortgage balances—the largest component of household debt—climbed $207 billion and stood at $11.39 trillion as of June 30. Credit card balances saw their largest year-over-year percentage increase in more than twenty years, while aggregate limits on cards marked their largest increase in over ten years.
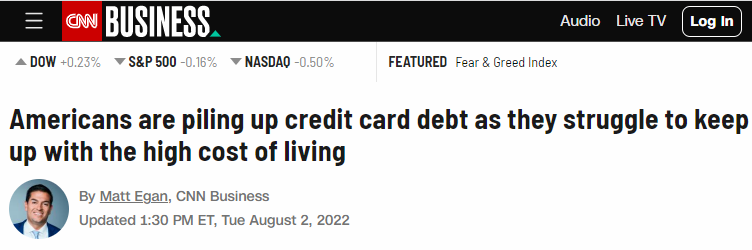
Total consumer debt is now as high as its ever been. Credit card balances were up 13% year-over-year, a big-time increase in the absolute worst form of debt.
This sounds bad.
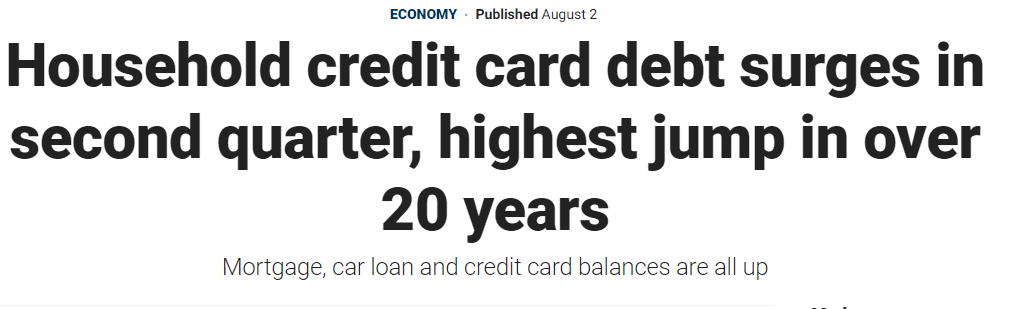
Cue the scary headlines:
I’ll make an uncontroversial statement here — credit card debt is bad. The rates are egregious. Not paying off your credit card balance is one of the worst personal finance choices you can make.
But are things really as bad as the headlines make them out to be?
Let’s take a look at the numbers.
Here is the composition of consumer debt over time:
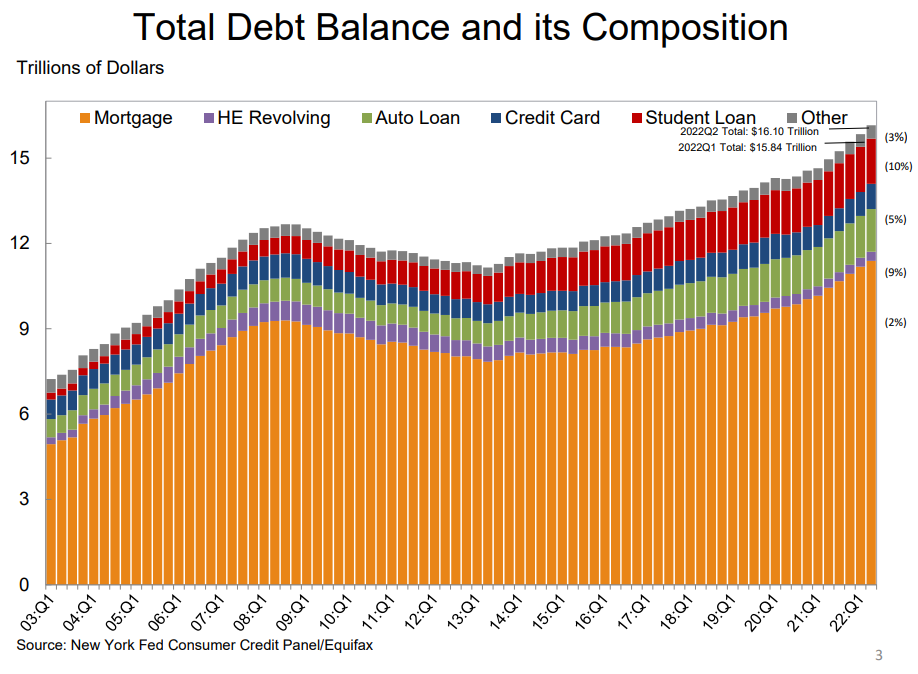
You can see mortgage debt is by far the biggest piece over time which makes sense. The largest increase in market share has come from student loans, which have grown from 3% of the total in 2003 to nearly 10% of all consumer debt now.
Look at credit card debt as a share of the total — it’s remarkably stable over time, making up roughly 8-9% of total debt for years now.
Here’s a look at total credit card debt at every quarter end since 2003:
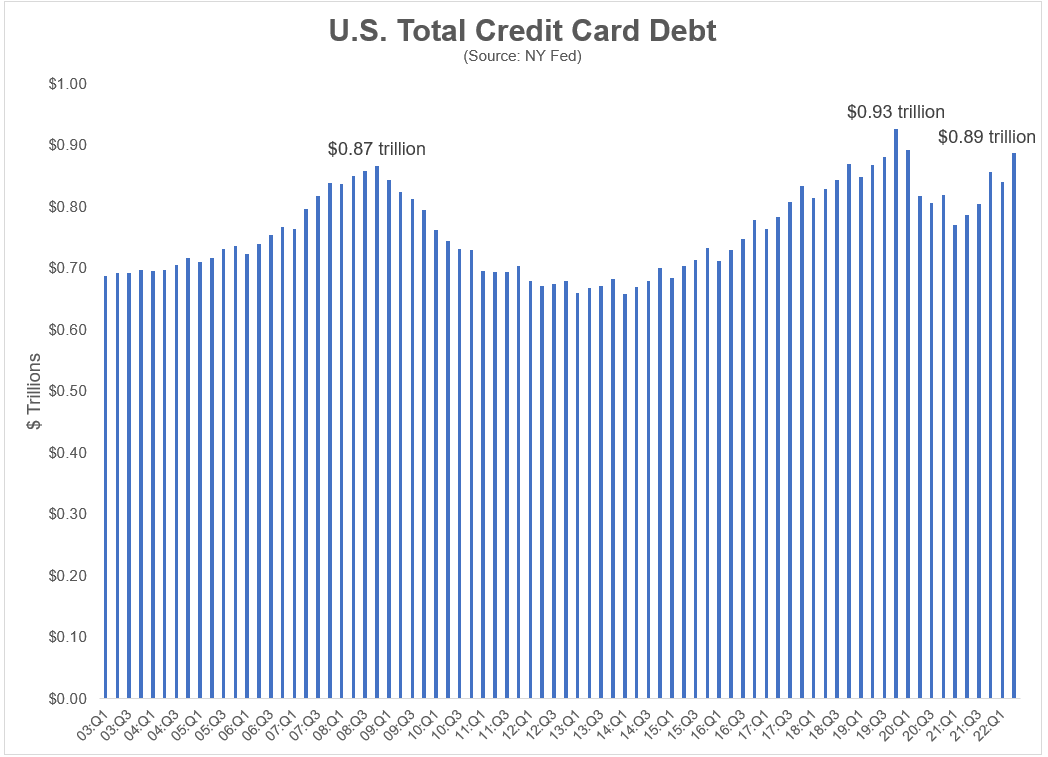
Yes credit card debt is increasing but it’s still below the pre-pandemic highs. In fact, credit card debt today is not much higher than it was in the 4th quarter of 2008. We’ve seen almost no growth in total credit card debt for a decade and a half.
This is because U.S. households shored up their balance sheets following the 2008 financial crisis. They did so again once the pandemic hit.
Yes, inflation is probably a big reason for the rise in credit card debt but this is also people getting their spending levels back on trend.
This may come as a surprise to some people, but the growth in credit card debt has more or less tracked the consumer price index since 2003:
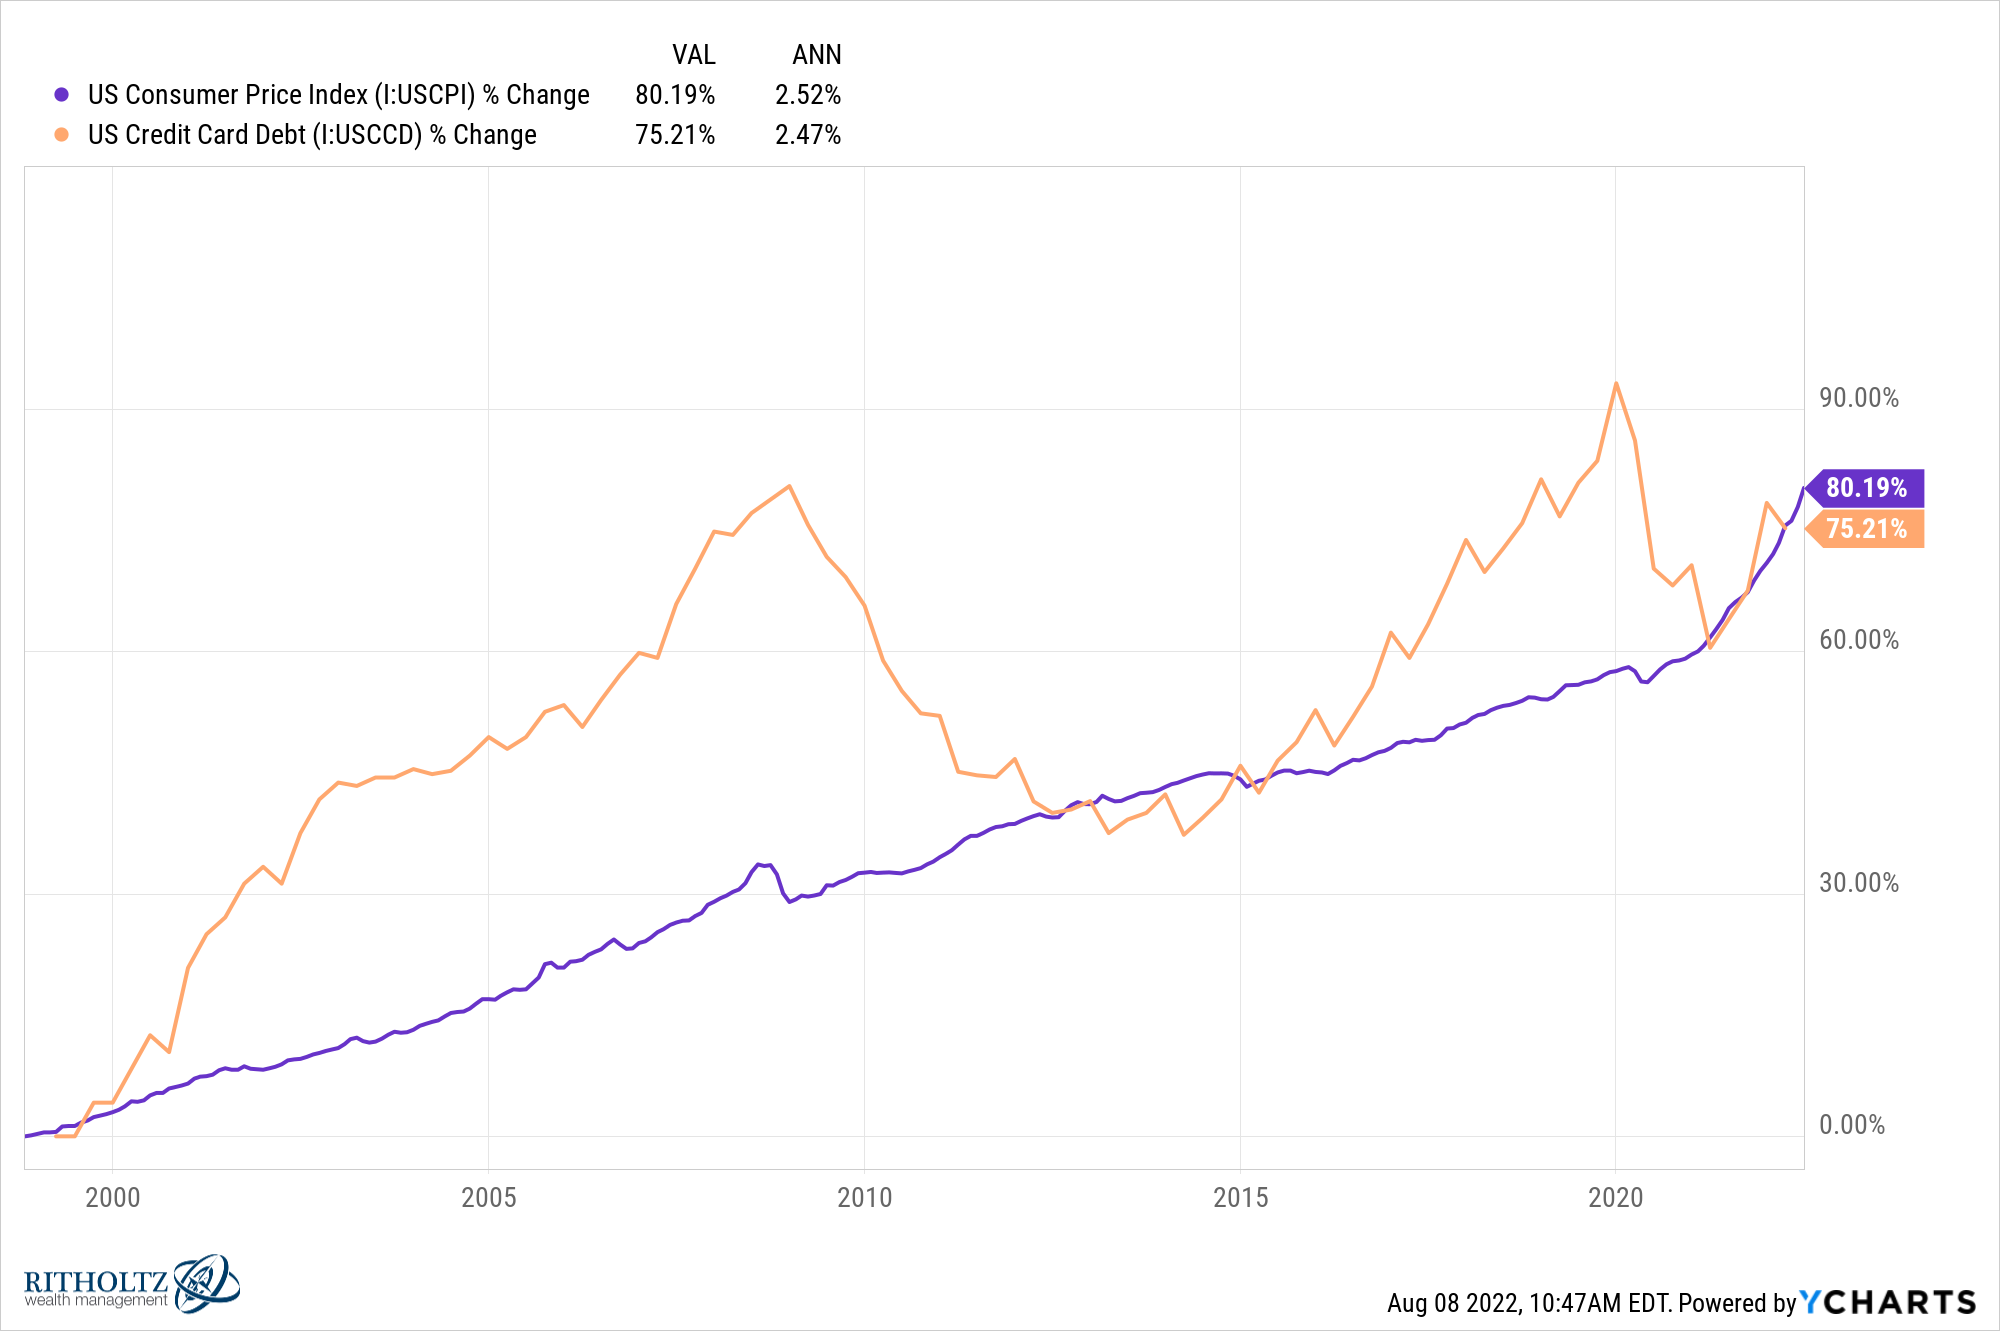
Both are up roughly 2.5% per year in that time. It’s not a perfect relationship but pretty darn close over the long run.
Far from some runaway debt train, it appears credit card usage has been growing just as much as prices for the past 20 years or so.
Now look at the latest delinquency numbers:
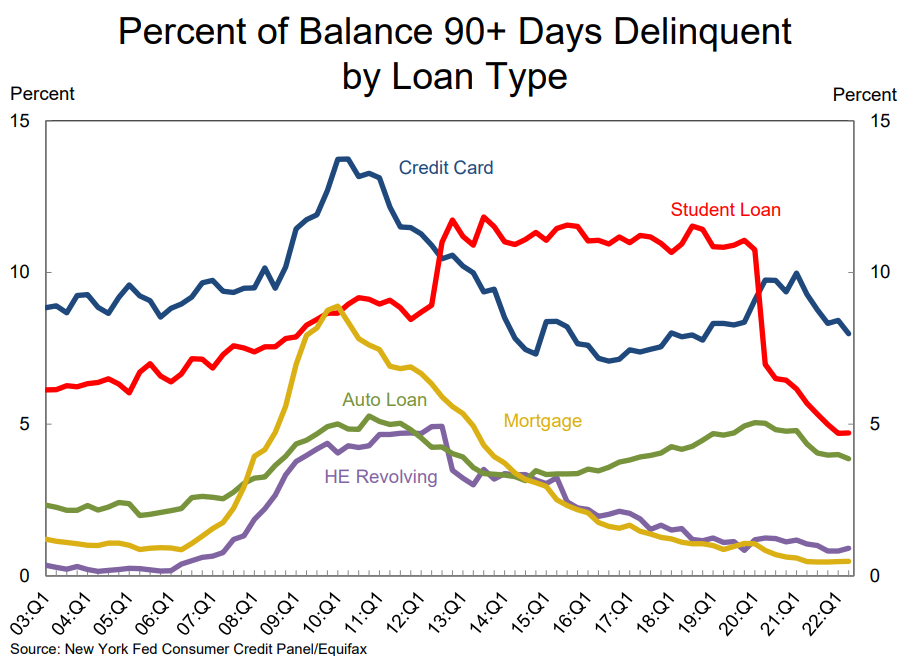
It’s not great overall levels of credit card debt are rising so fast but it doesn’t appear most borrowers are taking on more than they can handle just yet.
So far we’re only looking at one side of the equation as well –the debt.
What about the assets and income that support that debt?
Denominator blindness is our inability to put numbers into context. This is especially true when we’re talking numbers in the billions or trillions of dollars. Big numbers alone don’t tell the whole story.
For example, here is household debt service as a percentage of disposable income:
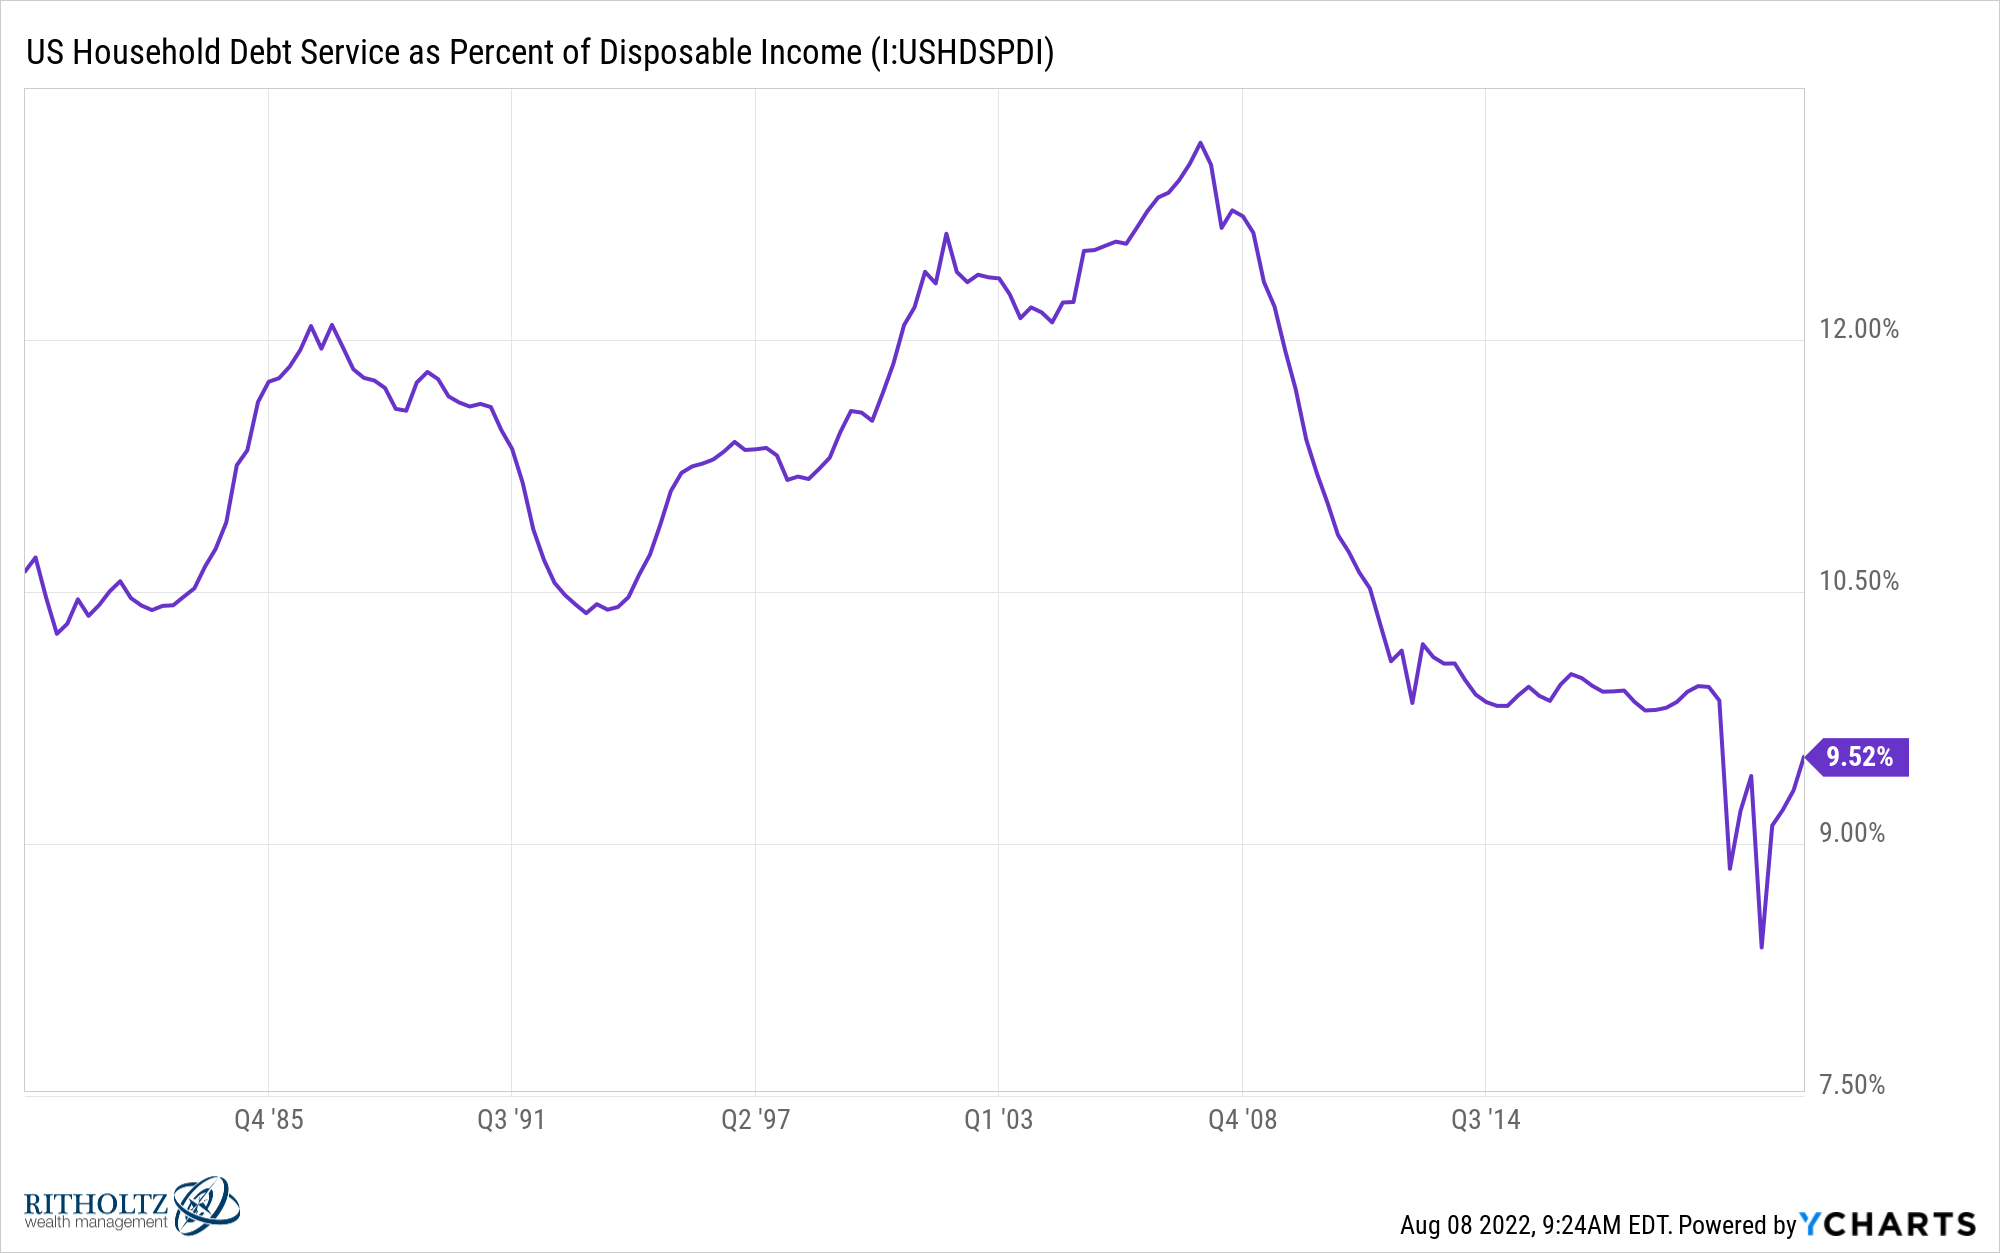
Mortgage debt makes up around 70% of all consumer debt so this one makes sense when you consider how low mortgage rates got these past few years. I would expect this one to rise as interest rates are now higher but it’s still well below the normal levels consumers dealt with in the 1980s and 1990s.
Things look even better when comparing total consumer debt to financial assets:
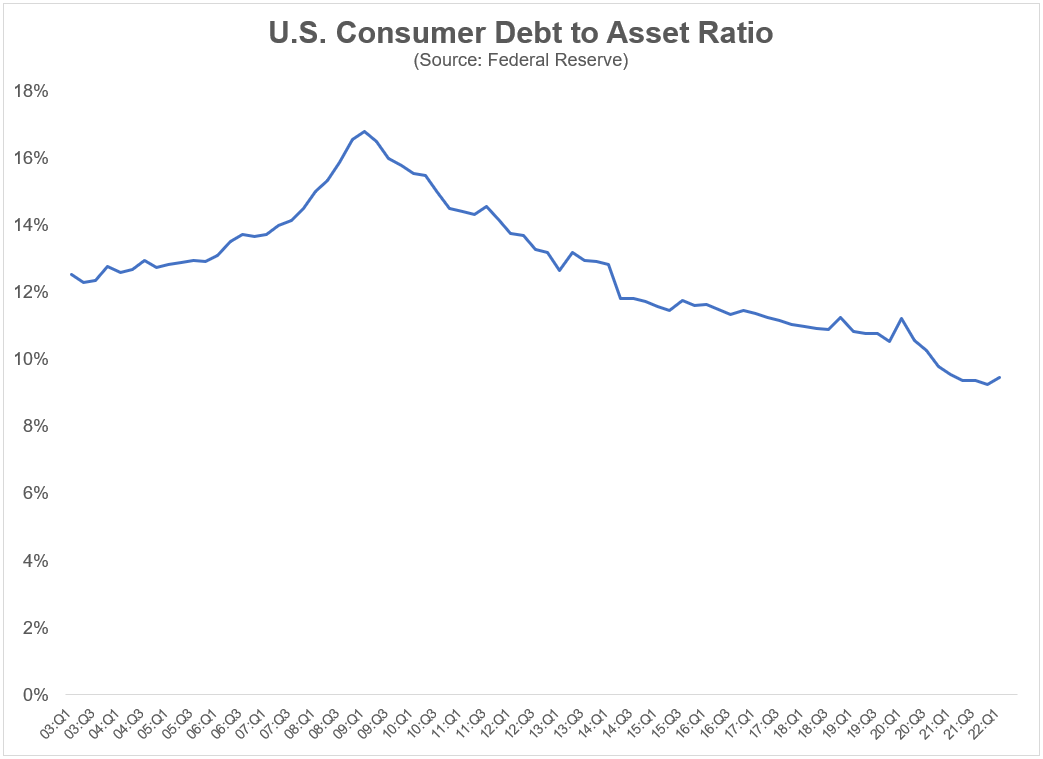
This ratio is about as low as its ever been going back to the inception of this data in 2003. Yes, debt has grown but total wealth has grown at an even faster clip.
People are simply wealthier today.
Of course, the distribution of debt to assets is not equal across all households but U.S. consumers are in a fairly good position, on average.
The same is true of the housing market:
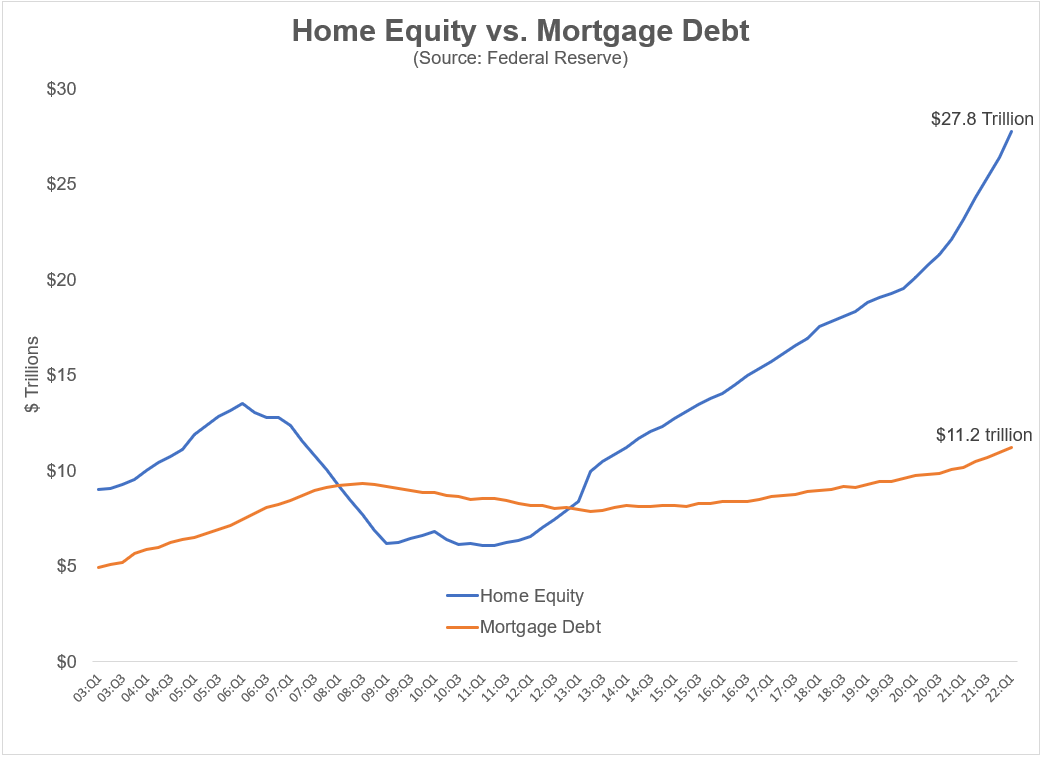
Mortgage debt is higher but the amount of home equity homeowners have now dwarfs those debts.
These relationships are not set in stone. They can flip in a hurry. If we go into a nasty recession you would expect these ratios to get worse. That’s kind of how this works.
But debt levels aren’t worrisome at the moment when you put them into perspective.
Household finances are far from perfect but this is not an end-of-the-world situation right now.
Further Reading:
The Michael Scott Economy

