Over the past 100 years or so, the U.S. stock market has reached an all-time high on roughly 5% of all trading days.
Looking at this statistic another way, 95% of the time the market is in a state of drawdown.
If you look at the U.S. stock market right now you can see we are roughly 5% off all-time highs:
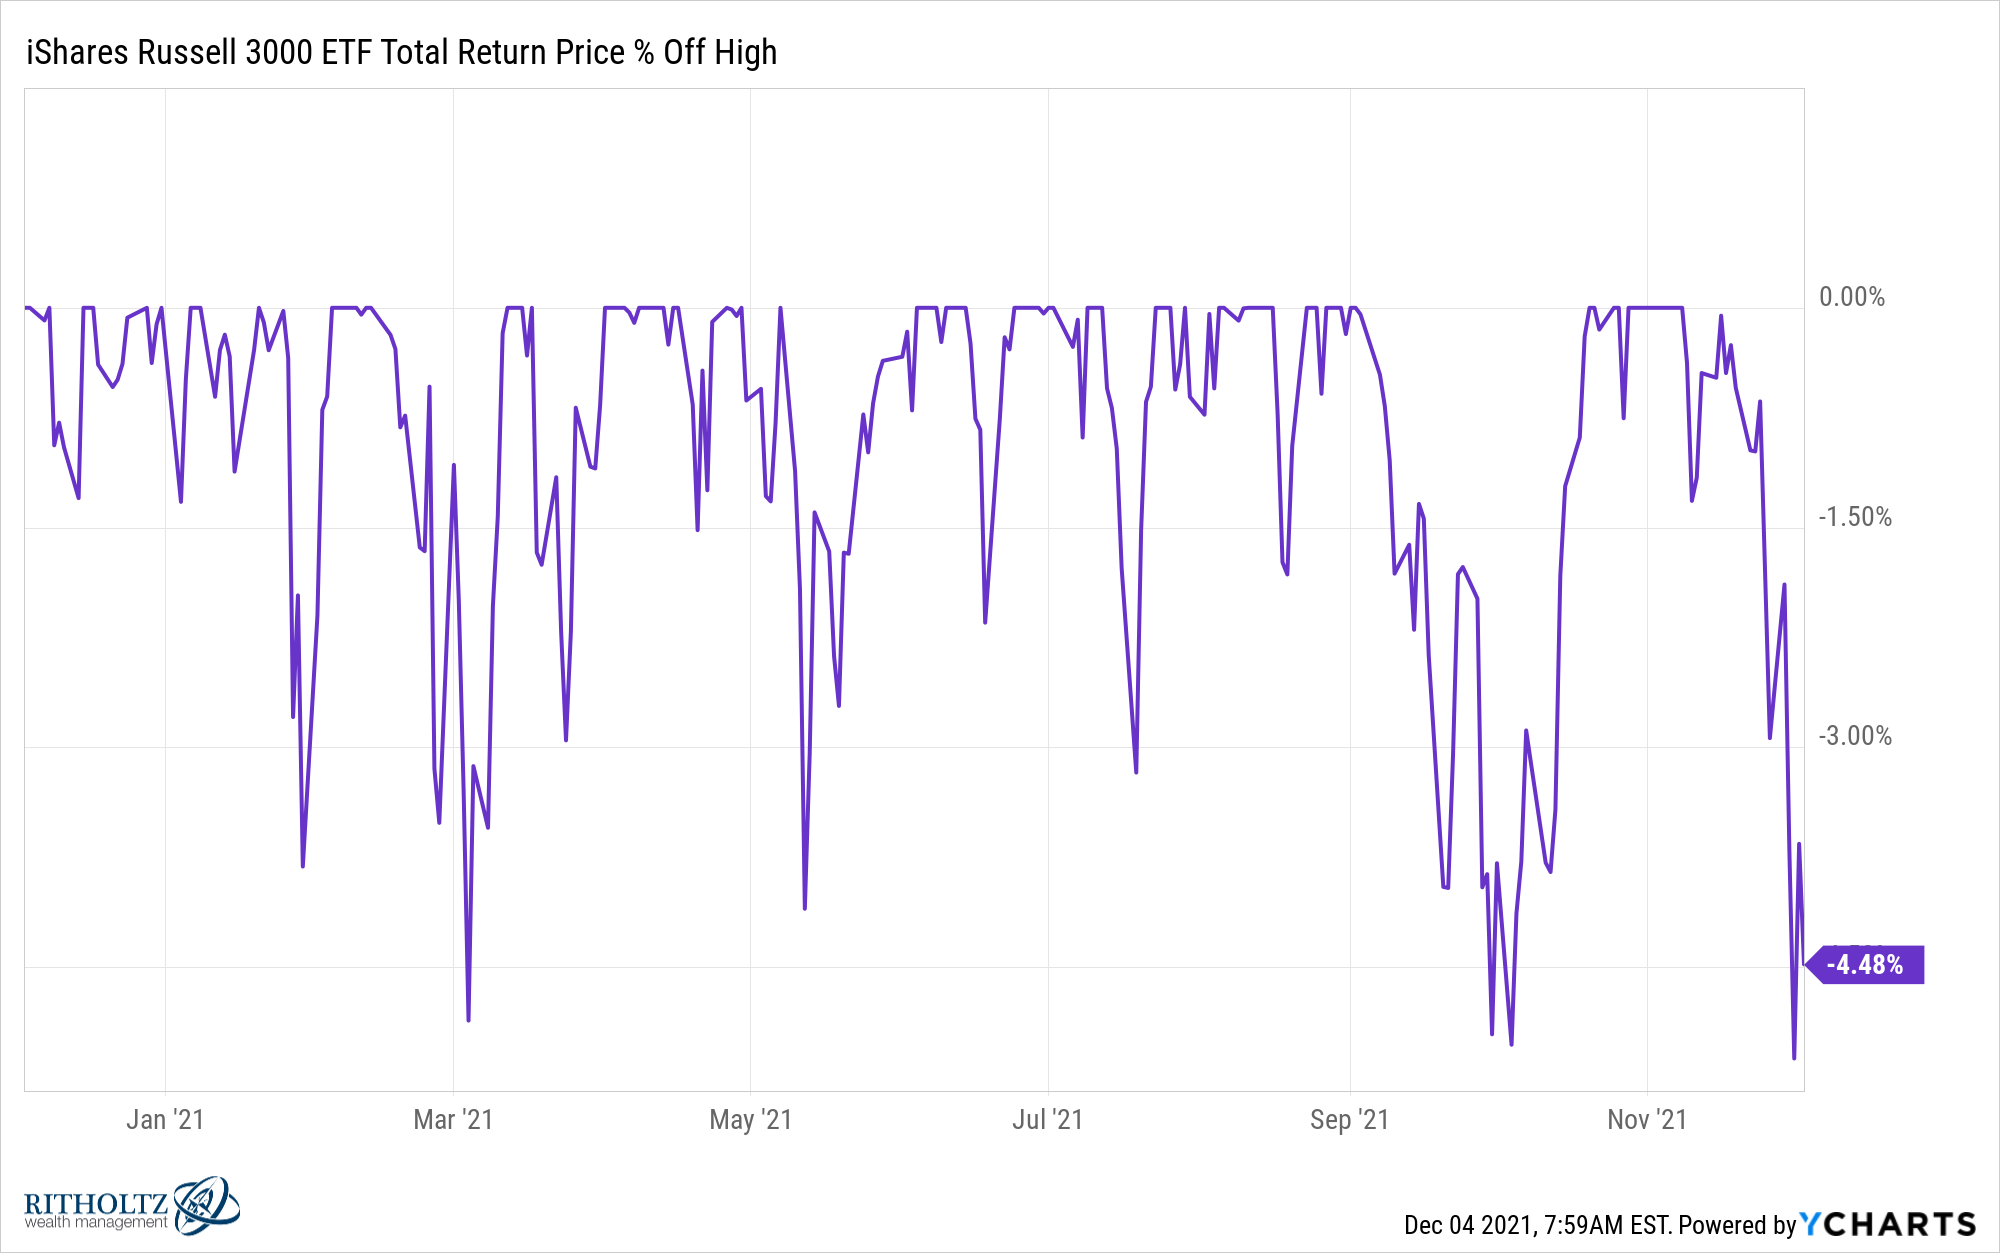
You can see over the past year or so the drawdowns have been relatively muted. The worst peak-to-trough drawdown was just -5.1%.
If you’re invested in stocks you can and will see much bigger losses. This is merely a flesh wound.
And if you’ve been invested in various stocks outside of a market-cap weighted index like the Russell 3000, you are experiencing much bigger losses at the moment.
While the market is up roughly 23% over the last year, one-third of all stocks have negative returns in that time.
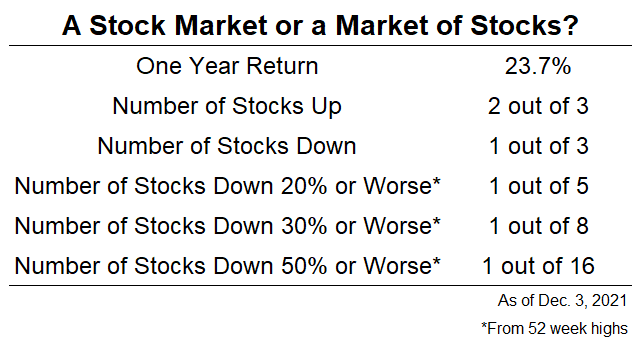
One out of every 5 stocks is down 20% or worse from its 52 week high. One out of every 8 stocks is down 30% or more from 52 week highs and more than 6% of stocks are down 50% from one year highs.
There are a few ways investors look at numbers like these.
People who are apt to worry will look at these numbers and assume things are worse than they appear if you don’t look under the hood.
That’s certainly a possibility. All of these stocks that are falling could be a canary in the coal mine situation where the rest of the stock market could follow their lead.
Here’s another way to look at this — most of the stocks in the index simply don’t matter anymore when market capitalization is the weighting criteria.
The biggest stocks in the index aren’t falling as much as the rest of the stocks that are currently getting crushed. Here are the top 20 names in the Russell 3000 along with their one year total returns:
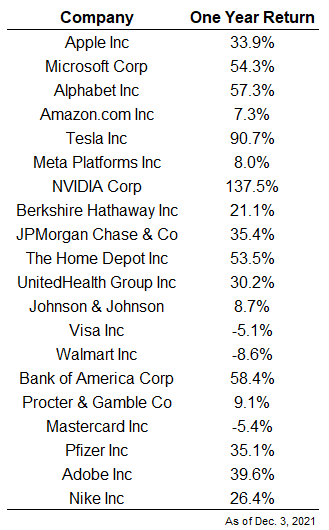
The average return of the top 20 names over the past year is almost 35%. Just 3 out of the top 20 are down over the past 12 months (Mastercard, Visa and Walmart). And only 3 out of the top 20 are in a bear market from 52 week highs at the moment — Facebook (-22%), Visa (-23%) and Mastercard (-21%).
So while there are a number of stocks getting killed in the index at the moment, the stocks that matter still have wonderful returns.
Now you could make the case these huge stocks will have a negative impact on the overall market if and when they all decide to take a big dive. That’s obviously a risk for a market cap-weighted index.
But for now really the only thing that matters to the overall market is the biggest stocks. The top 20 stocks by market cap make up around 35% of the index. This is the tail that wags the dog.
The market doesn’t really care if all of the other stocks are getting killed…yet.
Michael and I discussed this dynamic on this week’s Animal Spirits and much more:
Now here’s what I’ve been reading lately:
- The truth about those dollar stores (Consumer Reports)
- America is running out of new ideas (The Atlantic)
- Who the f*ck cares about Adam McKay? (Vanity Fair)
- Escape your bubble (Of Dollars & Data)
- You may love your work but it doesn’t love you back (A Teachable Moment)
- We built a crypto index (Irrelevant Investor)
1I wrote this post mid-day so it’s possible these numbers will change by the end of the day a little.

