In the grand scheme of things consumer debt is still a relatively new phenomenon.
Back in the 1800s and early 1900s banks didn’t extend consumer loans widely because most people assumed consumer credit was too dangerous. The assumption was consumers needed protection from themselves.
This is still true for some people but the economy never would have grown as much as it has if there wasn’t so much borrowing.
The first time consumers borrowed money in a big way was during the Roaring 20s. There was an onslaught of consumer goods the likes of which we had never seen before from radios to washing machines to refrigerators to automobiles to vacuums and more.
The Great Depression put an end to that borrowing binge but consumers came back with a vengeance during the post-war 1950s economic boom times. The middle class moved to the suburbs following the war and they wanted to spend money.
The first widely adopted credit card burst onto the scene in the late-1950s from Bank of America and consumer debt habits haven’t been the same ever since.
Consumer credit went from $2.6 billion to $45 billion between 1945 and 1960. By 1970 it was $105 billion.
Debt used to be frowned upon. Now it’s a way of life.
In his book A Piece of the Action, Joe Nocera notes, “Between 1958 and 1990, there was never a year when the amount of outstanding consumer debt wasn’t higher than it had been the year before.”
Credit card companies were literally sending them out to households in the mail. In 1967 alone there were 32 million credit cards issued out of a population of 197 million.
One would think the great inflation of the 1970s would cause households to rein in their spending by cutting back. That assumption would be wrong.
Nocera explains how the inflationary decade caused households to spend even more money:
“It turns out that people can scramble and keep up longer than you think they can,” Barry Bosworth once remarked. That’s part of the reason why stamping out inflation was so hard: people spent as much time adapting to it as they did complaining about it. Americans who lived on fixed incomes devised strategies to keep their income rising with the inflation rate. People who could feel their standard of living slipping away tried to figure out ways to pull it back up. The most common way was to insert both spouses into the workforce; this was the moment that saw one of the seismic shifts in American life, the emergence of two-income couples. Wives joined the workforce by the millions, motivated in part by the need to keep pace with inflation. Whereas two-income couples made up a third of the nation’s families in the late 1960s, a decade later, that number had risen to around 45 percent.
In 1975, for instance, a year when credit card debt totaled close to $15 billion, total consumer borrowing stood at $167 billion. By 1979, with the inflation rate in double digits, credit card spending had more than tripled. But the rate of total consumer borrowing had also grown rapidly: it was closing in on $315 billion. This was the real eye-popping figure, and the one that held the most significance. A 90 percent jump in total consumer borrowing in only three years.
Debt became a way of life because it was partially eroded by the corrosive effects of inflation. That spending continued during the 1980s, 1990s and beyond.
Now the U.S. consumer might be the most powerful economic force on the planet.
Consumers have certainly helped keep the U.S. economy out of a recession.
But once all of the excess savings from the pandemic are spent many people worry it will require more debt to keep the party going.
Here’s a story from Yahoo Finance about how credit card debt has surpassed $1 trillion in the U.S. for the first time in history:
Total balances on credit cards and other revolving accounts reached $1 trillion the week of July 26, up from $998 billion the prior week, the Federal Reserve Bank of St. Louis reported Friday.
That’s the highest level on record and $193.4 billion more than the start of the year and $264 billion above the $736 billion in April 2021, the lowest level since the onset of the pandemic.
The increase in indebtedness comes as interest rates on credit cards remain near 40-year highs and delinquencies, especially among younger borrowers, increase. And with the federal student loan forbearance set to end this fall, millions of Americans may find themselves relying on credit even more.
I understand the concern here.
Credit card debt is poisonous to your finances if you don’t pay it off every month. Paying off credit card debt is my number one rule of personal finance.
But we have to look beyond the big scary number syndrome here and put this figure into context.
Just because credit card debt can be ruinous for some households doesn’t mean it has to take down the U.S. economy.
It is true that credit card debt is up a lot since early-2021:
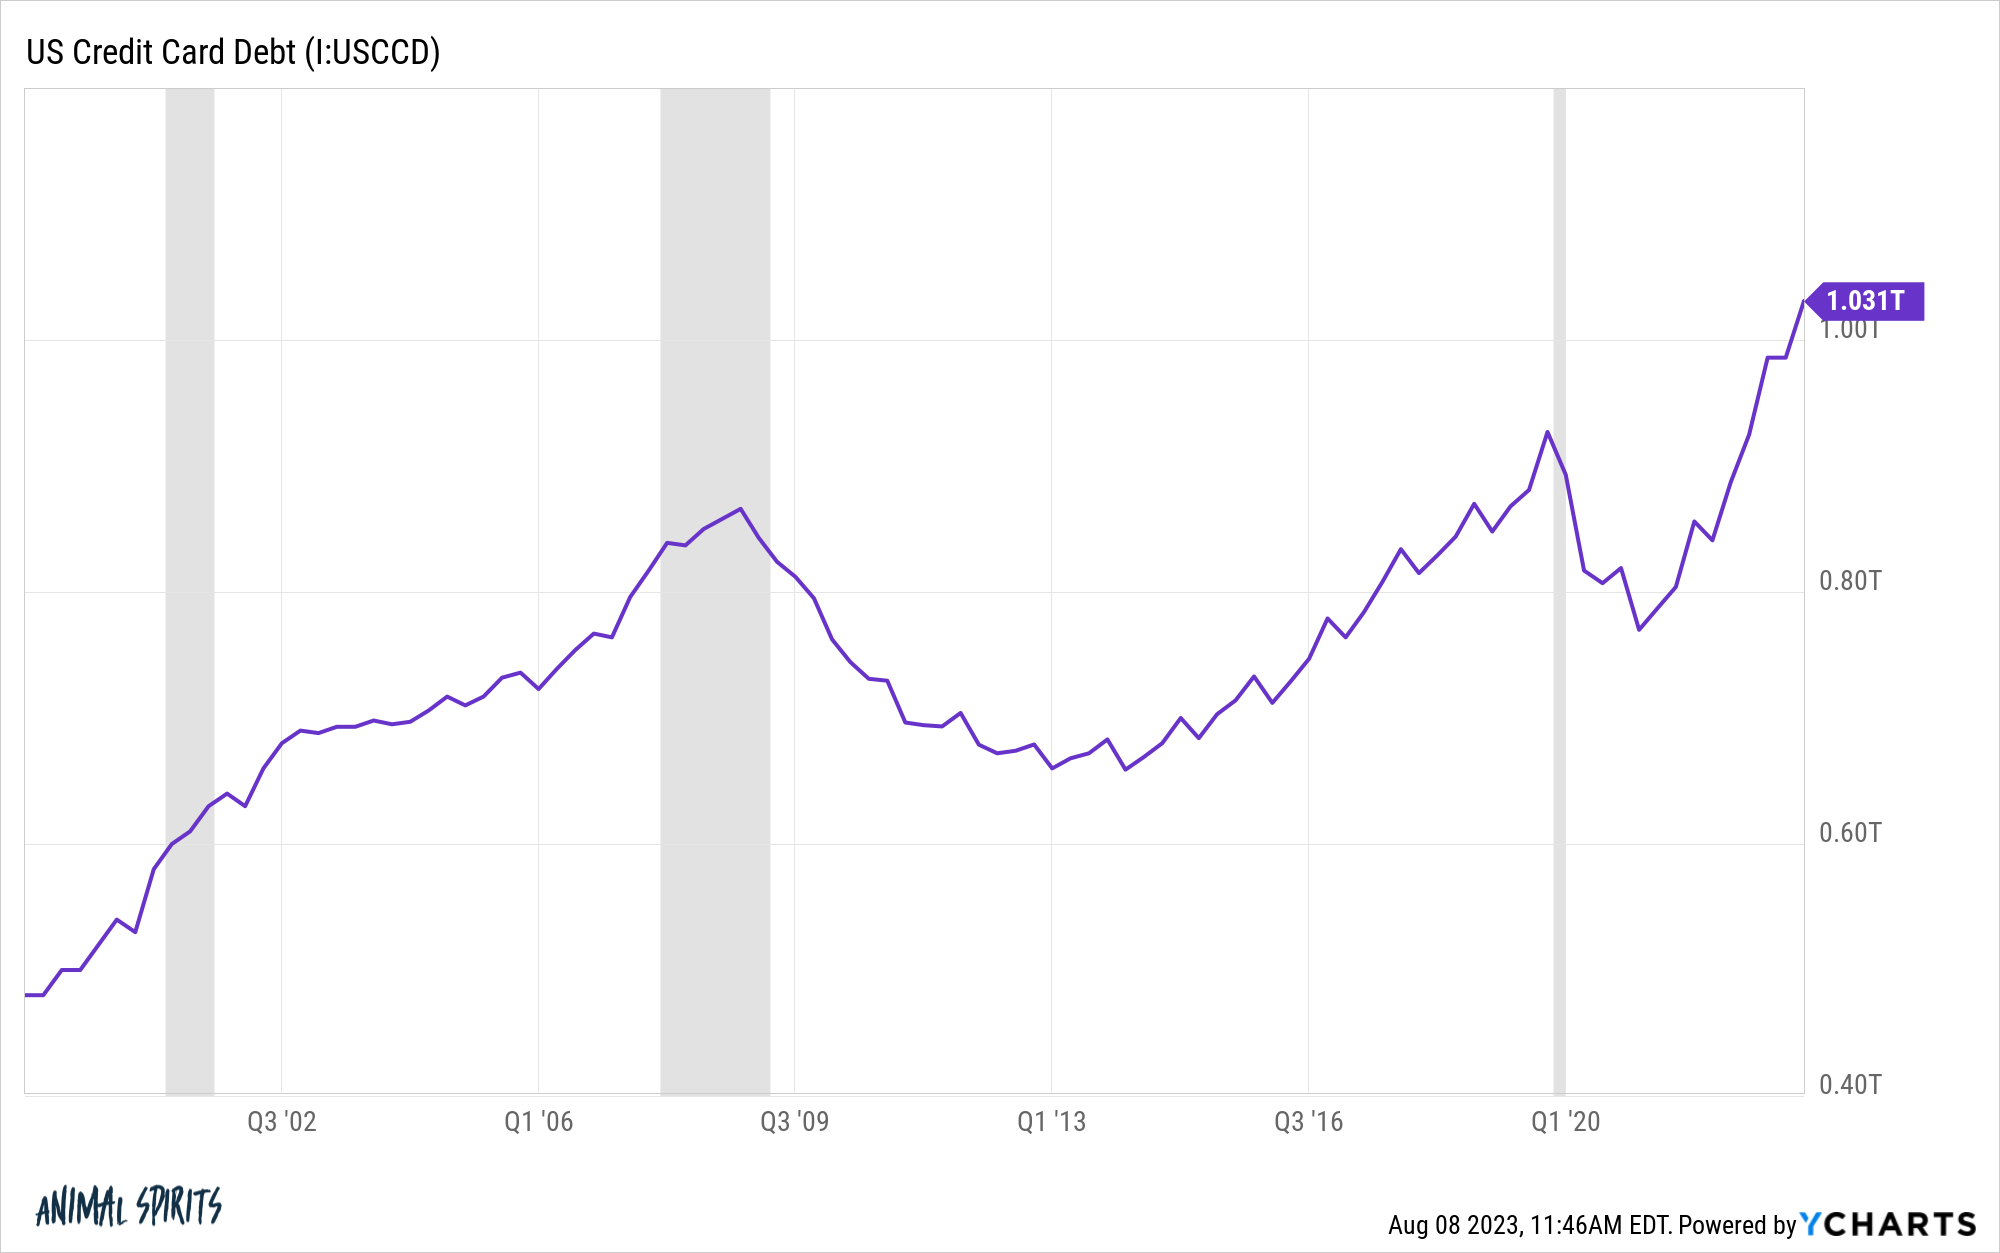
But that’s also because it was down a lot from people paying off their debts during the pandemic. From the end of 2019 through early-2021, credit card debt fell from roughly $927 billion to $770 billion.
And the increase in credit card debt doesn’t look nearly as bad when you compare it to what’s happened to financial assets and the size of the economy these past few years:
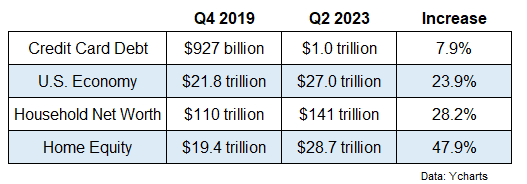
The economy, household net worth and home equity have all grown substantially faster than credit card debt since the pandemic started.
Now, you could make the argument that the households that are impacted by credit card debt aren’t impacted by rising financial asset prices as much as the top 10% of the wealth spectrum.
That’s fair.
The bottom 50% by wealth holds just 6% of financial assets such as stocks and bonds but carries around a third of total household debt.
But this group has seen their fortunes change during the pandemic as well.
Total net worth for the bottom 50% was just $400 billion in 2011 after getting decimated during the 2008 financial crisis. By the end of 2019 that number was up to $2 trillion. As of the latest reading, it’s now $3.4 trillion.
The bottom 50% (green and orange lines) has also experienced the highest wage gains during this cycle.
Credit card debt hasn’t kept up with income or assets this decade.
We can also look at credit card debt relative to other types of household debt (courtesy of the Federal Reserve):
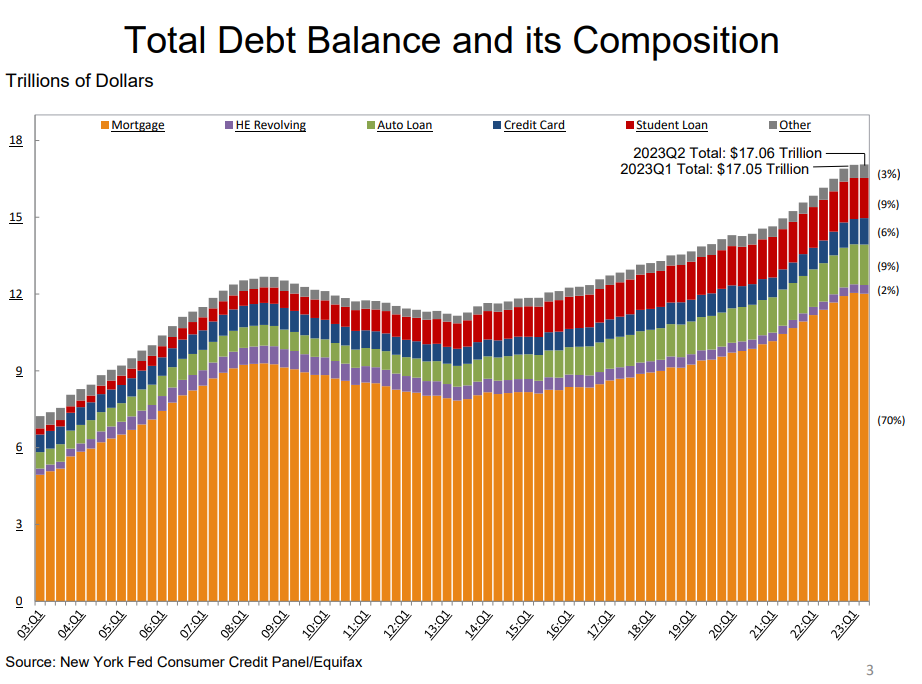
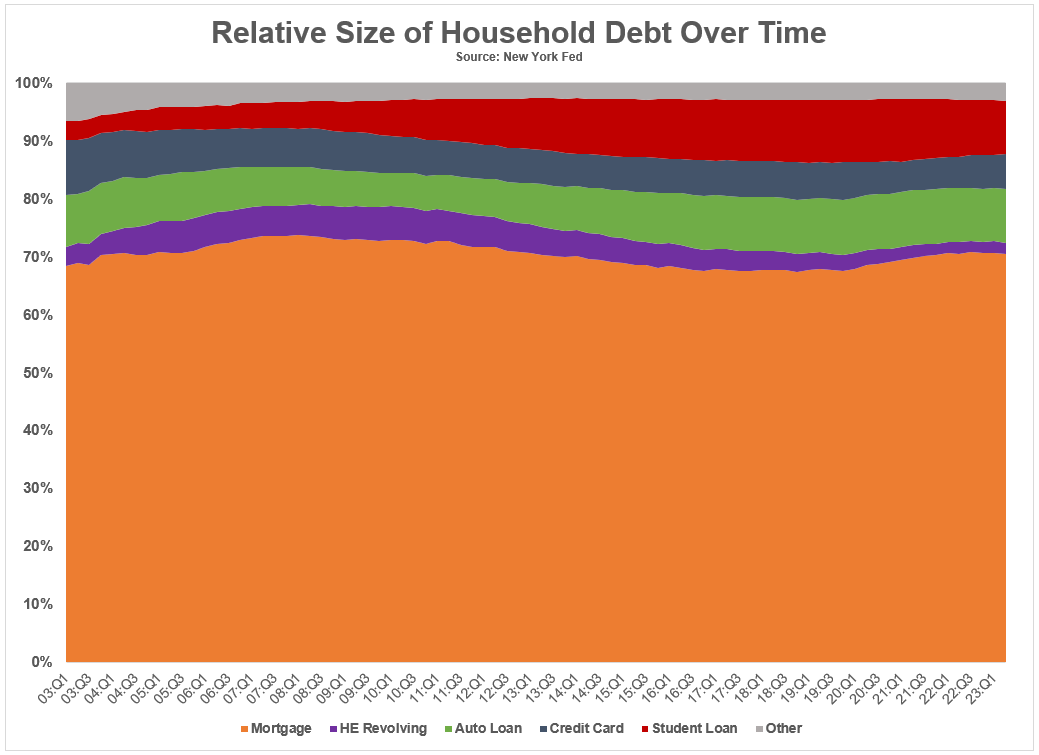
This shows the total levels of debt but if we look at the relative weightings to total debt1 you can see credit card debt has either fallen or remained in a tight band over time:
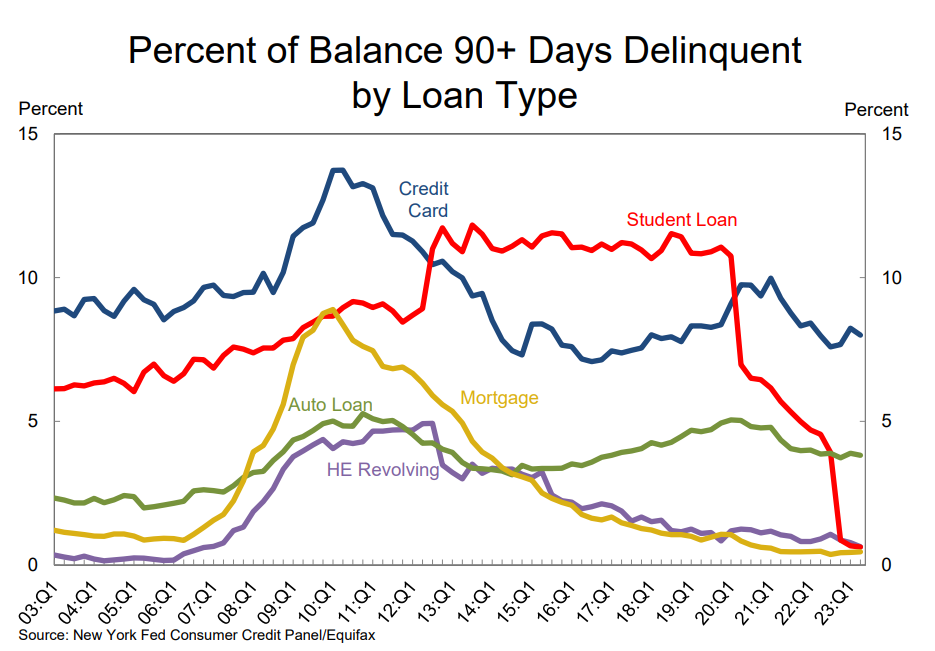
Delinquencies are not showing signs of weakness just yet either:
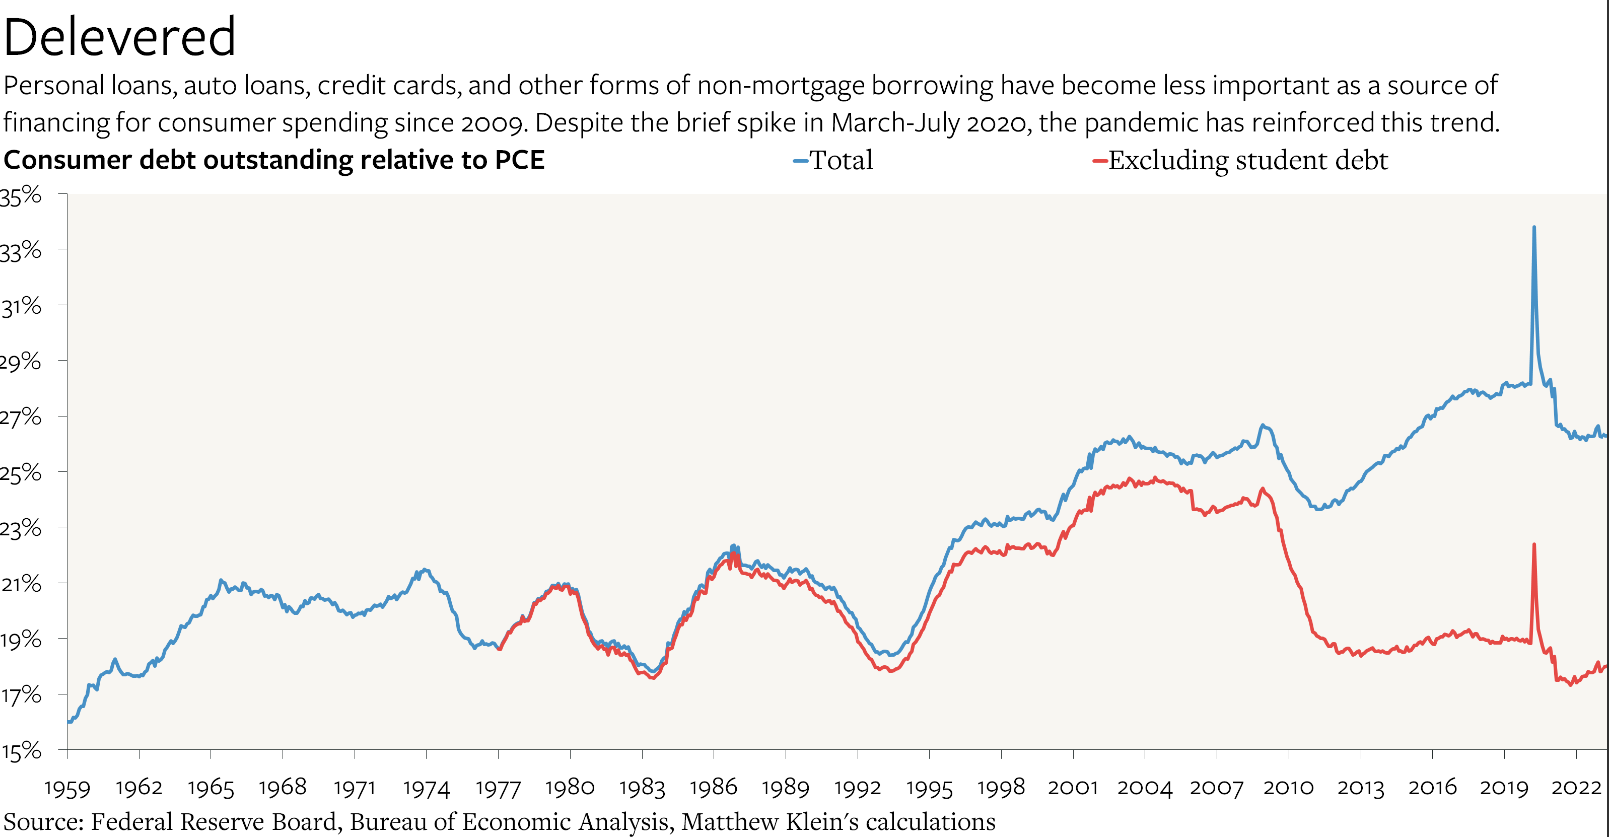
Matthew Klein created this great chart at The Overshoot that shows consumer borrowing, adjusted for inflation, has actually become a less important source of spending in recent years:
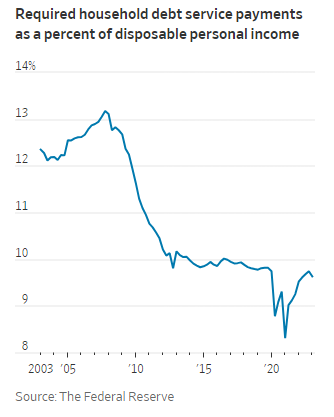
And finally, The Wall Street Journal shows household debt service payments as a percentage of disposable income are nowhere near the highs of the Great Financial Crisis days:
There are always going to be households who rack up unsustainable levels of credit card debt regardless of the economic environment but right now things look pretty good as far as the collective consumer is concerned from a debt perspective.
There could come a time when Americans go deep into credit card debt to keep the spending binge going.
I personally think it’s going to be difficult for households to cut back now that they’ve gotten a taste for traveling and going to Taylor Swift concerts these past couple of years following the dark days of the pandemic.
But right now there isn’t much need to worry about the consumer when it comes to credit card debt.
Further Reading:
Why Are Credit Card Interest Rates So High?
1Student loans have gained share over time going from 3% in 2003 to more than 9% of total debt now.

