To be a successful investor you need to possess a number of different traits.
You need to understand how math, statistics and probabilities work. You need to understand how corporations and the global economy generally function over the long haul. You need an understanding of how the different asset classes behave from a risk and reward perspective.
You also need a deep understanding of financial market history from booms to busts.
And you need the emotional discipline to stick with a reasonable investment strategy from manias to panics and everything in between.
I gave a talk to a group of financial advisors in Montreal recently that focused on these last two traits — history and behavior — through the lens of the evolution of financial advice over the decades.
It’s a new presentation I’ve based on the research I’ve been putting together on this blog over the years.
Here’s a summary of the history side of it:
I’m a huge proponent of thinking and acting for the long run when it comes to financial markets. But it’s not that hard to make the case for the stock market when you have 10% or so annual returns over the past 100 years to look back on.
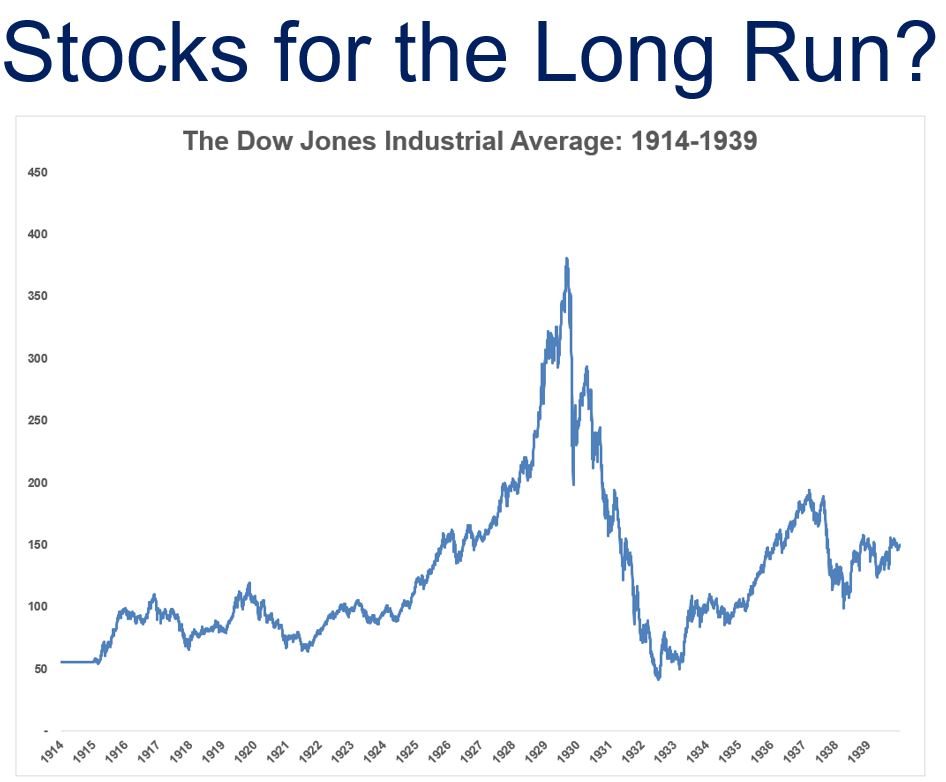
Imagine what it would have been like to talk about stocks for the long run heading into the 1940s. Here’s what investors lived through heading into that decade:
- The stock market closed for 6 months at the onset of World War I in 1914. Liquidity simply dried up when everyone went to war.
- The Roaring 20s saw a boom in consumer and financial products unlike anyone had ever seen up to that point.
- The bust that began in 1929 was also unlike anything anyone had ever seen. The stock market fell something like 85% from the Sept 1929 peak.
- The Dow wouldn’t make new highs again until 1954.
The history books make it seem like everyone was wiped out during The Great Depression stock market crash but most people didn’t even own stocks back then.
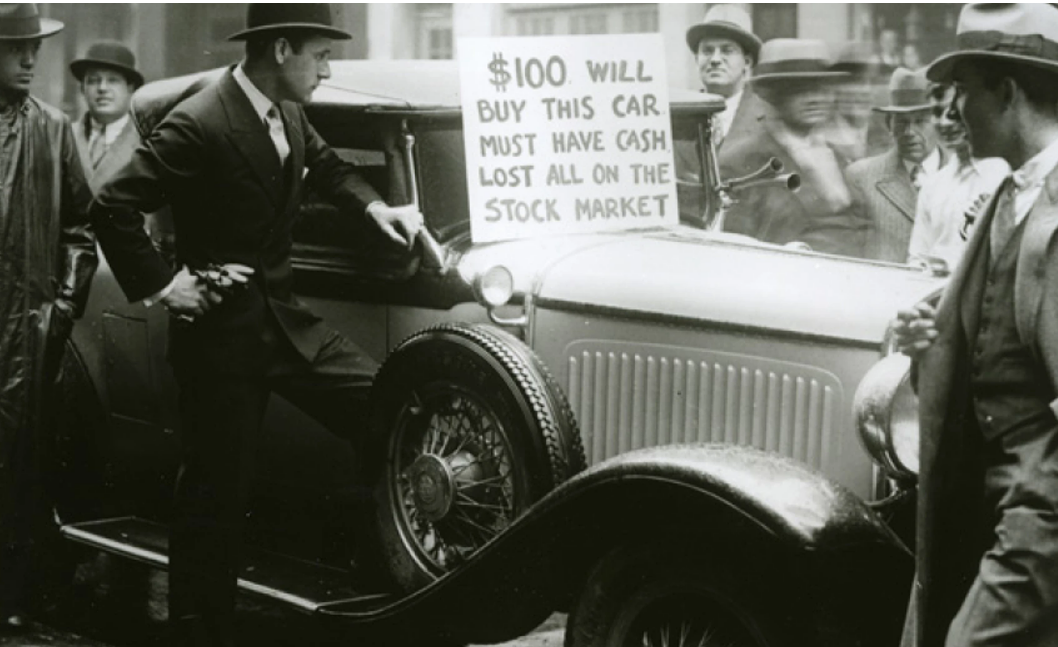
In fact, just 1.5 million people owned stocks by 1929 out of a population of approximately 120 million, a little more than 1% of the population.
The crash was gut-wrenching but the economy collapsing and 25% unemployment had a much bigger impact than the stock market for U.S. households.
The barriers to entry were so much higher back then when it came to investing and that includes knowledge about the subject as well. No one knew much about how markets functioned.
Merrill Lynch tried to change all that when they tasked Louis Engel with creating the first modern advertisement for the stock market in 1948.
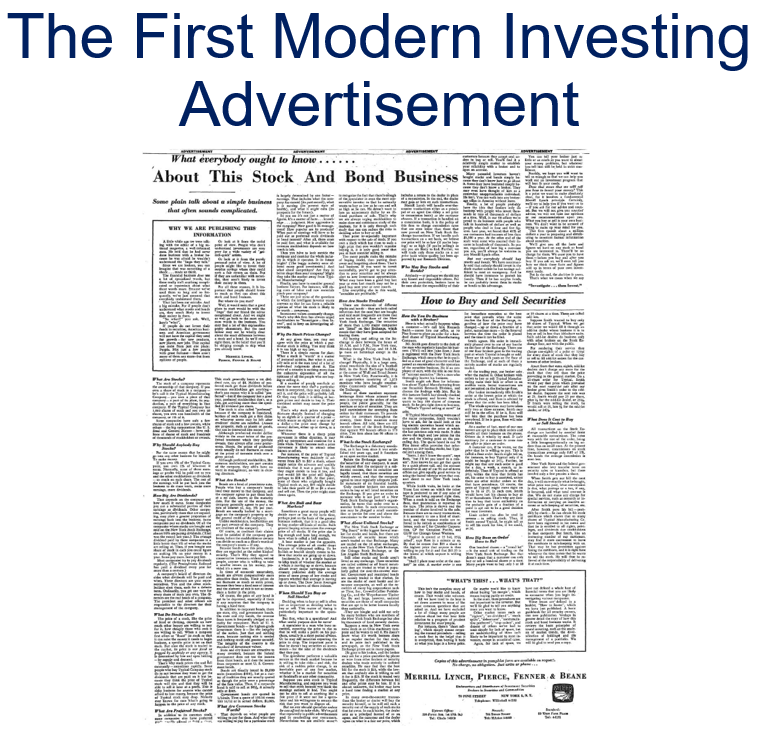
It appeared in the New York Times, took up an entire page of the paper and ran more than 7,000 words. The ad was basically the first investing blog post ever published explaining to people why they should buy stocks, how to buy stocks, why stock prices change and how stocks are traded.
It was expensive but it was a huge success. Merrill said they received more than 3 million responses to the ad, which gave their brokers millions of new prospective clients.
If any of those 3 million people put their money into the market in the late-1940s it was fortuitous timing.
The 1950s bull market was one of the biggest in history.
The problem is most people still weren’t all that interested in the markets, mainly because most people didn’t have any disposable income to invest.
That would all change in the post-World War II world. The economic malaise following the Great Depression didn’t really end until World War II kicked off a spending and manufacturing spree unlike anything the world had ever seen up to that point.
The boom times following the war changed the trajectory of the United States and the rest of the world in terms of growth, jobs, income, demographics and wealth.
In 1929 nearly 60% of American families had incomes that placed them below the poverty line. The average pay for manufacturing workers was up almost 90% between 1939 and 1945. The disposable income for all Americans rose nearly 75% between 1929 and 1950.
By 1945, GDP was 2.4 times the size of the economy in 1939. Financial historian Frederick Lewis Allen called it, “the most extraordinary increase in production that had ever been accomplished in five years in all economic history.”
The middle class was also more or less born of that post-World War II era through a combination of a federal housing bill, a baby boom, and the large number of soldiers coming home looking to settle down.
The number of new single-family homes being built grow from 114,000 in 1944 to 1.7 million by 1950. Owning a home became the new American dream and basically anyone with a decent job could afford a home by the 1950s.
Now that people owned a home and had some disposable income they could finally think about investing some of their capital.
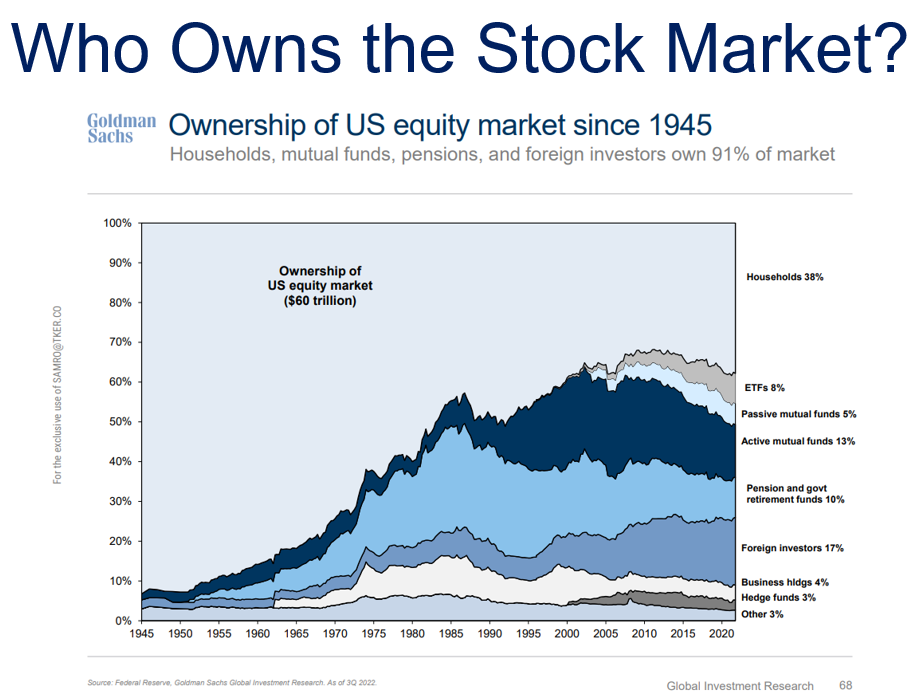
Nearly 95% of all stocks in the 1940s and 1950s were owned by individual investors. They were mostly buy-and-hold investors, just looking to earn some dividends. More than 95% of all trading was done by individual investors. Today that number is more like 2% with 98% of trading being carried out by institutional investors and machines.
Wall Street wasn’t Wall Street just yet. Things were still fairly rudimentary in terms of institutionalization.
One of the other reasons ‘stocks for the long run’ wasn’t really a thing back then is because no one knew what the long-term returns in stocks even were. No one had the data to compile a long-term track record for the stock market.
Remember our guy Louis Engel, the one who created the first modern investing advertisement?
He helped on this front too.
Engel contacted the Chicago Graduate School of Business, who said they would perform a historical study if Merrill Lynch would agree to fund it. So in the early 1960s a group of professors collaborated on a historical dataset of NYSE-listed stocks from 1926-1960.
It took them nearly four years to complete what is now known as the Center for Research in Security Prices (CRSP). CRSP data provided, basically for the first time ever, the average long-term returns in the stock market. For once, all of those brokers had some ammunition because they were pretty darn good.
Even with the gargantuan crash during the Great Depression, the U.S. stock market was up more than 2,700% in total from 1926-1959. That’s 10.3% per year, way higher than anyone assumed.
The problem is it was still relatively difficult to gain access to the stock market if you didn’t have the ability to pick stocks yourself and the costs were still insanely high.
Mutual funds took off in a big way during the 1960s but 1970s would take it to another level, ushering in some of the biggest breakthroughs investors had ever seen.
John Bogle’s newly formed investment firm Vanguard released its first index fund on December 31, 1975.
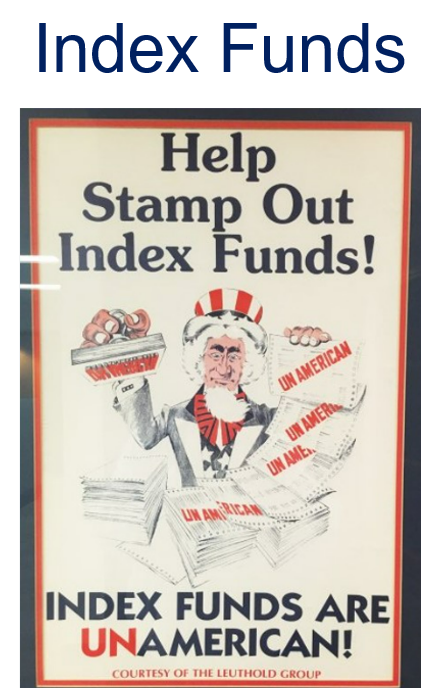
Bogle hoped the fund would raise $150 million. Instead, it raised a little more than $11 million. And that first Vanguard S&P 500 Index Fund came with a hefty 8.5% sales load.
The precipitous decline in fees can be traced back to both Vanguard and a change in rules instituted by the SEC back in 1975. That’s when the SEC abolished fixed-rate commissions for stock trading.
Before then investors were paying an average of 1-3% to buy or sell a stock. So the costs didn’t scale even if the size of your trades went up. Plus the bid-ask spreads were wide enough to drive a truck through.
Look at how far both have fallen since:
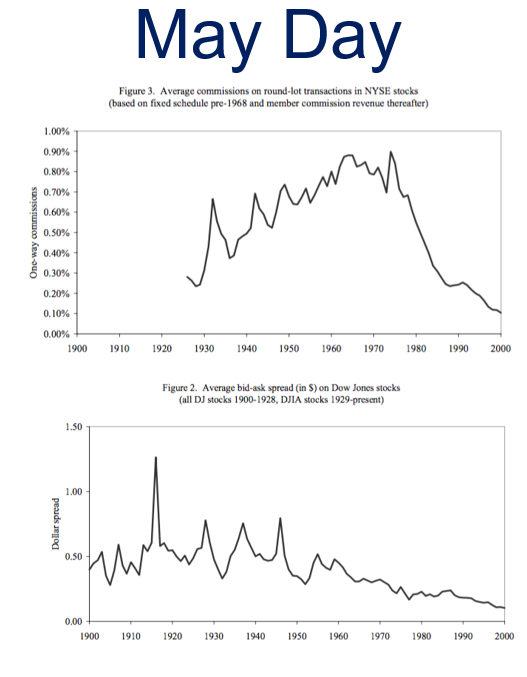
Individual investors have gone from paying high fees with huge spreads to zero dollar trades, more liquidity and narrower spreads.
May Day helped usher in the discount brokerage firm.
Charles Schwab opened its first branch just 4 months later. A company like Robinhood doesn’t exist without May Day or Charles Schwab.
Investors came out of the 1970s with fees finally heading in the right direction, more investment options and easier access to the markets.
Yet fewer than 20% of households owned stocks in some form by the early-1980s. That’s better than Great Depression levels but still relatively low.
The 1970s were a crummy decade for investors because inflation was so high but one of the reasons so few people owned stocks is because many people relied on pension plans for their retirement.
That started to change in the late-1970s when defined contribution retirement plans were created, first the IRA and then the 401k.
You can see more than 80% of the money in the stock market was taxable in the 1960s:
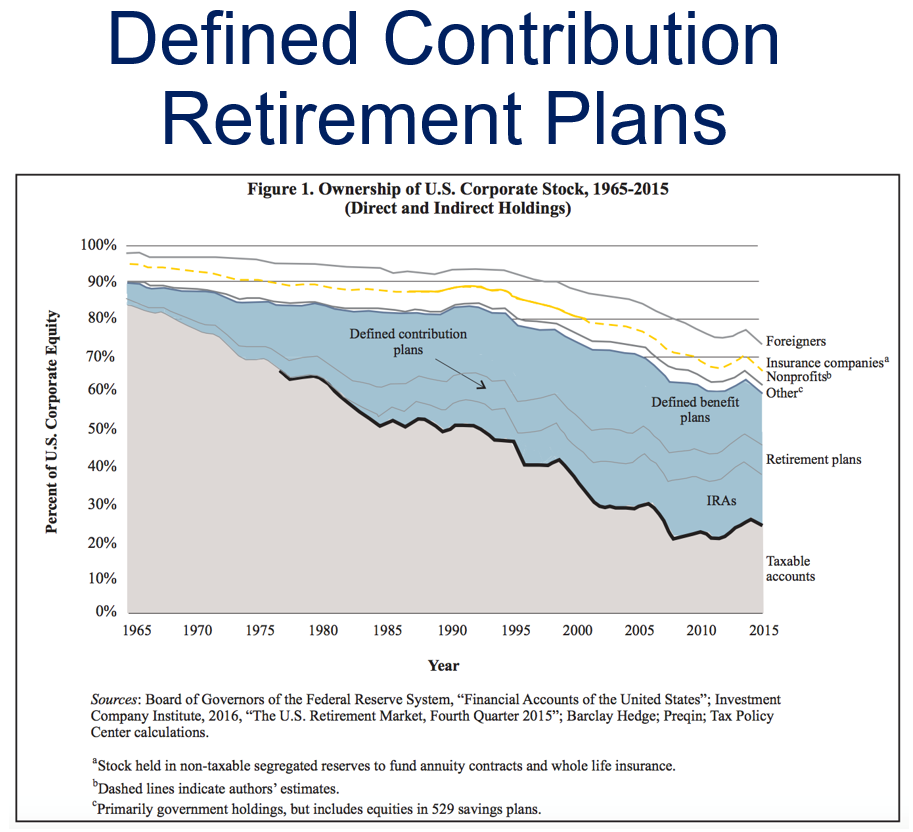
There is far more diversification in both the types of accounts people hold stocks in and the investor base.
Plus retirement is still a relatively new concept. In 1870, just 34% of people ever reached their 65th birthday. And if they did their retirement plan was basically working until they keeled over.
This was new ground for an entire generation of savers and investors.
Now that people were on their own when it came to saving for retirement, there was a greater need for financial advice.
Unfortunately, there was no Google back then. No one really knew if they were getting useful financial advice or not.
The 1980s were the “trust us, we got this” era of financial advice. You chose an advisor because of the name on the door as much as the quality of the advice.

Investment products were sold not bought.
Vanguard is synonymous with index funds but it was money market funds that carried Jack Bogle’s company in the 1980s because interest rates were so high.
Banks used to be capped on the amount of interest they could pay. Then the first money market fund came along that allowed people to put their money to work with a bank through prevailing interest rates.
By 1981, Vanguard held just 5.8% of mutual fund industry assets. That number dropped to 5.2% by 1985 and 4.1% by 1987. Their most popular fund series, the Wellington Funds, saw 83 consecutive months of outflows.
During the 1980s, mutual fund assets jumped from $241 billion to $1.5 trillion. The charge was led by money market funds, which soared from $2 billion to $570 billion, accounting for almost half the increase.
One of the biggest reasons for this massive increase in mutual fund flows was a huge proportion of the baby boomer generation hitting their higher earning and household formation years.
There were a lot of reasons the U.S. stock market was up 18% per year from 1980-1999.
The largest demographic of buyers entering the market during a time when it was becoming easier to buy stocks is certainly one of them.
There are 10,000 baby boomers retiring every single day in the U.S. from now until 2030. That’s a lot of people in need of financial advice in the coming years.
The bull market of the 1980s and 1990s combined with the largest demographic we’ve ever seen starting to make some money helped usher in a whole new class of investors in the stock market.
Financial asset bubbles always end in tears eventually but many market manias can lead to unintended benefits. The dot-com bubble supercharged participation in stocks.
We went from 1% stock market ownership in 1929 to 19% in 1983 to nearly 60% by 2000.
Almost 60% of households who owned stocks had purchased their first share after 1990. One-third of all buyers entered the market in 1995 or later.
It didn’t hurt that the S&P 500 was up 20% or more for 5 straight years from 1995-1999 while the Nasdaq Composite was up a blistering 41% per year in that same stretch.
Everyone was getting rich and the rise of the internet broke down even more barriers to entry as companies like E-Trade brought a whole new segment of investors into the market.
The 1990s also gave us the exchange traded fund which was yet another arrow in the quiver for both advisors and investors alike.
The 1990s were a fun decade for investors. The 2000s were not.
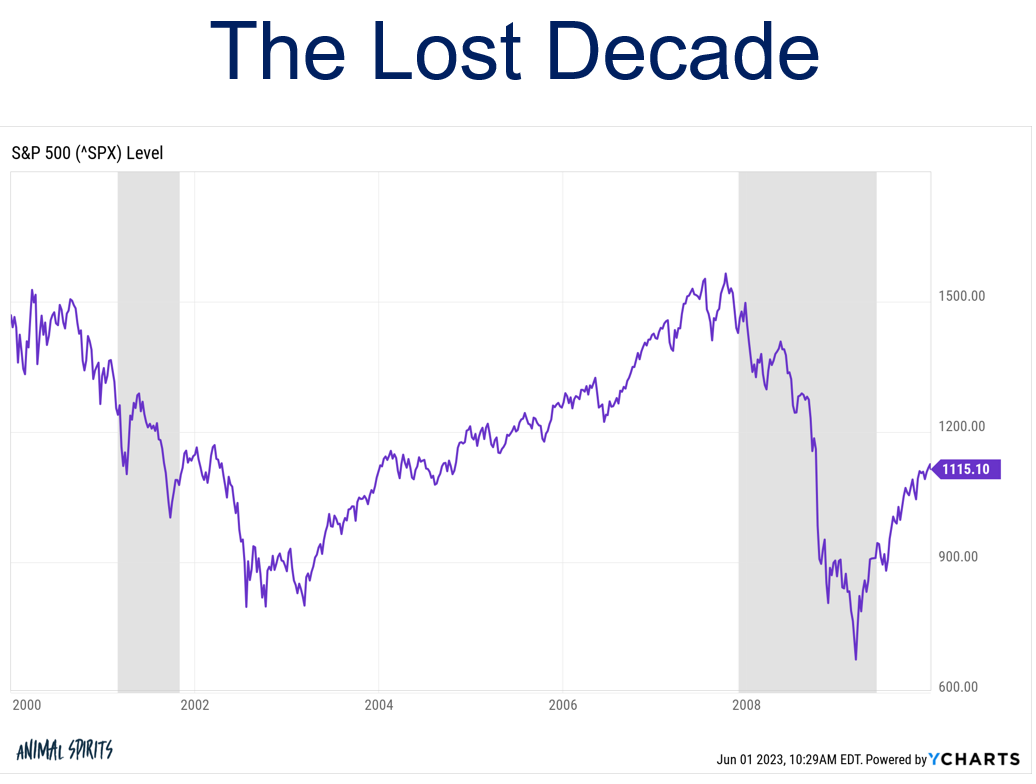
The S&P 500 lost around 10% in total during the first decade of the 21st century, a 10 year stretch that saw the market get chopped in half twice.
Things felt pretty bleak coming out of the Great Financial Crisis of 2008.
I was an institutional investor at the time and all anyone in the pension and endowment space could talk about were tail-risk hedging strategies, black swan funds and hedge funds.
Everyone was so concerned with finding the next Big Short that they almost missed the Big Long of the 2010s.
If the 1970s gave us index funds, the 1980s gave us money market funds, the 1990s gave us ETFs and the 2000s gave us heartburn, the 2010s gave us automation as roboadvisors like Betterment and Wealthfront burst on the scene.
It seems silly now but there were plenty of think pieces at the time declaring the robots were gonna put financial advisors out of business.
Automation in tasks like tax loss harvesting, rebalancing, reinvesting and contributions was certainly a step forward for individual investors but those tools have also been helpful to advisors.
If anything robo-advisors made it clear that a portfolio is not the same thing as a financial plan.
There is so much more that goes into a comprehensive plan beyond asset allocation. Advisors who focused on financial planning, tax planning, insurance, estate planning, etc. could easily distinguish themselves from the robos.
Adding automation to zero-dollar trades has opened up a whole new world of customization options for investors that would have been cost-prohibitive in the past.
Which brings us to the present.
We now have all of this technological innovation, lower fees, better investment products, fewer barriers to entry and more information than we know what to do with.
So what’s left?
Behavior is and always will be the final frontier.
It doesn’t matter how great your portfolios and financial plans are if you can’t or won’t stick with them. And now that information is becoming a commodity it’s going to be even more important to filter out the noise and focus on what’s important.
Financial advice is more important than ever in a world with an abundance of choices and fewer frictions to transact.
I have some more takeaways on how advisors can get ahead in the new world of financial advice but I’ll save that for another day.
*******
Feel free to reach out if you’re interested in having me speak to your organization here.

