As U.S. stocks and valuations have continued to move higher throughout this latest cycle there has been a growing chorus of intelligent industry observers — beyond the usual fear-mongering perma-bears — who are predicting lower stock market returns in the coming years or even decades for the stock market.
The combination of higher prices, higher valuations, lower interest rates and lower dividend yields make for a compelling case that future returns may not look like the 10% or so annual returns we’ve seen in the past.
No one knows how the future will turn out — for the markets or otherwise — but there does seem to be some validity to this argument.
But saying that future returns will be lower misses one key distinction — the only returns that matter are net, not gross, of all costs and costs were much higher in the past. It’s possible gross returns will be lower, but net returns to investors could be quite similar.
Charles Jones of the Columbia Business school wrote a very comprehensive research paper on the history of trading costs called A Century of Stock Market Liquidity and Trading Costs. Jones tracked down both historical commissions and bid/ask spreads all the way back to the year 1900 on U.S. stocks.
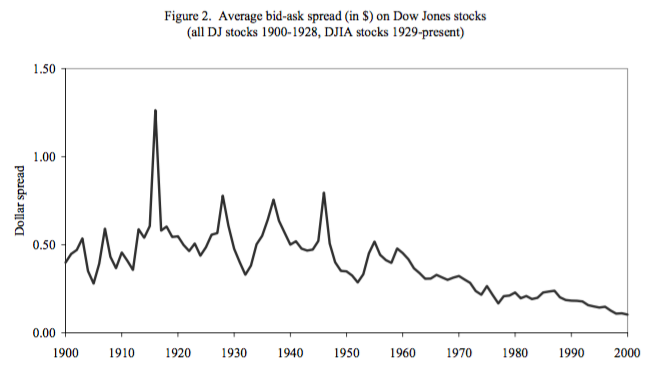
The bid/ask spread is simply the difference between the price a buyer is willing to pay for a security and the price a seller is willing to sell it for. The middleman who facilitates the trade gets to keep the difference for their services. When you add in trading commissions these frictions were much, much higher in the past as the middlemen would take a sizable chunk of every single trade. Investors never really look at bid/ask spreads, but they represent real costs.
Here’s Jones with a historical perspective on this:
At the end of 1962, the average NYSE share price was $40. Trading 100 shares of such a stock would result in a one-way commission of $39, or 0.975% of the money involved. This is a substantial fraction. It is also important to note that, prior to 1968, the NYSE commission schedule was always linear: a trade of 3,000 shares incurred a commission 30 times as large as a trade of 100 shares. Thus, one can think of commissions as a proportional tax on transactions, where the tax rate depends on the share price.
So there was no scale for trading costs. The more money you had, the more you had to pay for transactions. These costs have since come down substantially.
Here’s a look at the historical bid-ask spread over time:
Now here’s the historical look at the commission rates:
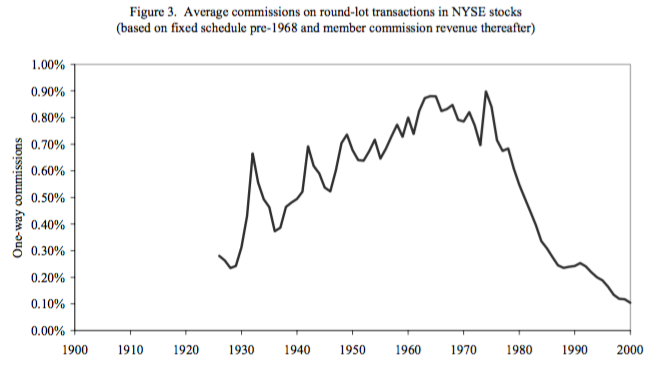 Both have fallen off a cliff in recent decades (and this data only goes through the year 2000). The huge change for all of these costs really came about in 1975 in what people now refer to as May Day. That’s when the regulators abolished fixed-rate commissions.
Before May Day, it cost the same amount per share to trade 10 shares as it did to trade 10,000 shares. The brokers would make out like bandits, taking their 2% or so from each trade. I’ve seen estimates that show trading costs have fallen around 80-90% since 1975.
Today, plenty of securities and funds trade for free. At the most you may pay $4-$8 for a single trade. It also would have been nearly impossible to cost-effectively put together a portfolio of small caps, foreign stocks, emerging markets, REITs or high yield bonds in the past. Investors these days don’t realize how good we have it.
When people look back at the historical stock market returns I think they often forget that there were no discount brokerages or Vanguard index funds to make things easier for investors. It’s quite possible that investors actually required a much higher gross rate of return in the past because it was far costlier to own stocks. This is one of the reasons that dividend yields were so high historically. Companies had to convince people that it was worth it to own equities over fixed income.
Not only did it cost more to put together a portfolio, but investors typically had more concentrated portfolios back in the day. They weren’t investing in broadly diversified funds or ETFs for the most part. They were buying a handful of stocks, most likely the 10 to 20 names that their brokers recommended to them. So historically, people probably held much riskier portfolios and paid a much higher cost to put them together. Therefore, a chunk of those historical gross returns are probably an illusion — very few were actually earning those numbers.
It’s quite possible that returns from here will be lower than they have been when compared with the historical numbers. But it’s also true that investors in the past probably required a much higher gross return because there is no way they were actually receiving those historical returns on a net basis, after taking into account all costs.
Could it also be possible that higher price and valuation levels are justified in a more mature market structure like we have today? And what exactly are those new levels? I don’t know.
From 1900-1975, the average CAPE ratio on the S&P 500 was 14.7. Since 1975, the average CAPE has been 20.1. Are falling costs and increased efficiency the only explanation for this change? Of course not. That’s far too simple.
I’m sure some people will read this and ask – Wait, are you saying this time is different? No, I’m saying every time is different and markets require context. I’m also not saying higher prices or valuations are here to stay forever. More mature markets don’t mean more mature humans. Markets will continue to fluctuate but they may do so around different averages than they once did in the past, from both a gross return and valuation perspective.
Our markets are now more convenient, cost effective and mature than ever. That has to have some bearing on prices and performance.
For investors this may mean that their gross returns won’t look like they do in a textbook. But wise investors know the only returns that truly matter are the ones they receive after all costs and frictions have been taken into account.
Source:
A Century of Stock Market Liquidity and Trading Costs
Further Reading:
What If Risk-Free Returns Slowly Go Away

I think I read somewhere that there is no such thing as the “equity risk premium” because we are cherrypicking the united states equities market. If we took the entire world’s equities markets there there is no more equity premium.
Furthermore I would argue that stock data before 1970 is of little worth to the investor of today, because there were no diversified low cost etfs. Buying stocks with one’s life savings back then was akin to gambling.
Not true on the global risk premium. See here http://publications.credit-suisse.com/tasks/render/file/index.cfm?fileid=AE3E00B9-91E2-D1FA-6C18765D3A968D73
I think that’s a really great perspective and probably part of the reason why valuations are so much higher and have been for some time. Obviously not the only reason or maybe even the primary reason, but a definite piece of the puzzle. Nice work.
Thanks for writing this re: costs. I’ve been saying the same for years, that prior to the invent of the index fund in the ’70s, there was no possible way to replicate the holdings of an index due to high costs: e.g. using the prices in the quote, $40/shr + $39/trade, all-in capital in 1962 would have been $2,019,500 to mimic the S&P. Sorry Mom & Pop. Pre-index fund investors could not get pre-index fund returns, thus that data is moot. Mid-late 1970-current presents a more realistic era of achievable market returns.
Yup, and will have another follow-up in the coming days with some thoughts on what the historical data really can tell you.