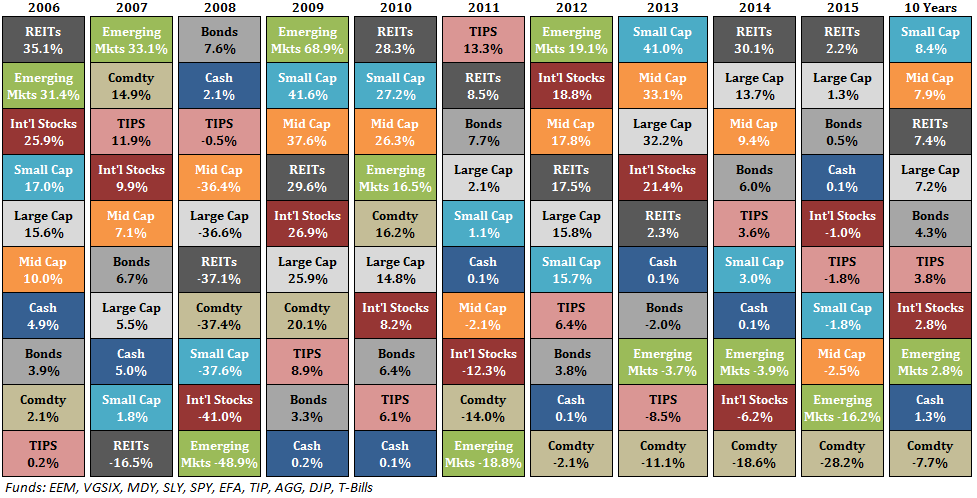
The last couple of years I have updated an asset allocation quilt that I keep track of through the end of each calendar year. For some reason I never got around to updating through the end of 2015 and was asked by a handful of readers to do so. Here’s the past 10 years’ worth of returns for select asset classes:
A few thoughts on my favorite performance chart:
- It’s amazing what a couple of year’s worth of performance can mean to long-term returns. Add a year here or take away a year there and the numbers can look completely different. Here was the ranking of these asset classes as of the end of 2013 (along with annual return numbers): emerging markets (+15%), mid caps (+13%), small caps (+13%), REITs (+11%), international stocks (+10%), large cap (+9%), TIPS (+5%), bonds (+5%), commodities (+3%) and cash (+2%). Things look quite different at year end 2015. This is why I always say the best way to win an argument about the markets is to change your start or end date.
- I’ve always been of the opinion that mid caps are some of the most under-owned stocks in terms of mutual funds and ETFs by investors, which could explain why they seem to have performed so well over the past 10-15 years. Large caps are covered heavily by Wall Street and everyone pays attention to small caps because they are something of a gauge of risk, but few people ever talk about mid caps. A quick look at the Reuters mutual fund screener shows 2,095 large cap funds, 1,734 small cap funds, but just 974 mid cap funds in the U.S. equity mutual fund universe.
- Commodities could set some sort of record in futility if they’re down for the 6th year in a row in 2016. These are very volatile assets so I wouldn’t be surprised by a face-ripper of a rally at some point, but it would be very difficult to figure out the why and the when on that one. Regardless, we seem to be in uncharted territory with the commodities downturn.
- Remember when cash equivalents used to pay interest? Can you imagine earning 5% on a money market or short-term treasury note these days like you could have in 2007? (See also What if Risk-Free Returns Slowly Go Away?)
- I was asked recently why it makes sense to invest in REITs when they basically give you equity-like returns with equity-like volatility. From eye-balling these returns alone you can see that REITs tend to march to their own drummer and aren’t always highly correlated with U.S. stocks. This diversification benefit can be huge if investors are willing and able to take advantage over time. The correlation to the S&P 500 over the past 10 years was 0.70 while the correlation to bonds was -0.15.
- Higher volatility does not always lead to higher returns. Two of the three worst performing asset classes (emerging markets and commodities) had some of the highest volatility of all (33% and 19%, respectively). Uncorrelated returns sound great in a backtest, but aren’t very fun in real-time. Investors who benefit from uncorrelated returns are those who are able to rebalance into that underperforming volatility. It’s not an easy stance to take, but it tends to be a profitable one.
- Risk assets can be disappointing at times. Foreign stock markets have underperformed bonds over the past decade. The combination of the 2007-09 financial crisis, the 2011 European debt crisis and a rising dollar have made for a terrible time for investors with a global portfolio in the past decade. Some would have you believe that this is proof that you don’t need to invest internationally to be successful. I would tend to think this will lead to some opportunities for future leadership abroad. We shall see…

As a holder of Vanguard’s REIT fund ($VNQ), I’ve come to realize the tax burden with them is quite strenuous, sometimes 40%. I’m still a big fan, but am reconsidering whether they should hold an equal place next to staple US and Intl equity (like your chart) in my taxable account. I know there’s that maxim that portfolio allocations should not be based on tax implications, but the difference between my REIT fund and a lower-tax fund like Vanguard’s Large Cap ETF ($VV) is so stark that it’s making me think twice about holding them on equal footing.
Great point. Asset location is definitely a huge component of portfolio management from a tax efficiency perspective. REITs and bonds make more sense in a tax-deferred account, but that’s not always possible for everyone.
Can you please throw some more light on why VNQ has so much tax burden compared to other ETFs?
Because of the way they’re structured, REITs have to pay out a substantial amount (~90%) of their earnings in the form of dividends. So you have to pay income taxes on those higher payouts.
Thanks Ben. Would it make sense to hold them in a tax-deferred IRA? Or what do you think is the best way to have REIT in one’s portfolio. Can you please provide any blog you previously wrote covering this or any other link?
Appreciate the help.
In my opinion, that’s exactly the right idea. Tax-incentivized accounts like IRAs and 401(k)s seem the perfect fit for a REIT fund like $VNQ, even a better fit than most bonds. The debate I’m having with myself is whether or not to also include a REIT portion in my taxable side if my retirement account is already full, so as to keep in line with my original allocation weights.
Check this – http://www.efficientfrontier.com/ef/701/annuity.htm
Can you please throw some more light on why VNQ has so much tax burden compared to other ETFs?
I see a core holding of Emerging Markets as plenty of exposure to commodities. Really, commodities plus, because commodities are relatively heavily represented in EM economies, plus the value add of bringing them to market more efficiently over time. I’ll admit I doubt future performance will match long term historical returns in EM, but I think it’s a great time to be invested.
It’s also great to hear like thinking from a respected voice in the investment community regarding appreciation for REITs (I believe they do double duty as a high return diversifier), and Mid-Cap stocks (which I value primarily for their returns.) The other asset class not mentioned in this chart is Gold, which I generally disdain as an investment. I was surprised to find that a small holding (~5%) appears to drive strong portfolio benefits when paired with Treasuries as an anchor to an equity-based portfolio, though this does not seem true of commodities or precious metals. I still harbor doubts about gold over the long term, and most people don’t have access in their 401(k), but it seems to have relevance unique from other commodities.
I tend to agree with you on the EM-commodities similarities. It’s about making sure you’re being compensated for the volatility you’re taking.
At what frequency would you re-balance? I recognize hindsight might sway the length of time, but generally speaking, should re-balancing be done every 9 mos? 12 mos? 18 mos?
Here’s some good research on the topic:
https://thereformedbroker.com/2014/06/08/horseshoes-and-hand-grenades/
At what frequency would you re-balance? I recognize hindsight might sway the length of time, but generally speaking, should re-balancing be done every 9 mos? 12 mos? 18 mos?
Hi what did your portfolio allocation look like over 10 years in relation to all the smart money portfolio and what is it for 2016. It would be nice to see a smart guy like yourself show us investors what you think. thanks Varun
Hi what did your portfolio allocation look like over 10 years in relation to all the smart money portfolio and what is it for 2016. It would be nice to see a smart guy like yourself show us investors what you think. thanks Varun
I played around with the numbers and found a couple of interesting things.(I used results for the period 2007-2015 so I could start with the best/worst performing asset class from the prior year. I stuck with that time period, 9 years, so the numbers below were comparing apples to apples)
+Rebalancing annually into the best performing asset class in the prior year, I come up with an annualized return from 2007-2015 of -3.93%
+Rebalancing annually into the best performing asset class in the prior year, I come up with an annualized return from 2007-2015 of -3.14%. Not great but on a $100k initial investment you end up with about $75,044 in your account vs. about $69,697 with option 1.
+If you equal weighted all 10 asset classes and rebalanced annually you received an average annual return of 4.06% and ended with about $143,077 in your account. Maybe that diversification isn’t so bad after all.
+If you started with an allocation of 50% to large cap, 15% to international stocks, and 35% to bonds and rebalanced annually you had an average annual return of 5.3% and an account balance of about $159,201.
Takeaways? 1) Looking in the rearview mirror doesn’t appear to work nearly as well as a disciplined asset allocation with rebalancing. 2) Short of having a crystal ball and an enormous amount of patience and risk tolerance, good luck guessing the winning asset class
I don’t understand what is the difference between your option #1 at -3.93% and option #2 at -3.14%. Could you enlighten me?
I don’t understand what is the difference between your option #1 at -3.93% and option #2 at -3.14%. Could you enlighten me?
Peter,
My bad. #2 should have read the prior year’s worst performing asset class. Thanks for catching my error, I corrected the original post.
Nice work here. Thanks for sharing. Not what I would have expected either. Good stuff.
It looks like you’re using the funds/ETFs rather than the indices? Just clarifying as I normally see the indices used on these charts.
Yes, used the funds just because it’s easier to get that data.
One thing that is on my mind is that if I want to own a diversified basket of managers managing properties that is done passively, could i have a 100% REITs?
Since the long term return of REITs is like 7%, yet provide a good cash flow yield (which is part of the 7% i know) for withdrawal, this looks like a good alternative to self manage property ownership.
This is a discussion without involving taxes.
Some real estate thoughts here:
https://awealthofcommonsense.com/2014/04/pointcounterpoint-real-estate-investment-option/
https://awealthofcommonsense.com/2013/03/real-estate-investment-performance/
https://awealthofcommonsense.com/2013/03/is-real-estate-a-good-investment/
Love the chart/quilt Ben. Keep up the great work.
Mark
Thanks Mark. I hope all is well.