The first asset allocation quilt I created for this site covered the ten-year period from 2005-2014.
Those returns look nothing like the last 10 years which is the whole point of this exercise.
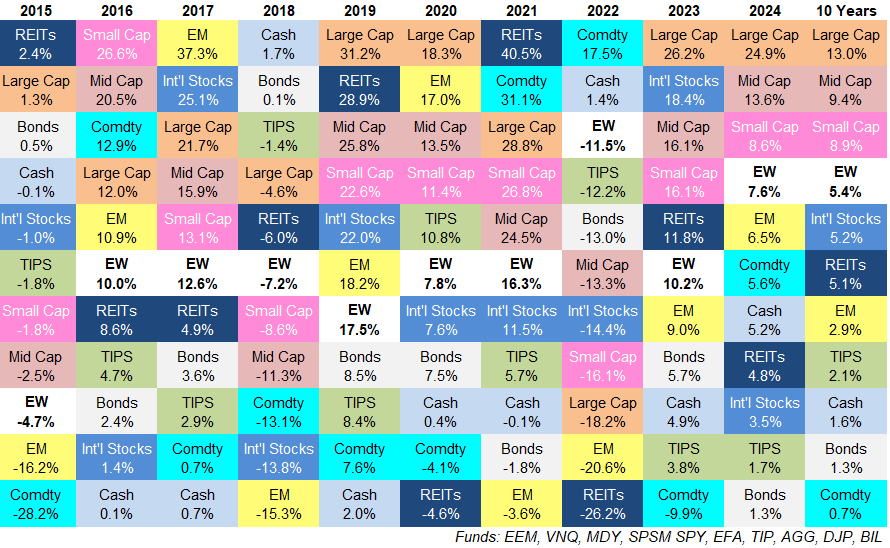
Here’s the latest quilt:

EW is an equal-weight portfolio of each asset class listed.
Some observations:
Inflation outperformed TIPS. The average inflation rate over the past 10 years was around 2.9% annually. Treasury-inflation protected securities were up 2.1% annually over the same time frame.
Wait…what?!
Yes you read that right. Inflation-protected bonds underperformed inflation.
There are two big reasons for this.
One, the nominal rates on these bonds were extremely low. For the better part of three years or so investors in TIPS were paying the U.S. government for the ability to invest in these bonds (meaning the nominal yields were negative).
Secondly, yields rose from nothing to something in an unprecedented manner so TIPS acted more like bonds than inflation-protection.
The good news is TIPS are now yielding more than 2% nominally, meaning you get 2% plus whatever inflation is going forward. The bad news is you had to endure a tough period of low yields and returns to get here.
Cash outperformed bonds. This one makes more sense given the environment.
Cash (T-bills) is one of the simplest hedges against rising inflation and interest rates. Plus, cash yields have been higher than bond yields for some time now.
The 3-month T-bill was above the 10-year Treasury rate from the fall of 2022 through the end of last year when they finally flipped. And short duration fixed income is far less susceptible to a rising rate environment.
With higher starting yields for bonds and the Fed lowering short-term rates it’s hard to see this persist.
We shall see.
Commodities had a lost decade. It’s hard to believe commodities had such a poor showing considering we just lived through the highest inflation spike in 40+ years.
There was a nice countertrend rally in 2021 and 2022 but that was not enough to make up for the poor showing in the other years.
We essentially had a lost decade in this basket of commodities.1
U.S. large caps continue to rule the day. The S&P 500 has been the top performer of the group in 4 of the past 6 years. The only year when large caps weren’t in the top half of these asset classes was 2022.
So it makes sense U.S. large cap stocks have far and away the best 10 year annual results.
It’s hard to envision a scenario where this doesn’t continue. The tech behemoths are the best corporations on the planet. They seem to get stronger by the year. And they’re not one-trick ponies either. They all have multiple business lines and are investing heavily in the future. The biggest companies have gone all-in on AI.
If we get the AI nirvana the tech crowd envisions it’s difficult to see that performance slowing down anytime soon.
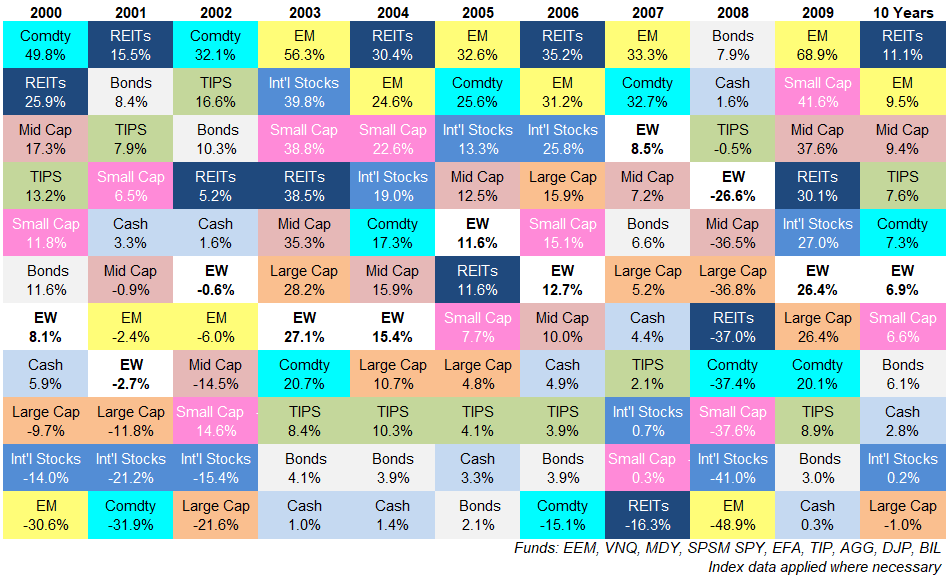
However, I would be remiss if I failed to point out that there is likely a heavy dose of recency bias in this line of thinking. Take a look at the asset allocation quilt from 2000-2009:

The first decade of the 21st century looked much different than the past 10 years.
REITs were the top performers even after accounting for the real estate bust. Emerging markets had a good decade despite getting cut in half in 2008. Commodities were a good hedge. So were bonds, TIPS and mid caps.2
Large cap stocks finished dead last with a negative return on the decade.
There are different ways to view this data.
Maybe that lost decade was the outlier. Maybe things really are different this time. We could be entering a paradigm shift in the markets.
It’s also possible that one of the reasons large cap growth stocks are doing so well over the past 10+ years is because they experienced a lost decade.3
Anytime you live through a cycle like this it feels like it will last forever. Investors in Nifty Fifty stocks in the 1960s and 1970s, Japanese stocks in the 1980s, dot-com stocks in the 1990s and energy stocks in the 2000s all felt like the good times would last forever.
Maybe U.S. large cap stocks will continue their dominance in the next 10 years. You can’t rule it out.
Market history shows the leaders and laggards are always changing from one cycle to the next. Right now that doesn’t seem remotely possible.
My best guess is the next 10 years won’t look very much like the last 10 years.
I’ll see you back here in 2035 to compare.
Further Reading:
Updating My Favorite Performance Chart For 2023
1To be fair there are many different ways to put together a basket of commodities.
2It’s also interesting mid caps did 9.4% annually in each of these 10 year windows.
3And one of the reasons they had that lost decade is because the 1980s and 1990s were so spectacular. These aren’t the only reasons obviously. But you can’t ignore these cycles of over- and underperformance either.
