A podcast listener asks:
About mid-to-late 2019 I said f*ck it and put most of my portfolio into Facebook, Apple and Microsoft and have done really well. Why shouldn’t I put every penny into these stocks (along with Amazon, Netflix and Google) and just wait for other businesses to get closer to them? I can’t help but be curious about names like SHOP (Shopify) and SPOT (Spotify) and eventually the Airbnb IPO. But there’s still a huge part of me that says the FANMAG is it. Change my mind.
I get the sentiment here. It’s hard to ignore how wonderful both the businesses and stocks of companies like Facebook, Amazon, Netflix, Microsoft, Apple and Google have performed. Look at how well these stocks have done over the past 10 years in comparison to the S&P 500:
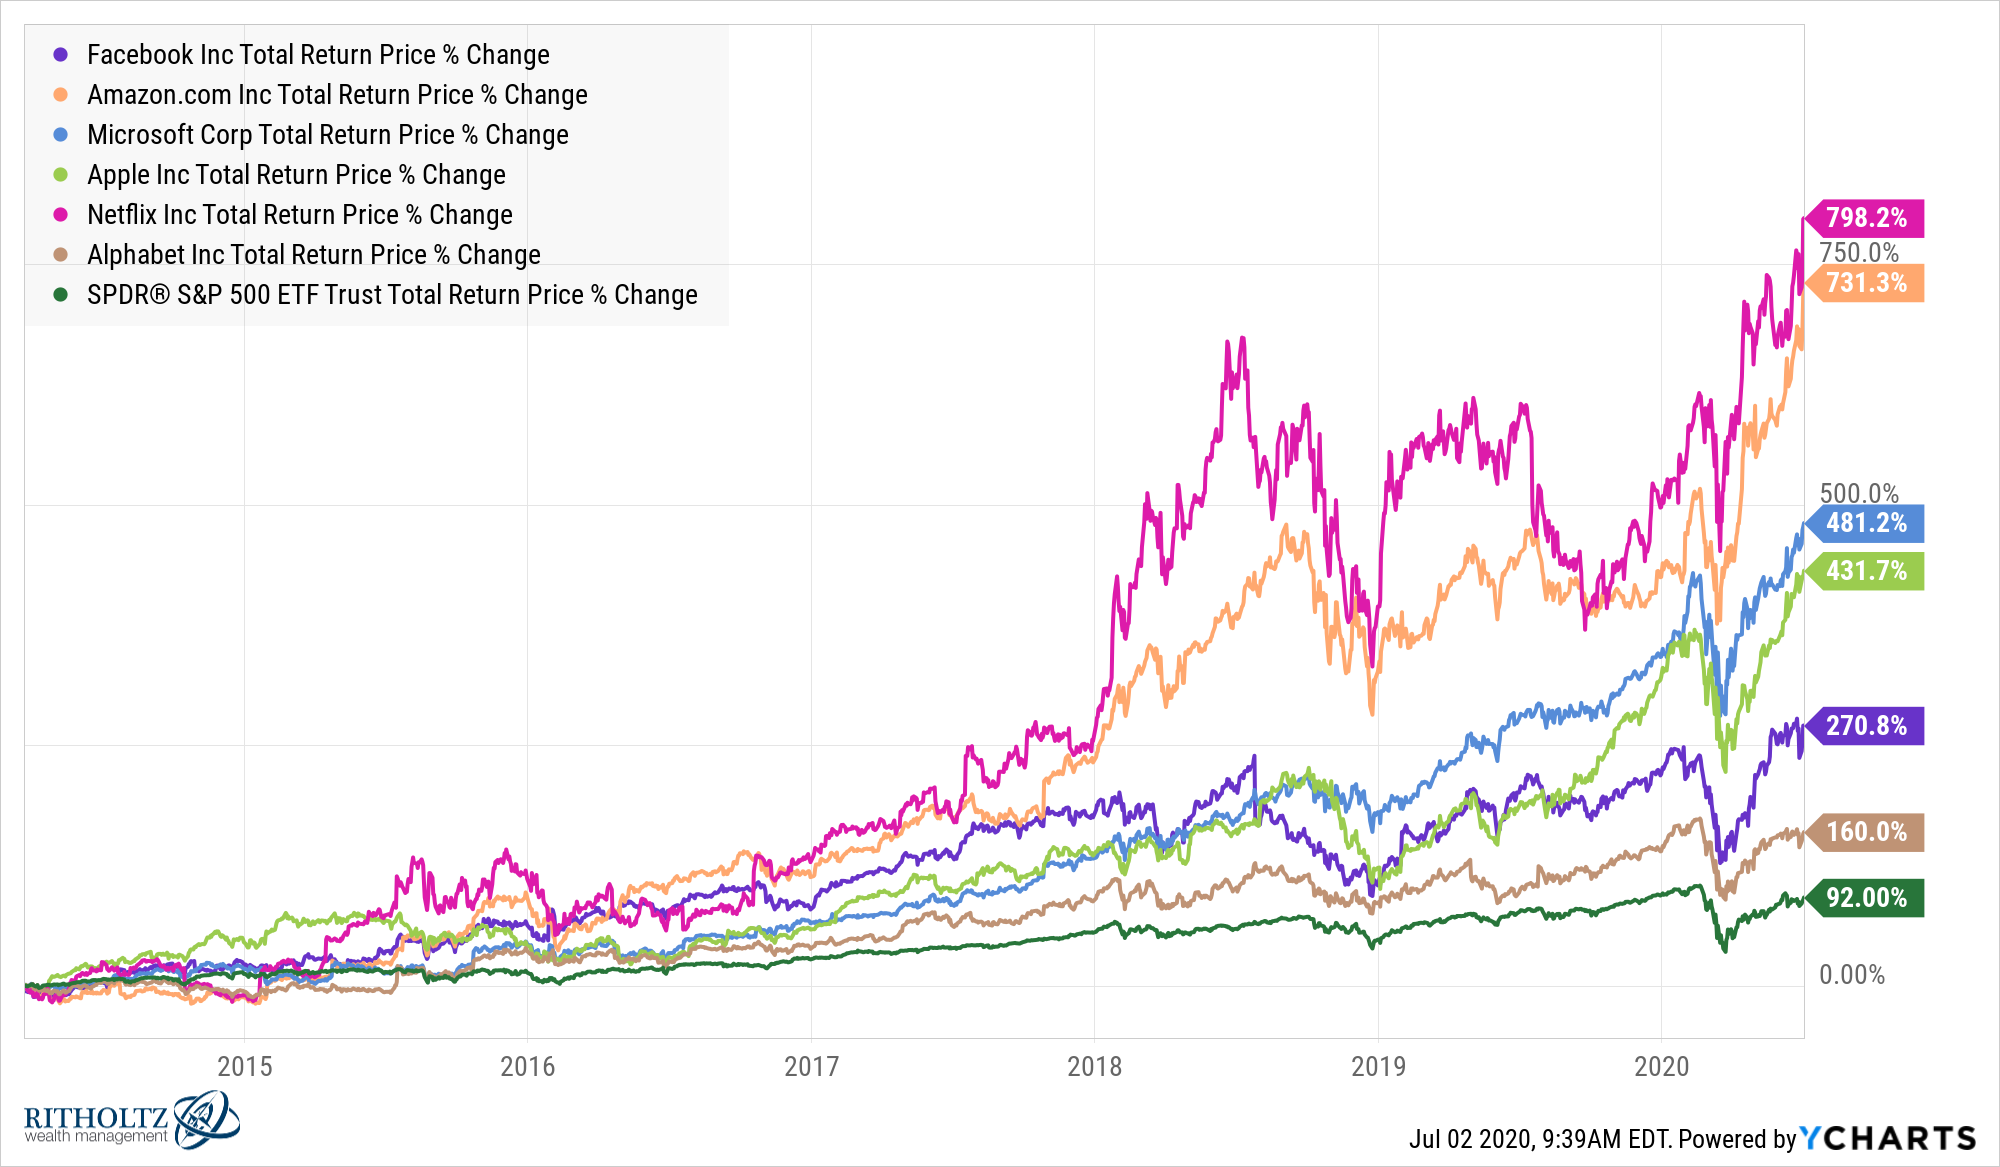
These numbers are amazing.
And with the kind of growth you get from these companies, investors are willing to pay a premium:
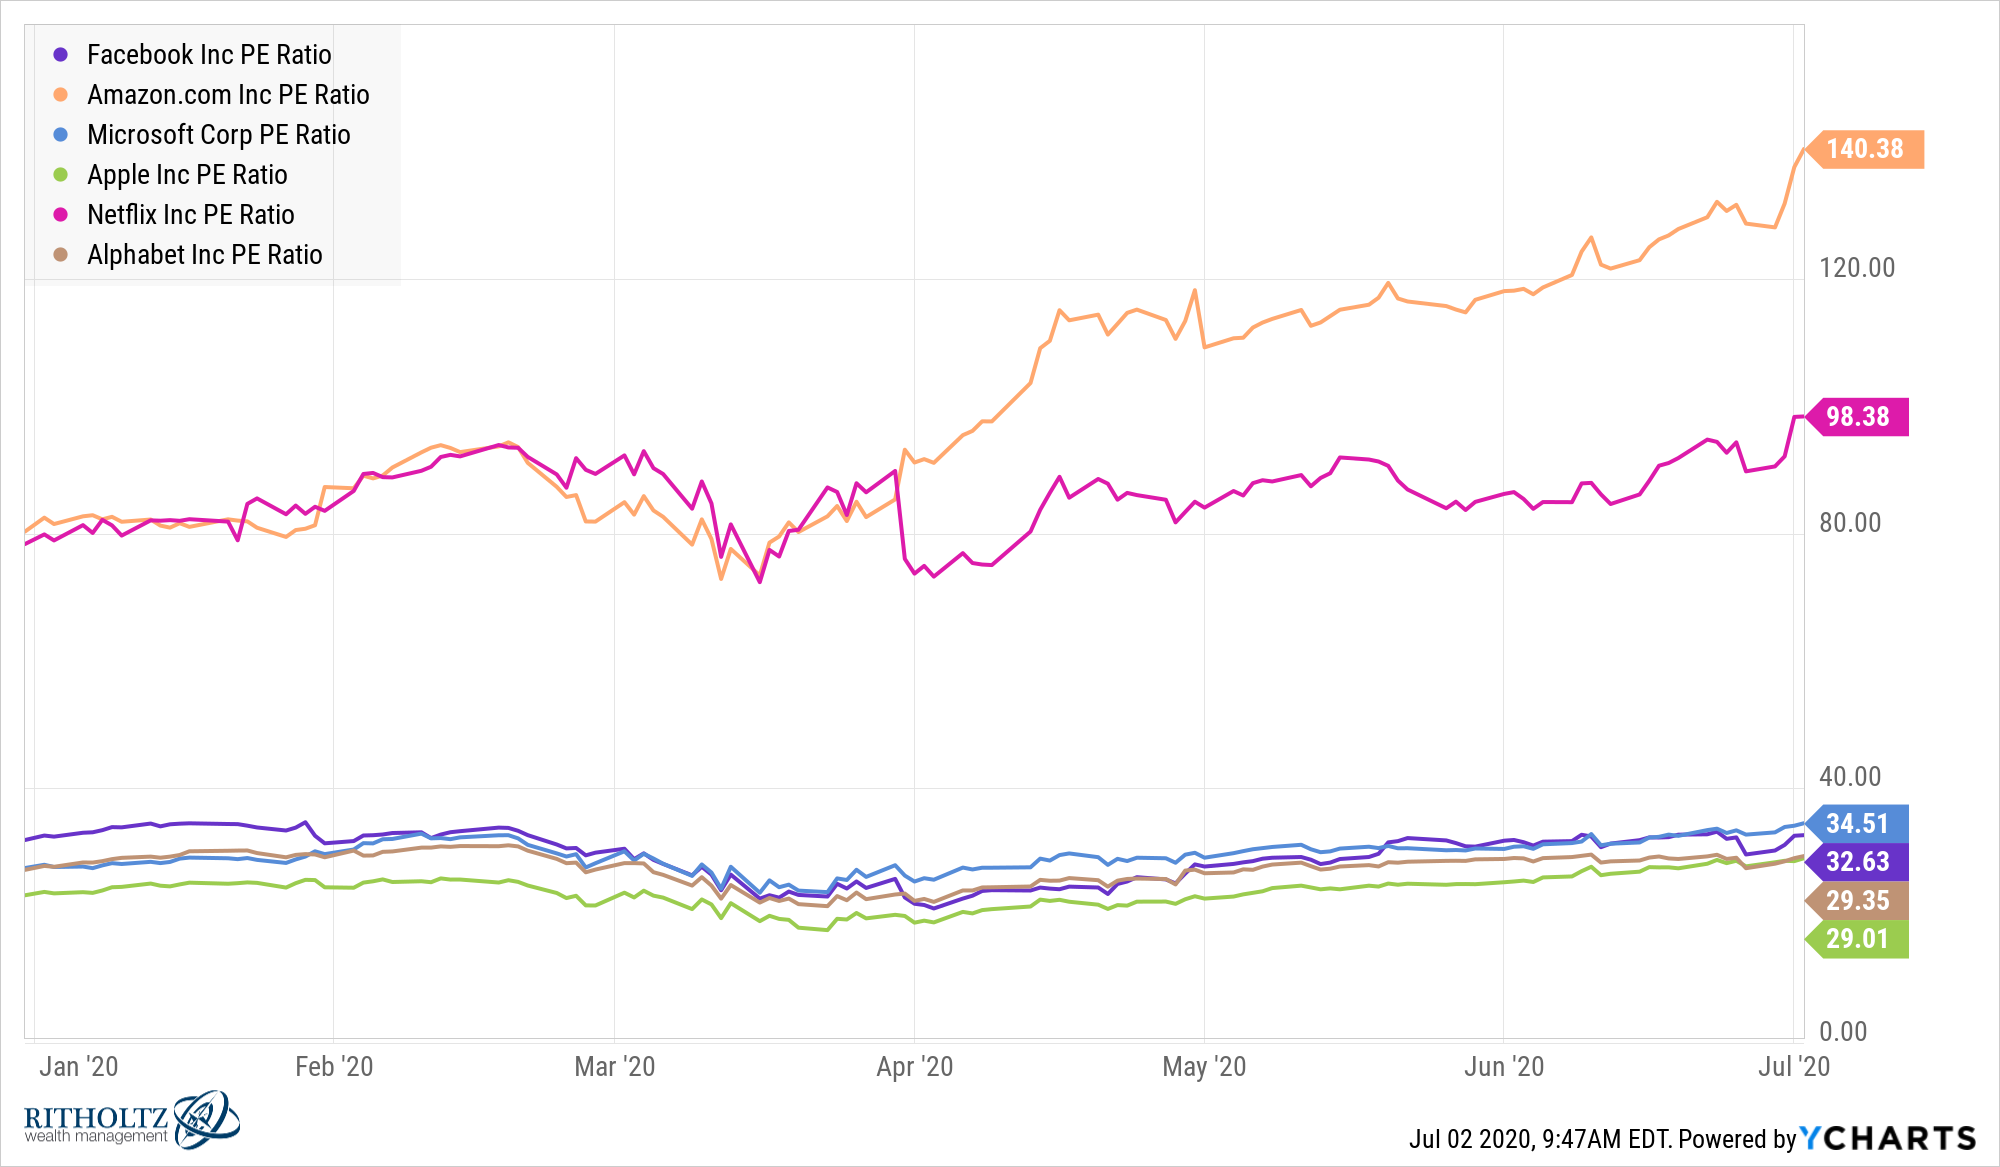
This is a situation where we have:
- Businesses everyone knows, and at a basic level, understands.
- Companies that are growing like crazy.
- Stock prices that have outperformed the broader market for an extended period of time.
- Companies that have essentially turned into one decision stocks (and that decision is to buy and hold them because they simply keep growing).
This is not the first time investors have become enamored with name-brand growth stocks.
There was a nasty bear market from 1968-1970 which saw the S&P 500 fall 36% but smaller and value stocks get hit even harder. So investors came out of that downturn more enamored with bigger, growth-oriented companies.
These blue chip stocks with high growth characteristics became known as the Nifty Fifty and included the likes of Polaroid, Xerox, McDonald’s, Coca-Cola, IBM and JC Penney. The average price-to-earnings of the Nifty Fifty was 42x, more than double the 19x P/E ratio for the S&P 500 at large. More than 20% of these companies had P/E ratios in excess of 50x earnings by the end of 1972.
What happened next to these “one decision” stocks is a tale as old at time. They got too far ahead of themselves and crashed even harder than the market at large during the bear market of 1973-1974. Here are the drawdowns for a handful of these names:
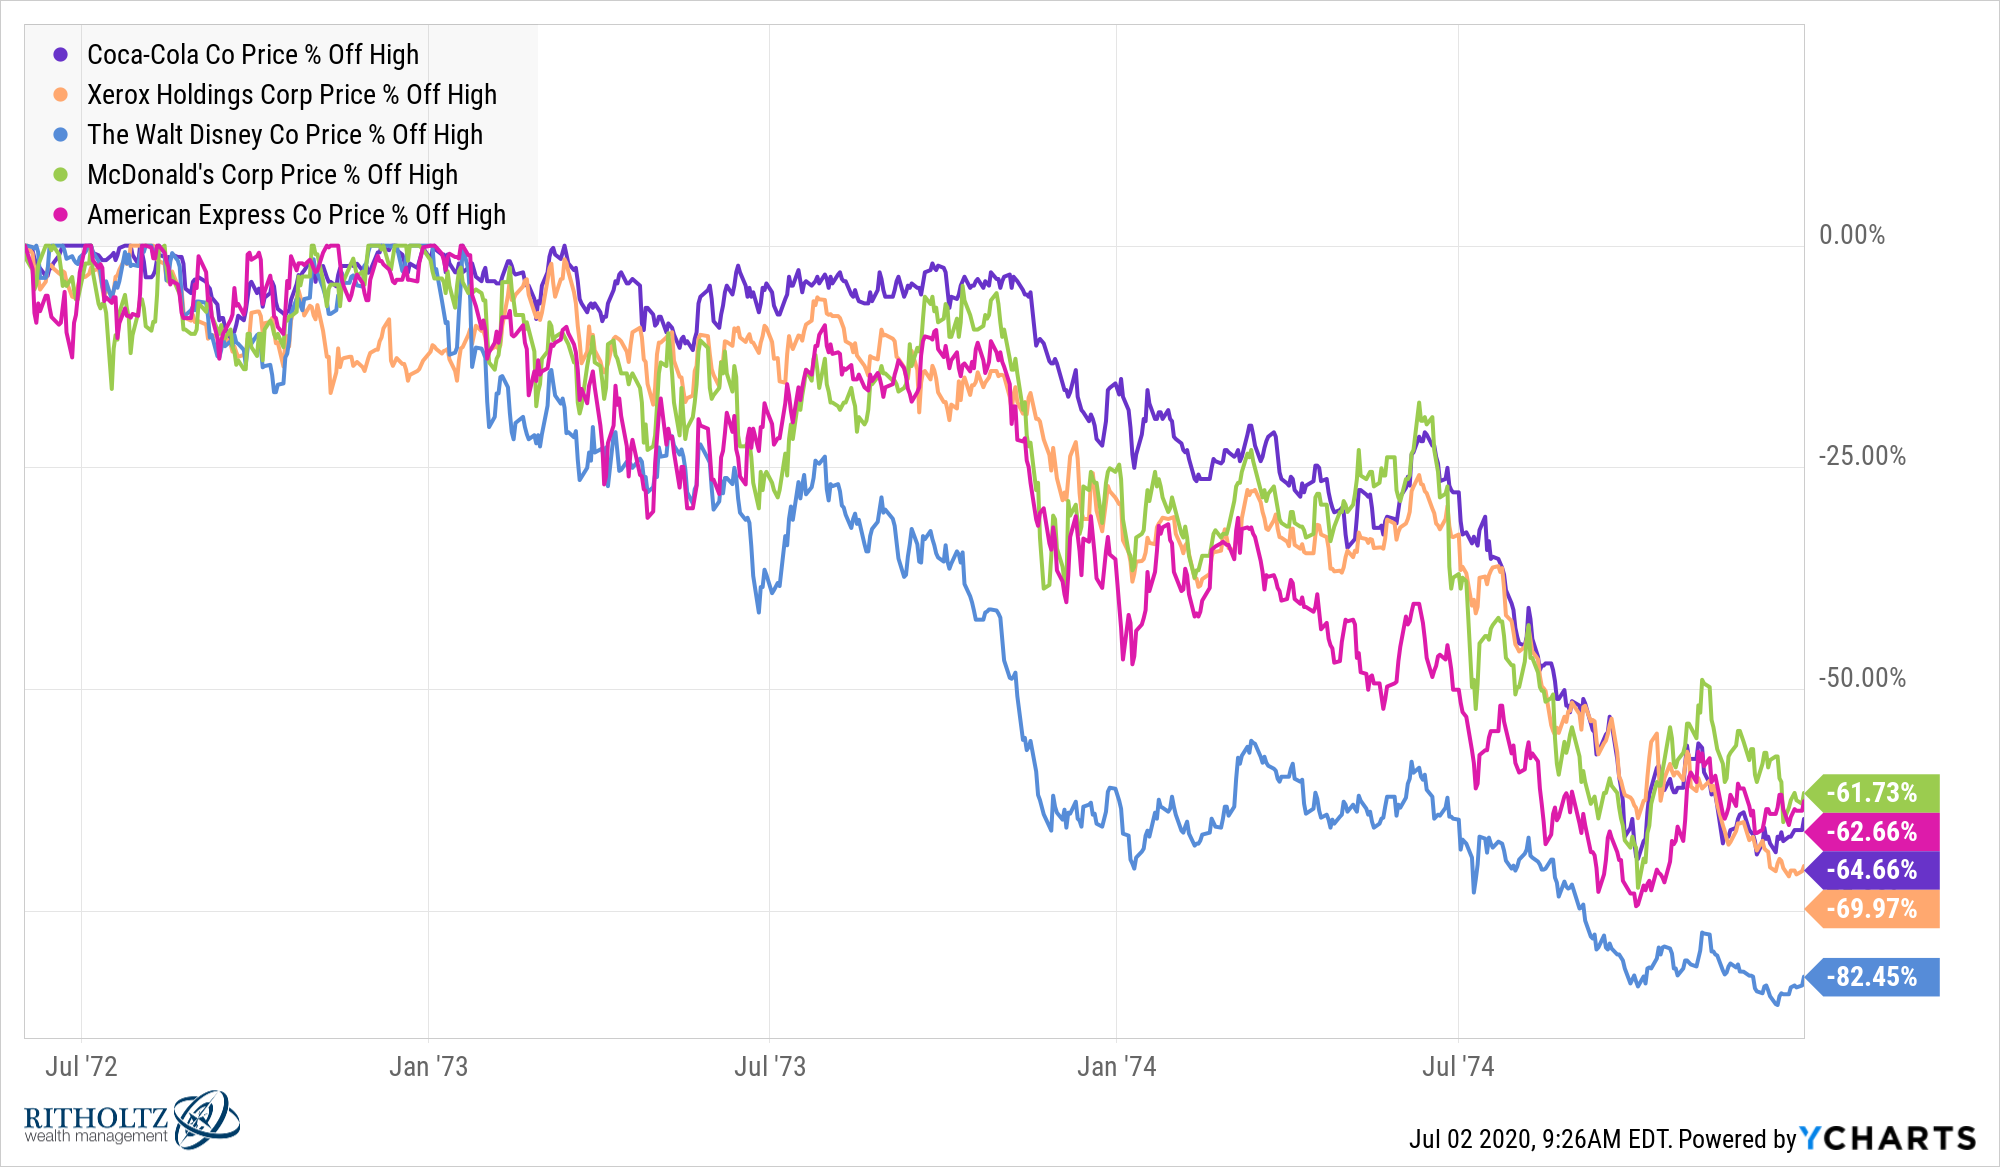
Polaroid dropped more than 90%. Avon was down more than 85%.
But the tale as old as time here didn’t end following the bear market. The people who always say “This is going to end badly” fail to realize markets keep chugging along. And unless they go out of business or get acquired, so do companies and their stocks.
Although the Nifty Fifty stocks got crushed after being bid up so much by investors in the early-1970s, their long-term results were still pretty good. Jeremy Siegel published Revisiting The Nifty Fifty in 1998. He published the annual returns from 1972 through the summer of 1998 for these stocks along with their 1972 P/E ratios and subsequent earnings growth rates:
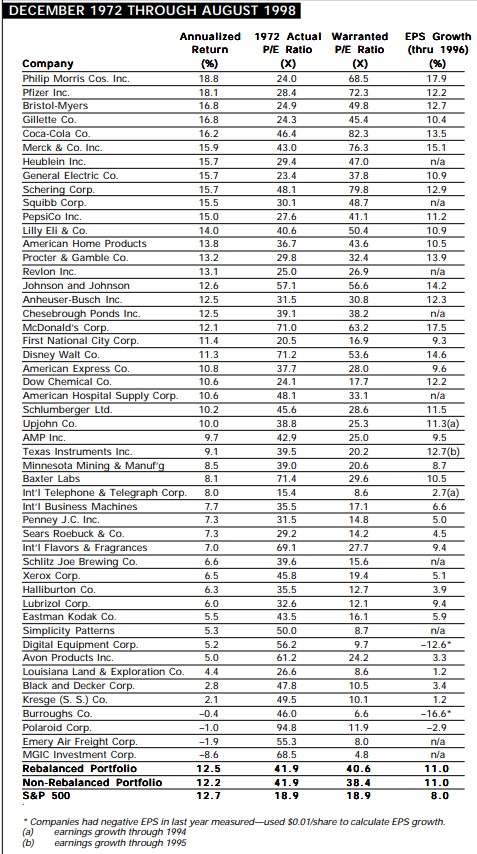
Many of the stocks at the top of the list showed extraordinary performance. Some of these stocks were terrible investments. But you can see over this multi-decade period, this group actually more or less kept up with the overall stock market. Despite crashing from lofty levels, over the long-term the Nifty Fifty did just fine.
You could make the case many of the tech stocks that are now one decision names could have a similar experience in the years ahead. A large drawdown in these stocks at some point is almost inevitable. High returns don’t come without high risks. Just look at the historical drawdowns in the FANMAG stocks over time:
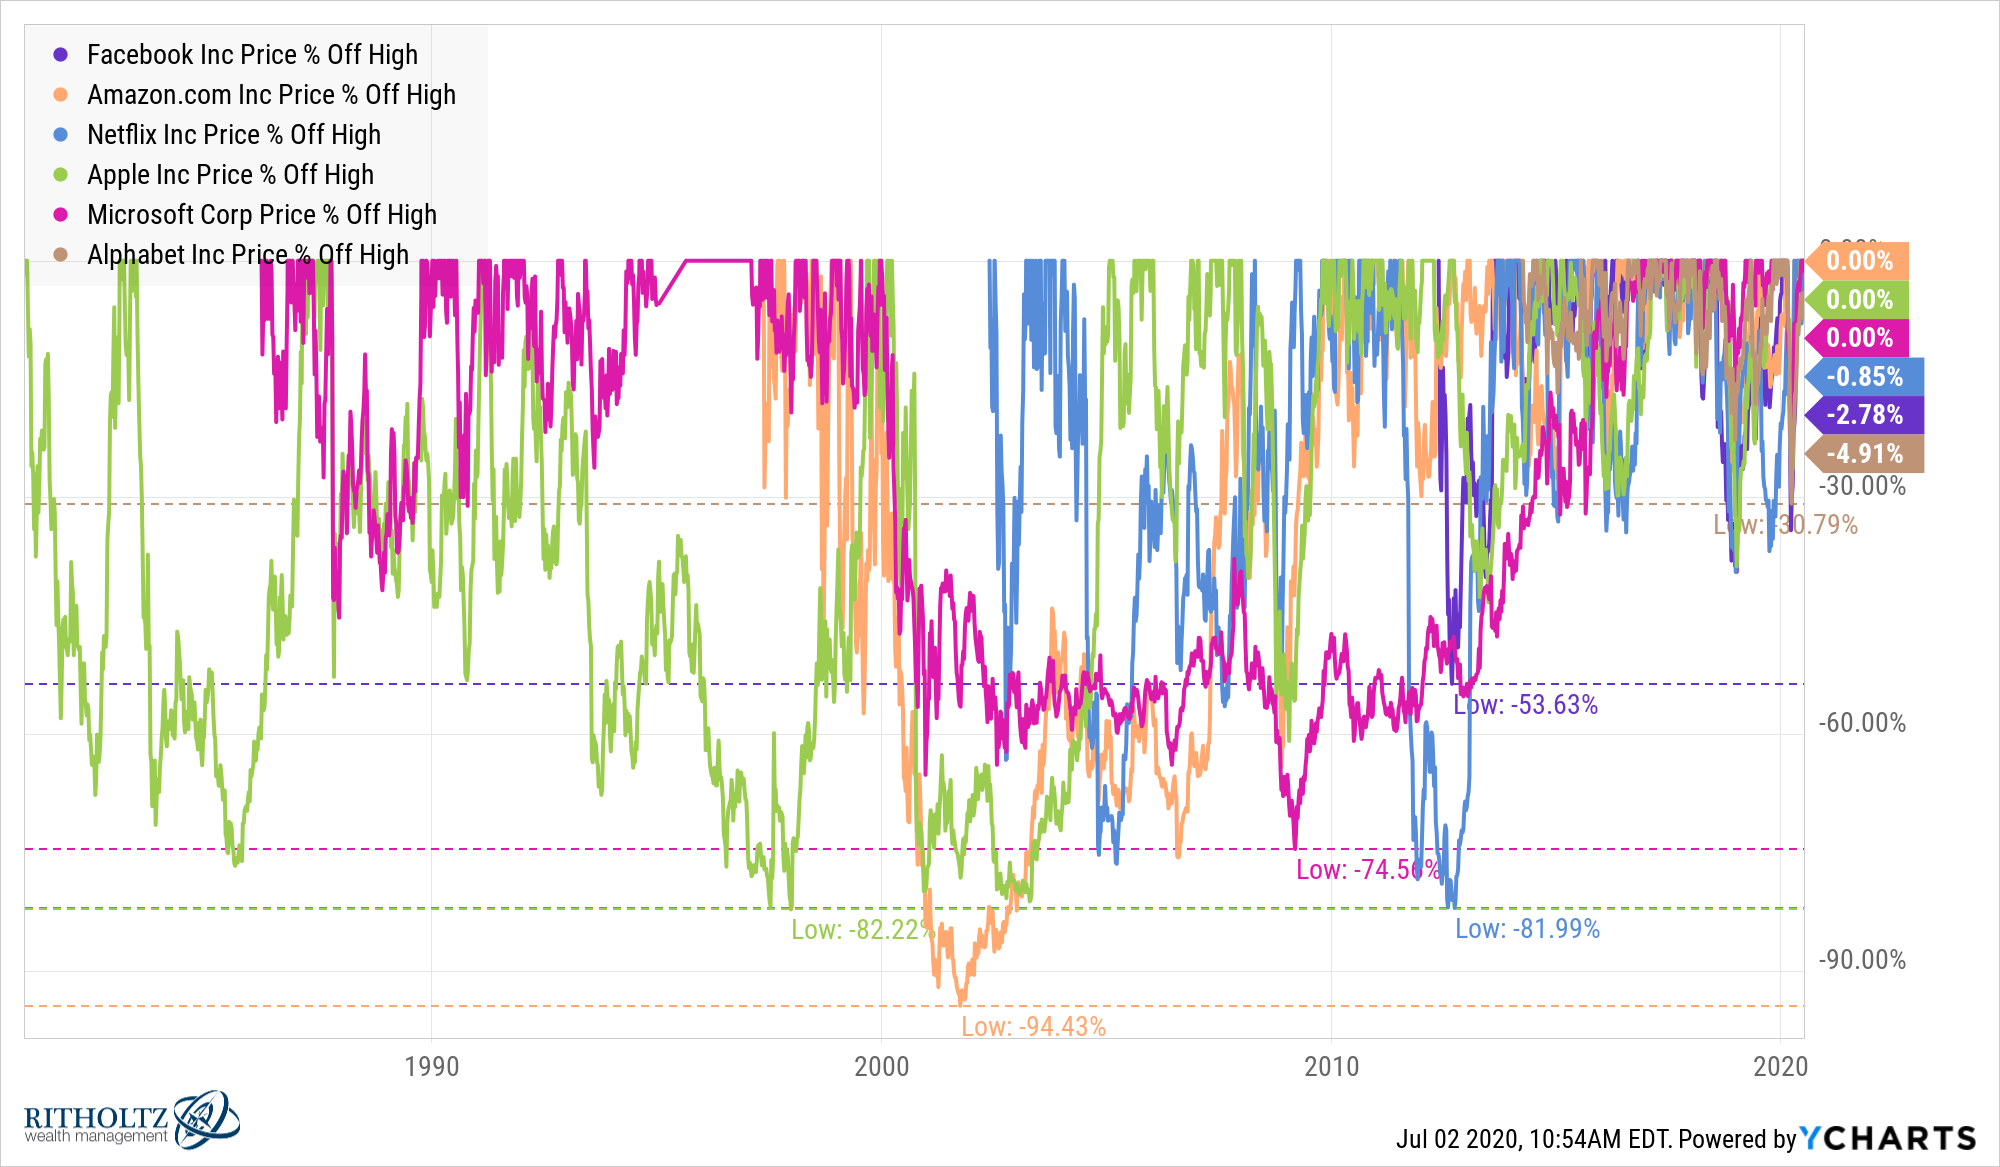
Amazon fell almost 95% following the dot-com bubble. Apple has seen multiple 60%+ crashes. Microsoft was underwater for more than a decade. Even Netflix was down more than 80% over the last decade.
Why does this happen? Who knows. Siegel posits it’s probably just a loss of confidence:
The first is that a mania did sweep these stocks, sending them to levels that were totally unjustified on the basis of prospective earnings. The second explanation is that, on the whole, the Nifty Fifty were in fact properly valued at the peak, but a loss of confidence by investors sent them to dramatically undervalued levels.
Siegel’s other fascinating discovery (see the warranted P/E ratio in the table above) was how some of these stocks with abnormally high valuations in the 1970s were actually undervalued:
What is so surprising is that many of these stocks were worth far more than even the lofty heights that investors bid them. Investors should have paid 68.5 times the 1972 earnings for Philip Morris instead of the 24 they did pay, undervaluing the stock by almost 3-to-1. Coca-Cola was worth over 82 times its earnings, and Merck should have sported a multiple of more than 76. Interestingly, the group that was the most undervalued, and subsequently most successful, catered to brand-name consumer foods, including McDonald’s, PepsiCo, Coca-Cola, and even Philip Morris.
IBM, which commanded a price-earnings ratio of 35 in the early 1970s, was actually worth only 17.1 times earnings despite its recent stellar comeback. And while investors paid 45.8 times earnings for Xerox, it was worth only 19.4 times earnings on the basis of its future growth. Polaroid sported the highest price-earnings ratio, selling for a fantastic 94.8 times earnings, almost eight times higher than was justified by its future returns. Who would have thought in the 1970s that a soft drink manufacturer would so thoroughly trounce technology giants such as IBM, Digital Equipment, Texas Instruments, Xerox, and Burroughs?
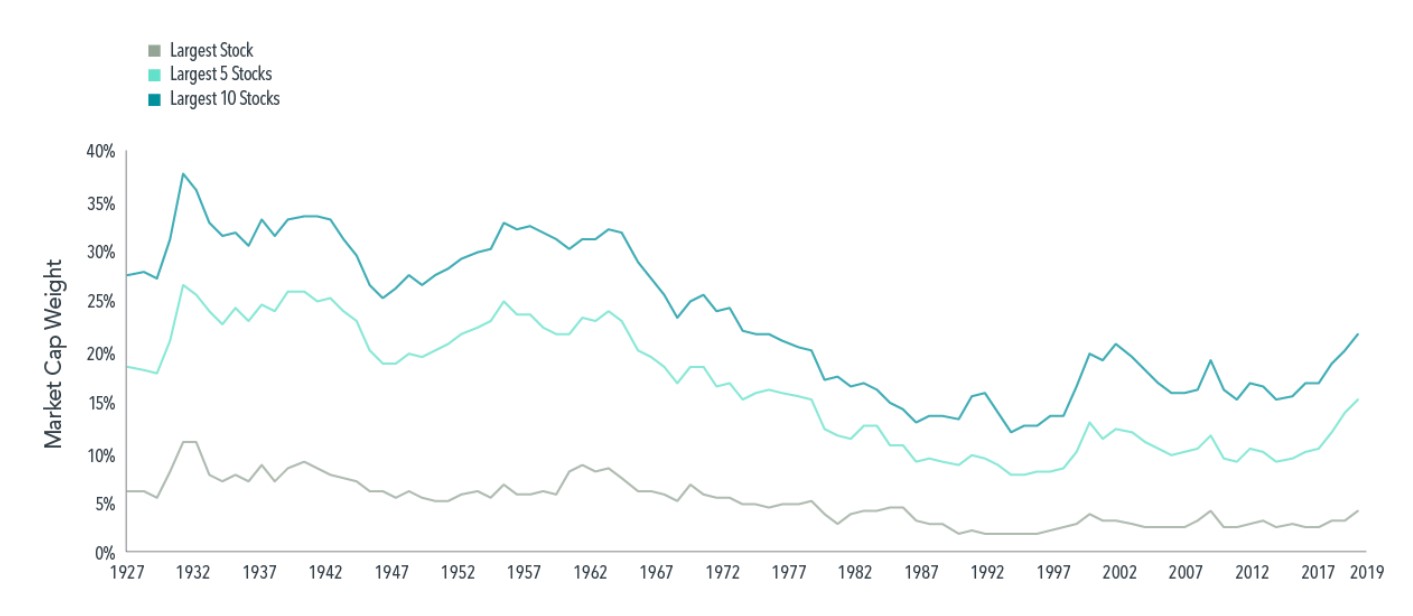
The other side of the one decision nature of these stocks comes from those who point out the growing concentration of these companies at the top of the stock market. The biggest 5 stocks (Microsoft, Apple, Amazon, Google and Facebook) now make up more than 17% of the entire U.S. stock market.
Granted, this is higher than it has been in recent decades but Dimensional Fund Advisors shows it’s not out of the ordinary over the history of the stock market back to the 1920s:
DFA also shows the biggest names can remain king of the mountain for much longer than most investors could imagine:
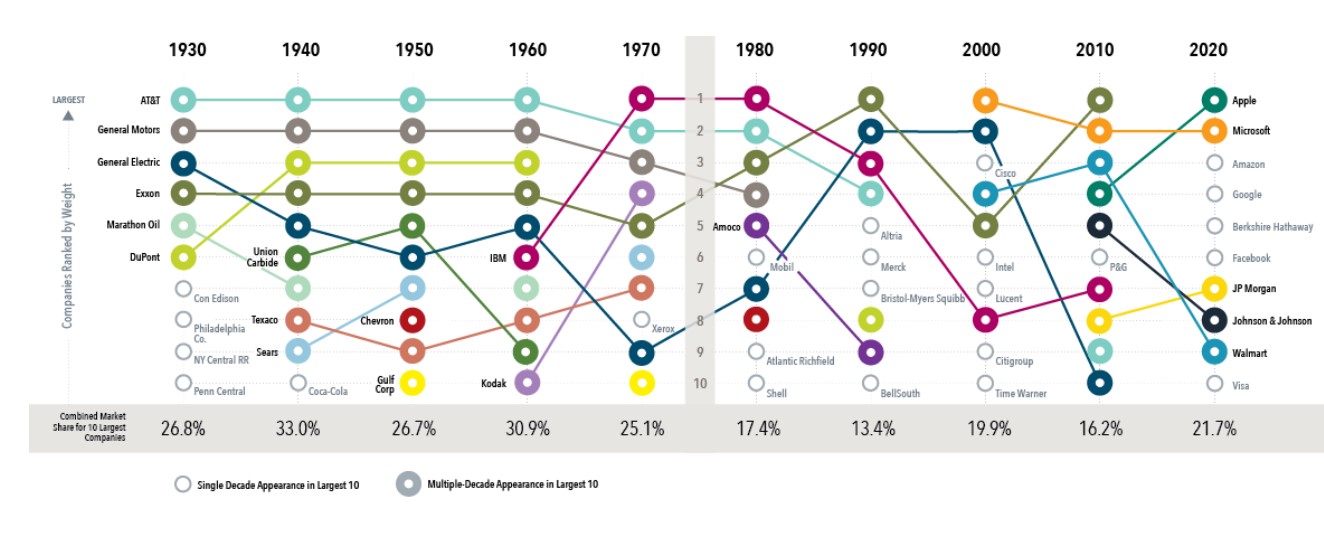
Dimensional notes:
AT&T was among the largest two for six straight decades beginning in 1930. General Motors and General Electric ranked in the top 10 at the start of multiple decades. IBM and Exxon were also mainstays in the second half of the 20th century. Hence, concentration of the stock market in a few large companies such as the FAANG stocks in recent years is not a new normal; it is old normal.
This doesn’t mean the largest stocks will continue to outperform. Were that to happen the biggest companies would completely eat the entire stock market. Trees don’t grow to the sky and whatnot.
DFA’s analysis shows the annualized excess return after first becoming a top 10 stock in the market shows outperformance of 0.7% over the ensuing 3 years. But over 5 years these new top 10 stocks underperform by 1.1% annually. Over 10 years, that underperformance has been 1.5% annually.
There is something for everyone in this data.
Overvalued stocks can get wrecked when investors lose confidence in their ability to grow.
Sometimes overvalued stocks can still work out fabulously over the long run but it’s smart to diversify among growing companies since many of them are likely to flame out.
The biggest stocks can stay big for many years and even decades but that doesn’t mean they will to continue to outperform.
Individual stocks are often more confusing than the market itself and can lead to some contradictory outcomes depending on your time horizon and which types of stocks you’re looking at.

