There are some residual scars remaining from the Great Financial Crisis but it feels like a distant memory in many respects. Most people seem to have moved on.
That didn’t happen quite so quickly following the Great Depression. Those involved had memories of that crash that lingered for decades. People more or less stopped going to work in the financial industry. It wasn’t until the bull market of the 1960s — one of the great forgotten bulls in history — that the finance industry finally let go of those memories.
This was mostly because the old guard finally retired and new blood showed up to take their place. By 1969 half of all salespeople and analysts on Wall Street had started in the business in 1962 or later. Most of the portfolio managers of that day had entered around 1965 or so, making most of them ill-prepared for the eventual end of the bull market.
John Brooks documented this time period in his book, The Go-Go Years. Here he draws comparisons to the Great Depression:
From the September 1929 peak to the nadir of the Great Depression in the summer of 1932, the Dow industrial average dropped from 381 to 36, or just over 90 percent. From the December 1968 peak to the May 1970 bottom, the same index dropped from 985 to 631, or about 36 percent. By that standard, a pistol shot against a mortar barrage. But, as we have had occasion to note before, that standard really will not do; the Dow accurately reflected the 1929-1932 market when house painters and office girls were making their plunges in Dow stocks like General Motors and Standard Oil of New Jersey, and woefully failed to reflect the 1969-1970 market when similar plunges were far more likely to be made in Control Data or Ling-Temco-Vought.
A financial consultant named Max Shapiro, writing in the January 1971 issue of Dun’s Review, tried to construct a new yardstick more appropriate to the new situation. As a rough modern counterpart to what the Dow represented in the old days, Shapiro made a list of thirty leading glamour stocks of the nineteen sixties — ten leading conglomerates including Litton, Gulf and Western, and Ling-Temco-Vaught, ten computer stocks including IBM, Leasco, and Sperry Rand, and ten technology stocks including Polaroid, Xerox, and Fairchild Camera. The average 1969-1970 decline of the ten conglomerates, Shapiro found, had been 86 percent; of the computer stocks, 80 percent; of the technology stocks, 77 percent. The average decline of all thirty stocks in this handmade neo-Dow had been 81 percent. Even allowing for the fact that the advantage of hindsight gave Shapiro the opportunity to choose for inclusion in his list particular stocks that would help prove his point, his analysis strongly suggests that, as measured by the performance of the stocks in which the novice investor was most likely to make his first plunges, the 1969-1970 crash was fully comparable to that of 1929.
So the most popular stocks of the day in the 1960s experienced a crash similar to that seen in the Great Depression. Brooks also made the point that this crash may have been even more painful because there were more people involved in the stock market at the time. In 1929 there were only 4-5 million Americans who owned stocks. But 1970, that number had jumped to 31 million equity owners.
The neo-Dow data in here caught my attention because I’d never heard that this bear market was so severe. So I ran some numbers using Fama/French data to get a better sense of how this time frame played out. The bull market in the 1960s leading up to the peak started in late-1962 so the following table shows the annual returns in that period as well as the ensuing drawdown for Fama/French sectors against the S&P 500:
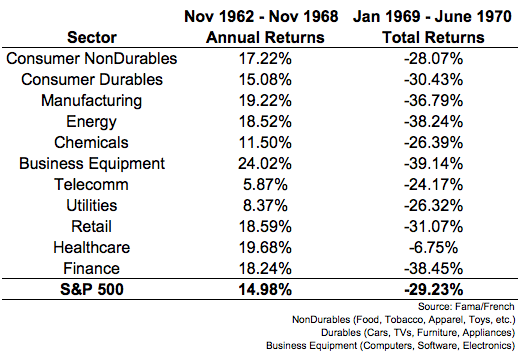
There were some sectors that saw healthy returns in the go-go years’ bull market but the losses in the bear market following the peak were fairly similar across the board. None of the sectors saw losses in excess of 40% so this was a run-of-the-mill bear market by the looks of it.
The fact that a handful of popular stocks that most investors owned crashed in a similar fashion to that seen in the Great Depression shows how harmful chasing fad investments can be, especially if it’s in a concentrated fashion. An investor with a portfolio even approaching diversification likely would have done much better in this situation. It was only those investors who chased the hot stocks of the day that got killed.
To be fair, it was much harder to diversify back in the 1960s. Mutual funds were just becoming popular but they mostly invested in these same stocks. There were no index funds or ETFs to speak of. The majority of investors made their selections on the advice of their brokers. And as I said at the outset, these brokers were mostly green and looking to make commissions, not offer helpful financial advice (Brooks’s book details many broker shenanigans in the 1960s).
One of the craziest parts about this crash is the fact that the nifty fifty stocks — names like Coca-Cola, Johnson & Johnson, Polaroid, Avon, McDonald’s, Disney, etc. — once again took off following this bear market and saw investors pay up to anywhere from 50 to 100 times earnings by the early 1970s.
Maybe investors will never learn. This is a great lesson for anyone chasing today’s high fliers.
Source:
The Go-Go Years: The Drama and Crashing Finale of Wall Street’s Bullish 60s
Further Reading:
9 Lessons from Great Depression
