There are two types of inflation rates that matter.
Economists and market observers care about the government reported data — CPI, core PCE, ex-shelter, whatever your preferred method is.
Everyday Americans only care about two price points — gas and grocery store prices.
Why is this the case?
These are the prices you experience on a regular basis. Gas prices are spelled out on huge signs with big numbers. We see those numbers daily when we drive by or fill up the tank.
We go to the grocery store regularly, so most people have a pretty good sense of what they generally pay when buying groceries.
When prices at the pump or grocery store change, people notice. In recent years, people have noticed higher grocery store prices. There are tons of viral videos of people complaining about higher prices on groceries.
That’s because food prices are much higher.
Food inflation has been higher than the overall CPI basket since the start of 2020. This chart shows the inflation in food at home (groceries), the overall CPI, food away from home (restaurants) and wage growth:
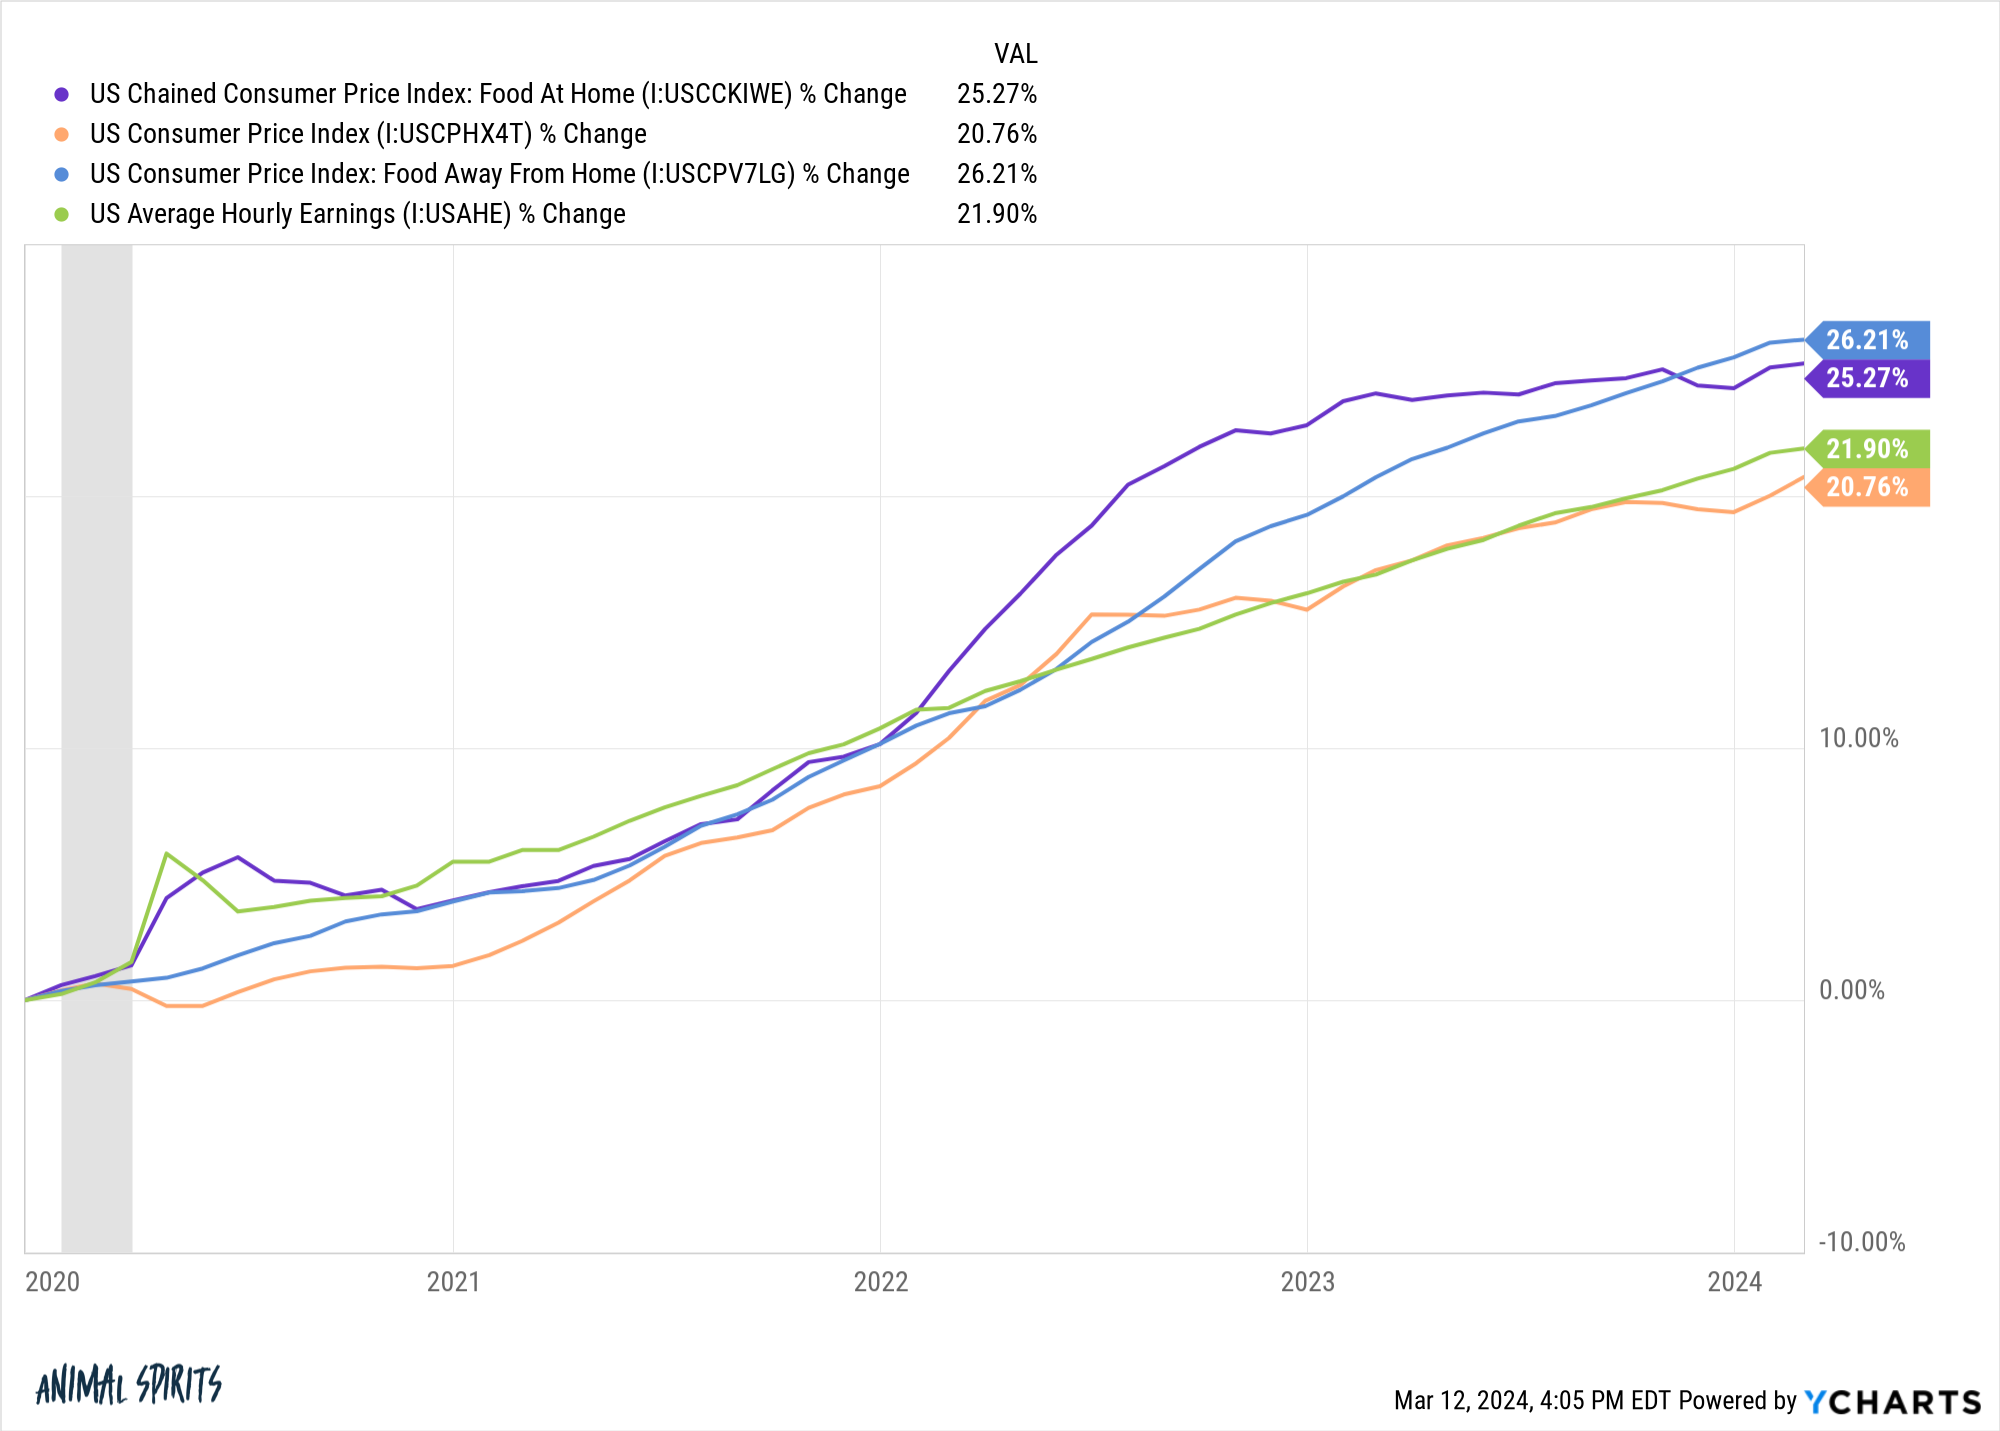
Earnings have actually grown at a faster pace than overall inflation, but food at the grocery store and restaurants have grown faster than wages.
It should also be noted that wages for restaurant workers have outpaced both inflation and food prices. Average hourly wages for restaurant workers are up nearly 30% since 2020. One of the reasons you’re paying more for food is because service wages have finally increased.
Regardless of the reason, higher prices are putting a strain on many household budgets. The Wall Street Journal notes households haven’t spent this much of their budget on food in over 30 years:
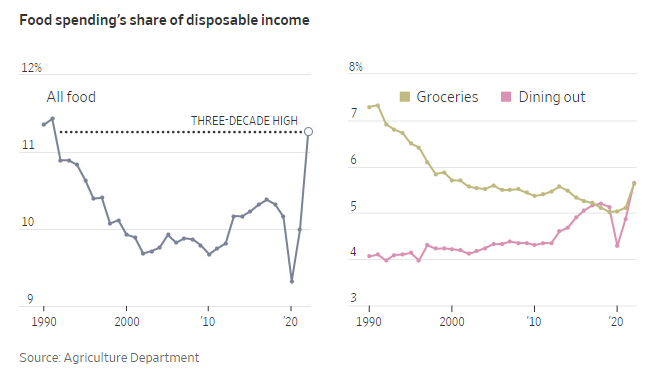
To be fair, this number is up just 1% from the pre-pandemic days in 2019. That’s no fun but it’s not the end of the world if you zoom out a bit. I would argue this is a borderline chart crime with such a truncated y-axis.
In fact, households today spend far less on food and other necessities than previous generations.
Robert Gordon wrote about the first large scale American budget studies performed by the BLS:
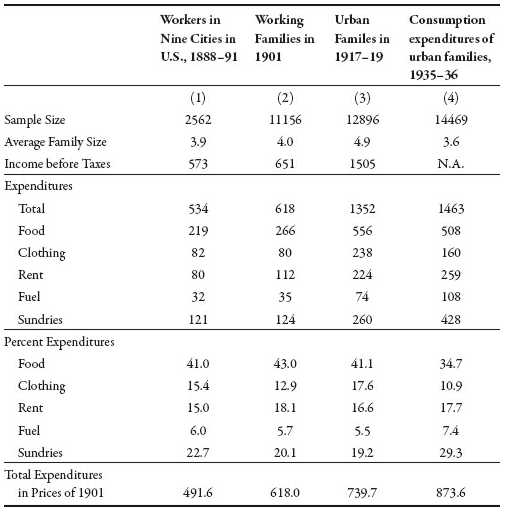
The total share of spending on food and clothing across these four time periods was 56%, 56%, 59% and 46%, respectively.1
In the most recent BLS Consumer Expenditures report, those line items added up to a little more than 15%.
Jeremy Horpedahl broke down the changes in household spending since the turn of the 20th century which gives you a better idea about the evolution of household spending over time:
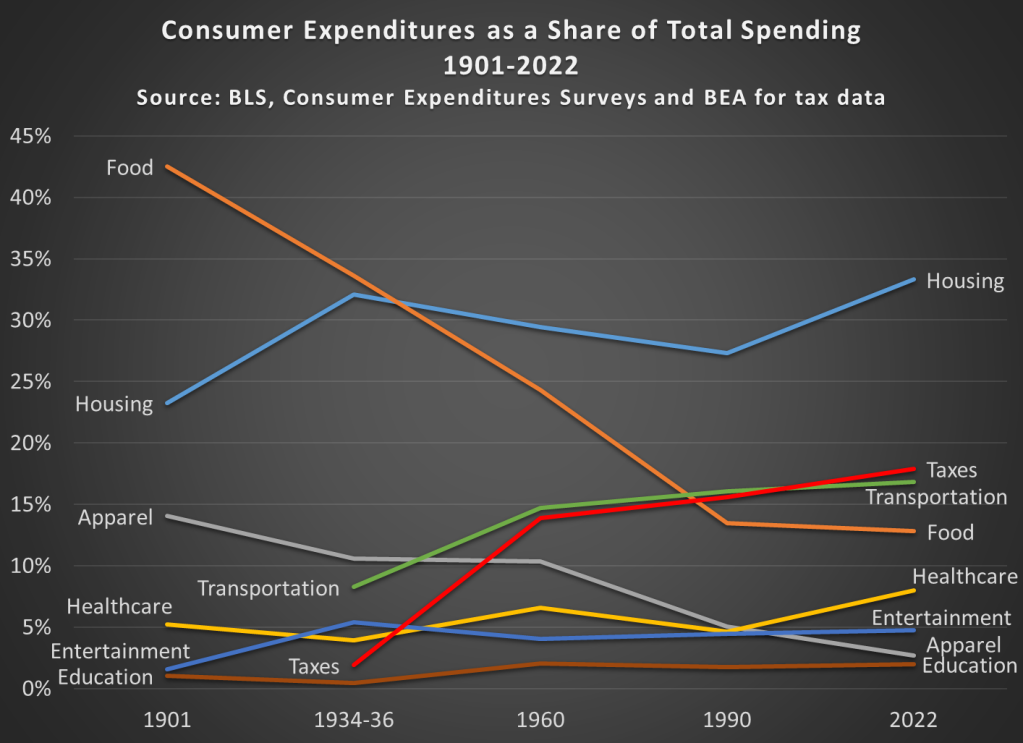
While the food share of disposable income has risen in recent years, it’s been in a massive drawdown for decades. So it really depends on your frame of reference.
People only notice when things are getting worse. No one ever pays attention when things get better.
Just look at wages versus grocery store prices in the 2010s:
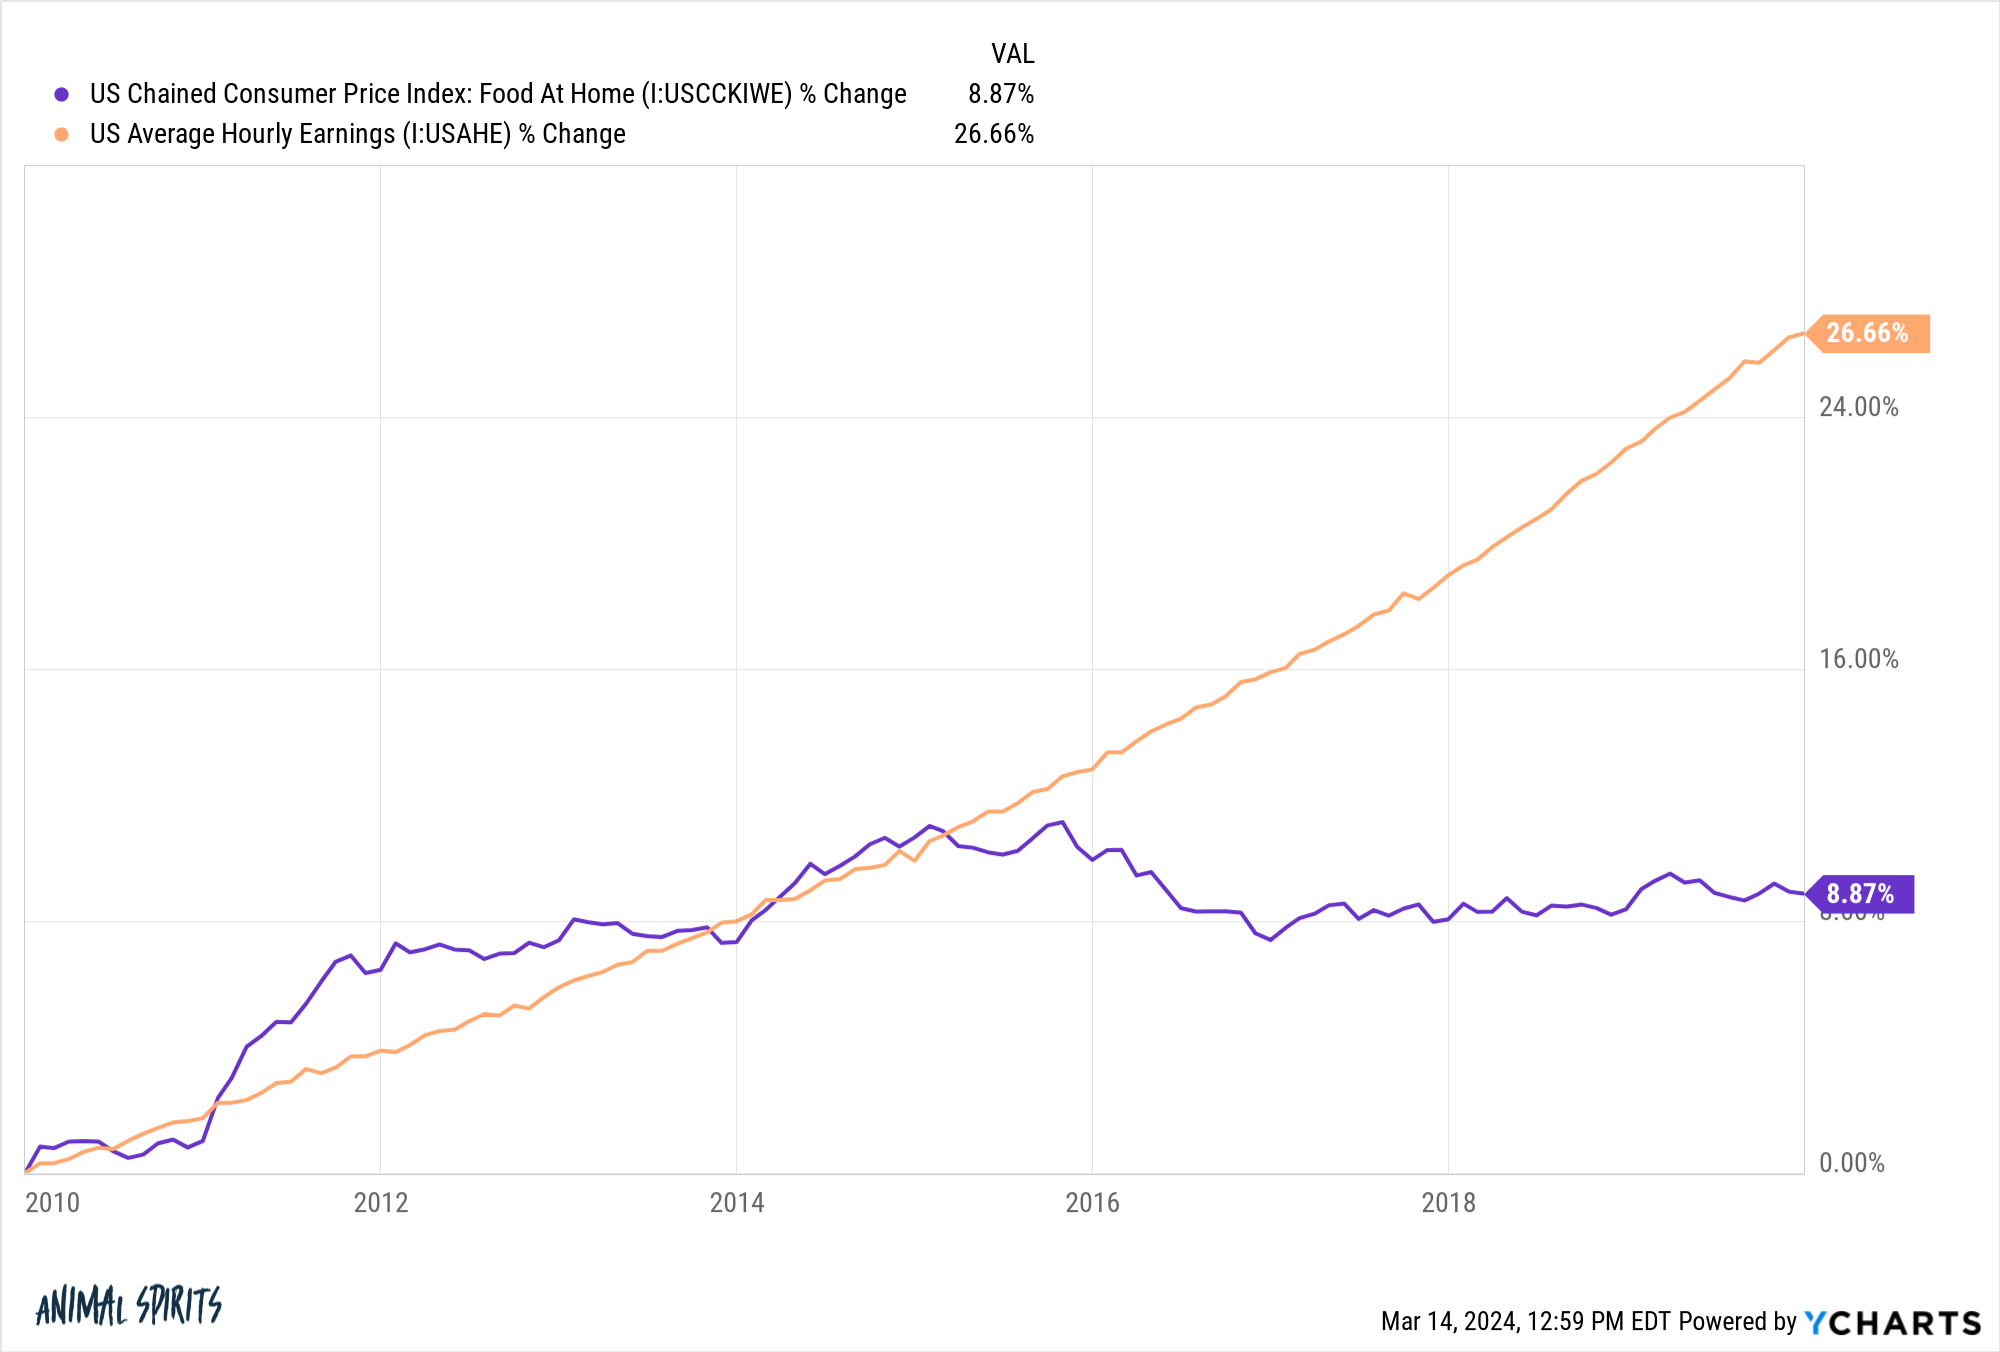
Wages far outpaced prices at the grocery store but there were no viral videos of people giving thanks.
It makes sense that we complain when things get worse but don’t celebrate when things get better — losses sting twice as bad as gains make you feel good. Inflation is a loss of purchasing power.2
I’m not trying to gloss over the fact that many households are struggling with higher prices are the grocery store. Food is a necessity. Not everyone’s wages have kept pace with inflation. The averages don’t always tell the whole story for every individual’s circumstances.
It’s also worth noting we now have so many more “necessities” in our budgets these days that people in the past didn’t have to deal with.
Everyone has to have a smartphone, which requires a monthly fee. The Internet is now a necessity for most people. That’s another new bill that’s relatively new.
In the past people either didn’t have TV or had an antenna that gave them free access to three channels. Now, we all pay for cable or streaming services (or both).
Most households were lucky to have a single TV back in the 1950s and 60s. Now we have screens everywhere — flatscreen TVs, iPads, laptops, desktops, iPhones.
My point is that households have far more “necessities” than they did in the past. Can you imagine how much you could save each month if you just subtracted your cellphone bill, internet, and cable/streaming subscriptions? Probably enough to cover the grocery bill and then some.
Plus, more young people have student loans than ever before, and everyone pays more for healthcare than in the past.
I think this is one of the reasons higher food prices are so painful for so many households. There are so many other budgetary line items these days that an increase in grocery store prices becomes even more painful.
The good news for your budget is the inflation rate in food prices is subsiding. In the 12 months ending February 2024, CPI for food at home grew just 1%, well below the overall inflation rate of 3.2%. And wages are outpacing inflation by a healthy clip too.
Michael and I talked about inflation, grocery store prices and much more on this week’s Animal Spirits video:
Subscribe to The Compound so you never miss an episode.
Further Reading:
Now here’s what I’ve been reading lately:
- Are index funds breaking the stock market? (Irrelevant Investor)
- Peter Rabbit won’t blow up your financial plan (A Teachable Moment)
- Why don’t we do what we want (Young Money)
- How much should you spend on a vacation? (Art of Manliness)
- A short history of global living conditions (Our World in Data)
- The unbearable sadness of the health influencer (The Lindy Newsletter)
- Why are U.S. stocks so resilient? (The Investing Show)
Books:
1Also, if you want to know why prices were so low in the past, just look at how low disposable incomes were. Five-cent candy bars sound great until you realize most households were making like $1,000 a year.
2Maybe the last four years is just prices playing catch-up to some extent. Since the start of 2010, wage growth is far higher than food price growth — 54% to 37%.
