The Misery Index was created by Arthur Oken, an economist who worked for the Johnson administration in the 1960s.
It’s supposed to measure how citizens are doing economically by adding up the unemployment rate and the inflation rate. Here’s the data going back to the late-1940s:
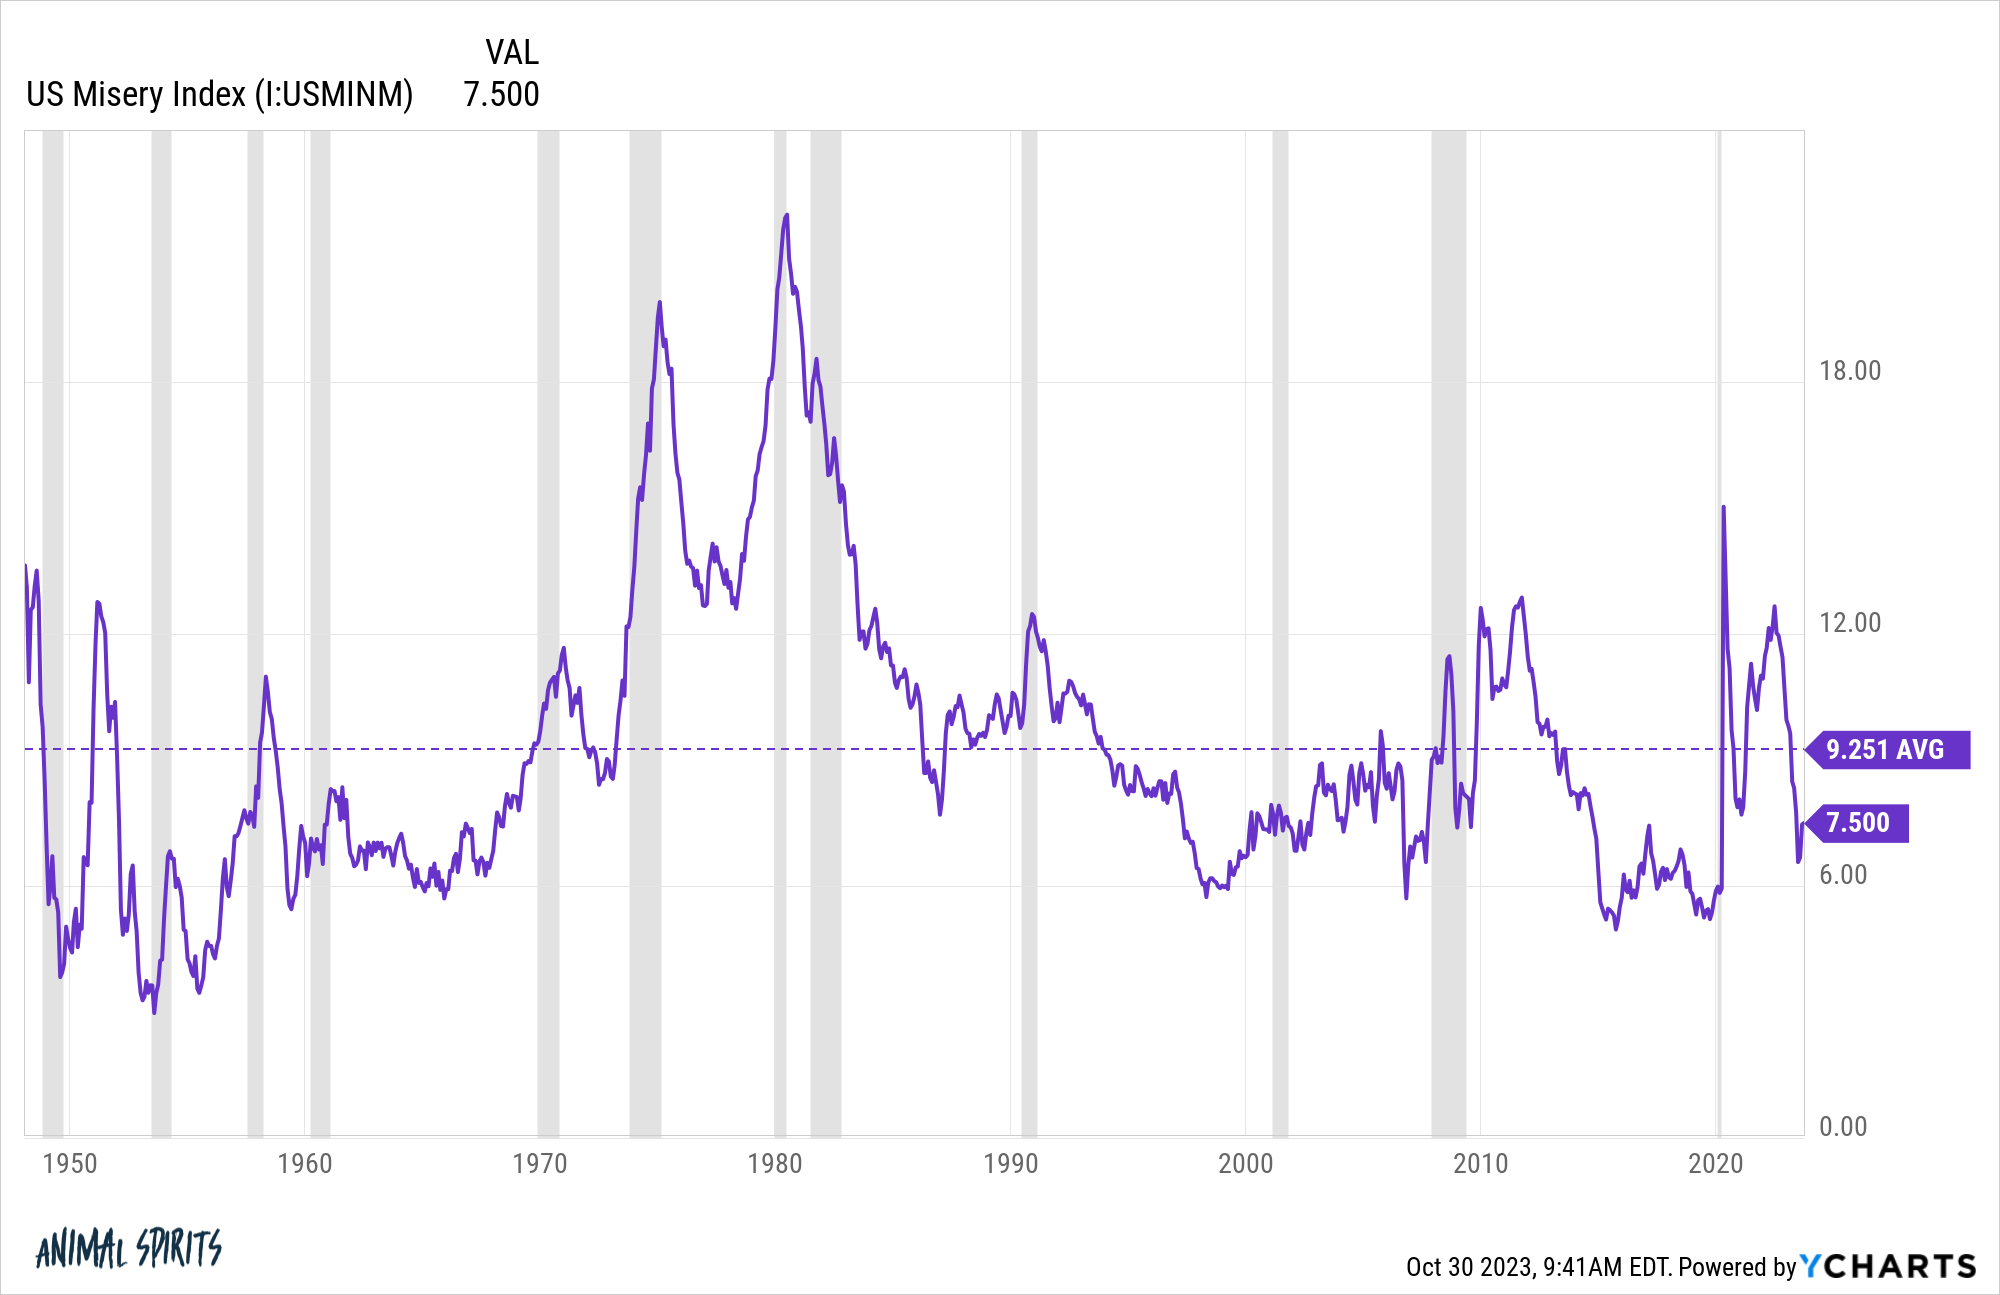
It may come as a surprise to some people that we’re actually below average right now.
Certainly, a sub-4% unemployment rate helps but the inflation rate has also come down.
We’re in a weird place when it comes to how people feel and what the economic data are showing.
The latest GDP report last week showed economic growth in the third quarter was 4.9%. Taking out the whipsaw from the pandemic, that was the highest economic growth we’ve experienced since 2014.
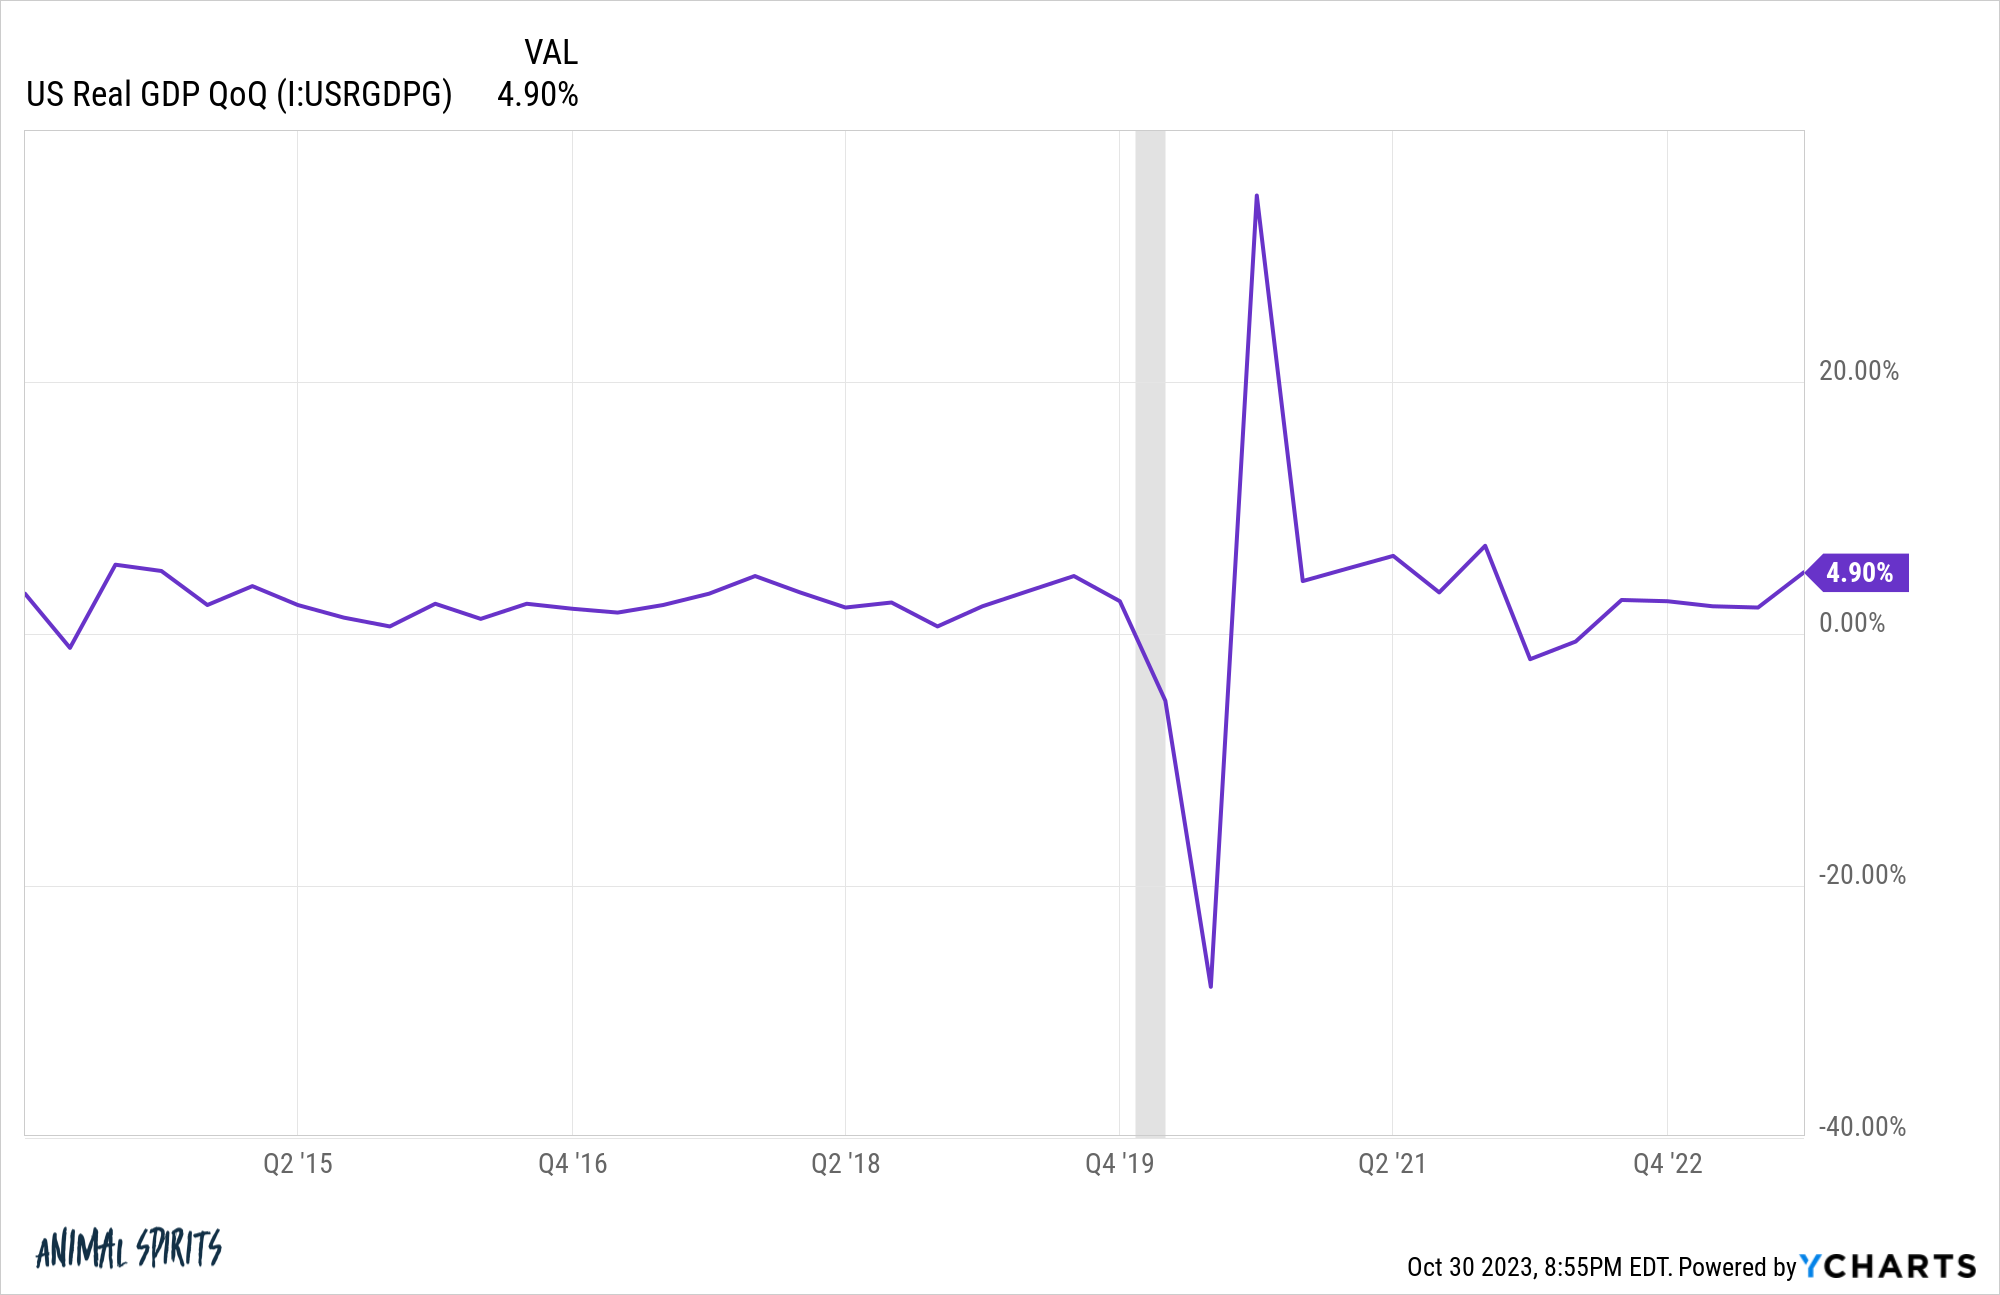
Going back to 1948, the unemployment rate has been higher than the current 3.8% in 90% of all readings. That’s pretty good.
Things could always be better and could get worse any day now but, objectively, we’ve been in a strong economy for some time now. Many people assumed we were already in a recession last year yet growth has only accelerated in 2023.
The divergence between sentiment and economic data has to be as wide as it’s ever been.
The Economist created this excellent chart that tracks sentiment and economic data over time:
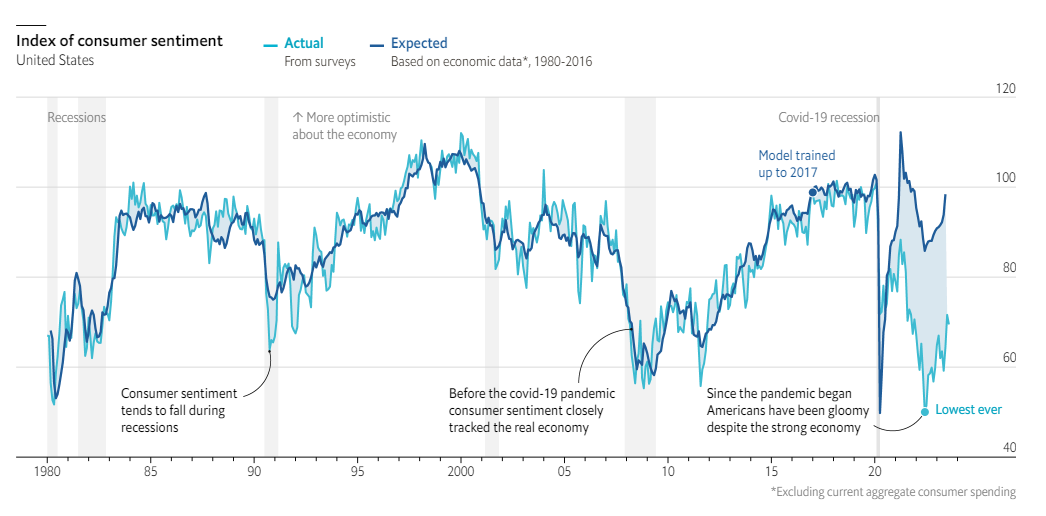
The two measures tracked one another closely for 40 years right up until the pandemic. Since then, the vibes don’t agree with the data.
Inflation is the obvious culprit but there has to be more to it than that. The inflation rate averaged 5.6% in the 1980s. Since 2021 it’s averaged 5.7%. We’re still a long way off from the 1970s when the annual inflation rate averaged more than 7%.
It doesn’t help that the media has been telling everyone a recession is imminent for the past 24 months.
The pandemic certainly screwed with our collective psyche as well.
But I want to focus on the economic side of the equation here to show why the psychology of sentiment is out of whack right now.
The whole idea of “the economy” is still a relatively new phenomenon. Gross domestic product didn’t really even exist in the way we think about it until the aftermath of the Great Depression when economists decided it would be a good idea to track economic growth.
“The economy” for most people was more or less personal. Your personal economy still matters a great deal when it comes to gauging economic sentiment, but now we’re beaten over the head every single day with scary headlines and tick-by-tick changes to everything.
No one got breaking news or alerts in the past when GDP or inflation came in 0.1% off the estimates. For most of human history people basically had to guess how the economy was doing.
And although people weren’t paying attention to this stuff all the time in the past, they were most conditioned to deal with economic volatility because the economy was more volatile.
The National Bureau of Economic Research has a list of economic expansions and contractions for the U.S. economy going back to the 1850s. Take a look at how the average length of both the recessions and the expansions has changed over time.
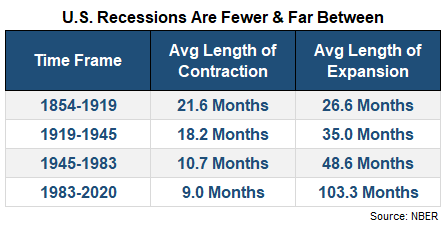
The expansions are getting longer. The recessions are getting shorter.
Not only were the recessions longer in the past but the magnitude of the declines were much more significant.
From 1854-1945, the average GDP contraction during a recession was -23%. Since 1945, we’ve seen GDP fall by an average of just 3.7% (and that includes the 19.2% decline in the short-lived 2020 pandemic-induced recession).
In the 1870s, the aptly titled Long Depression lasted for 65 months with GDP falling a stunning 34%.
The expansion following that godawful downturn lasted less than three years before another depression hit that lasted more than three years. The U.S. economy was in a recession roughly three-quarters of the time for more than a decade.
Can you imagine if that happened today?! People would lose their minds.
Now we have decade-long economic expansions.
Before the brief 2020 downturn, it had been over a decade since the last recession ended in June 2009. There were six years between the 2001 recession and the start of the Great Financial Crisis in 2007. It was a decade between the end of the recession in 1991 and the start of the next one in 2001. There was nearly a decade between the end of the 1982 recession and the start of the recession in 1990.
Since 1983, there has been a grand total of four recessions or one every ten years or so.
This is a good thing but it also means we’re not used to economic volatility the way people were in the past.
Look at how much more volatile the inflation rate was in the pre-1960s era:
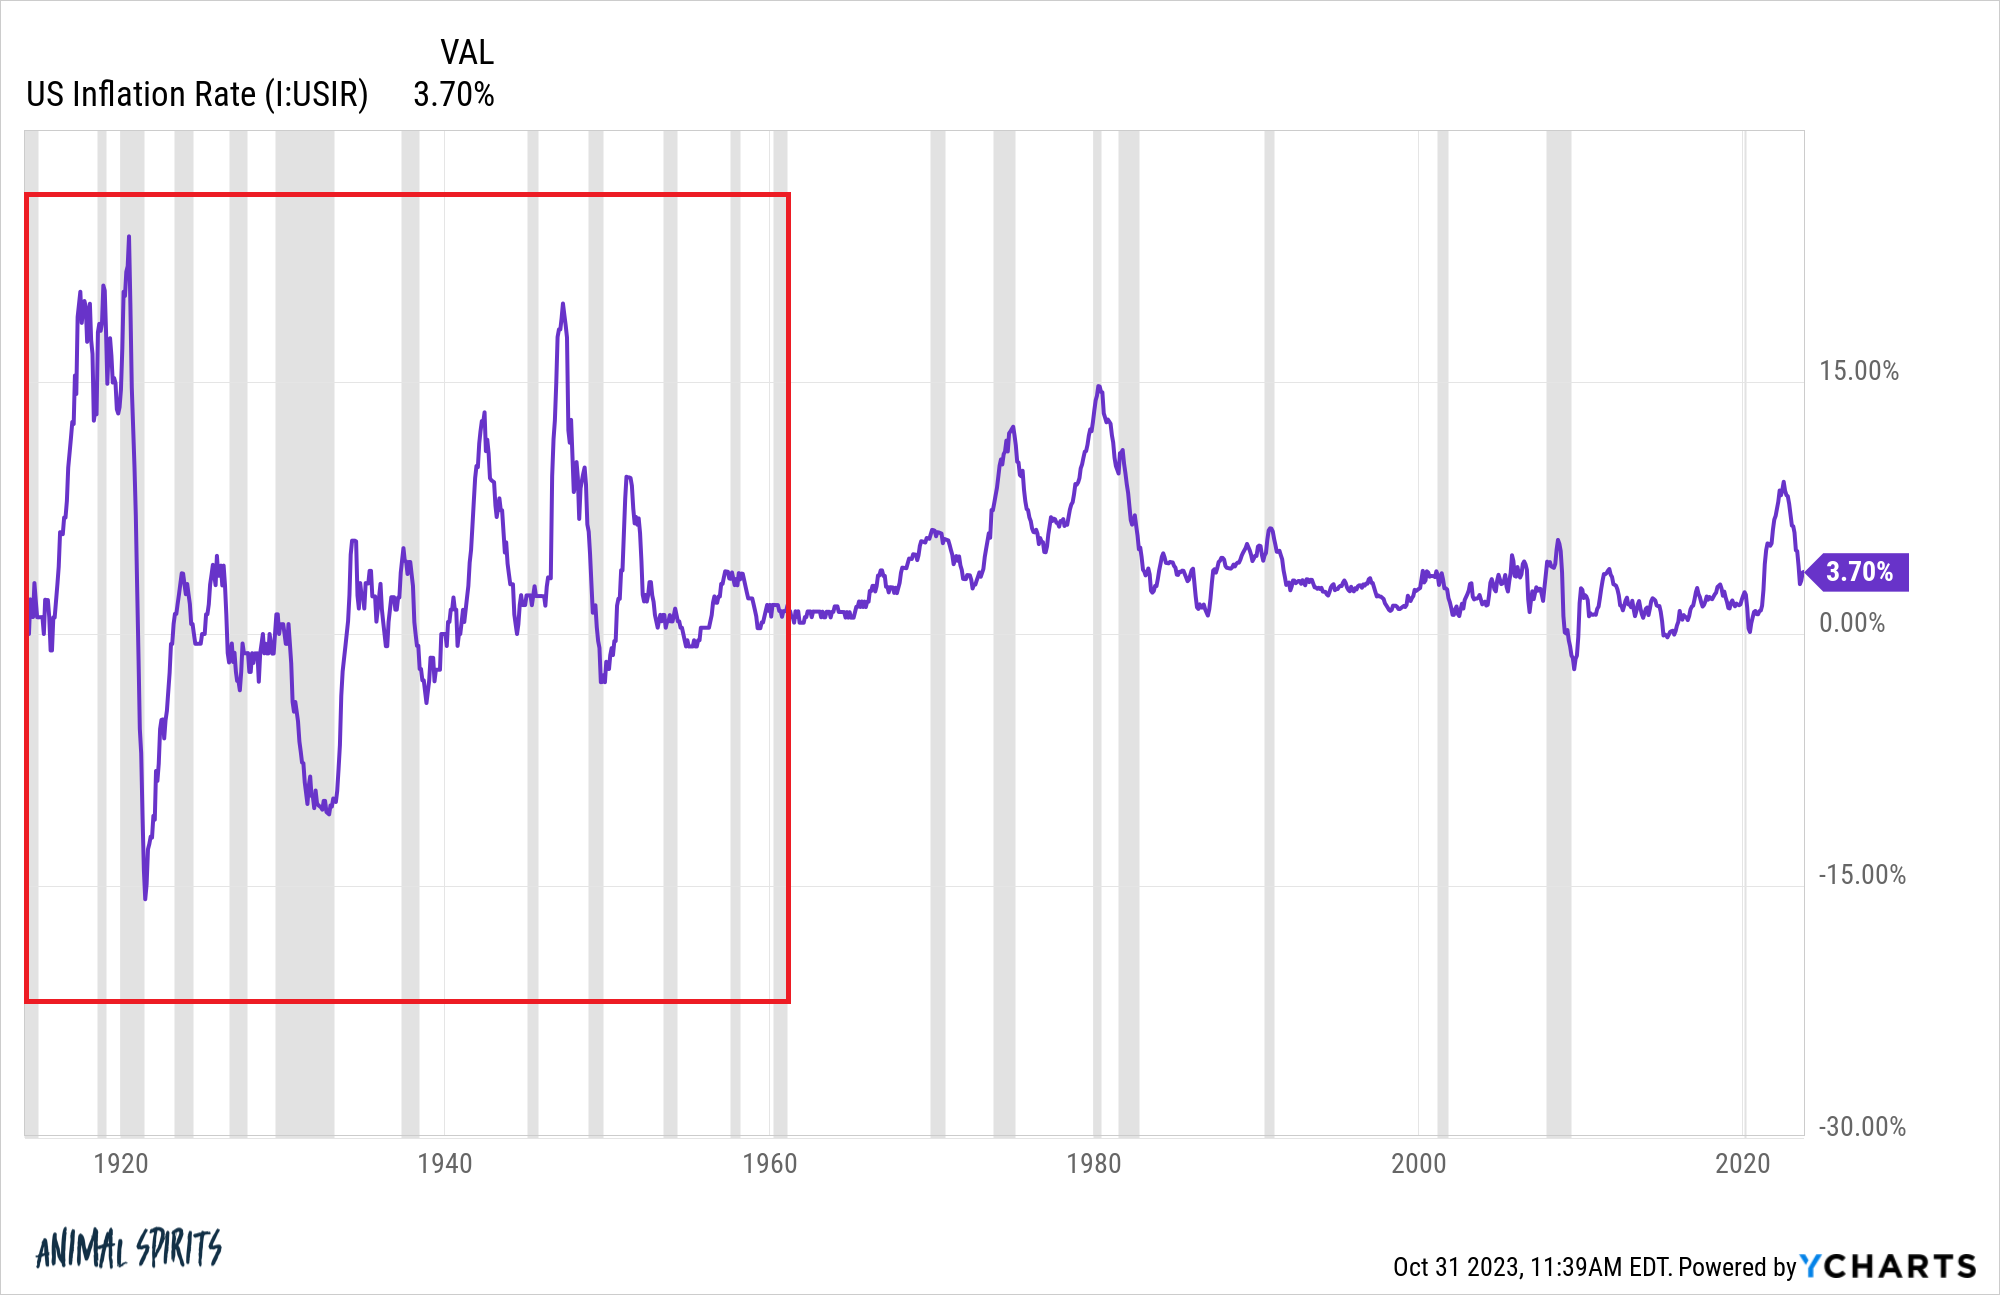
It was a constant back-and-forth between massively high inflation and bone-crushing deflation from all of the wars, recessions and depressions.
I know people love to complain about the Fed and government spending but our economy really is much more stable these days than it was in the past.
Every old generation thinks the young generations are soft. When I was your age…
Most people don’t realize this is actually a sign of progress. Future generations should be softer than previous generations as innovation and hard work make our lives easier than they were in the past.
Maybe we’ve become a little complacent because there hasn’t been nearly as much economic volatility in modern times as previous generations were forced to deal with.1
And that’s a good thing!
I hope the pandemic-induced economic volatility is the outlier and economic volatility settles down going forward.
Everyone and their brother has been predicting a recession for the past 24 months and complaining about the state of the economy.
Maybe the silver lining of the economic volatility we’ve experienced and the divergence between sentiment and economic data is more households will be prepared when that next downturn actually hits for real.
Further Reading:
Americans Have Never Been Wealthier & No One Is Happy
1I’m sure a lot of people are going to disagree with me here but it’s true.

