One thing I’ve learned from studying market history is your general experience is rarely close to the historical averages.
For example, the annual average return for the U.S. stock market over the past 95 years was 9.6%. But just 4 out of those 95 years experienced returns in the 8% to 12% range. The actual returns vary widely around that average.
The same tends to be true when it comes to bull markets and bear markets. The length and magnitude of the gains tend to fluctuate depending on the environment.
The strange thing about the most recent bear market we just lived through is that it was basically average for the type of bear market that it was.
There are two main types of bear markets:
(1) Recessionary bear markets. Market downturns that occur in and around a recession.
(2) Non-recessionary bear markets. Market downturns that occur for some other reason beyond a recession.
Here is a list of historical recessionary bear markets:
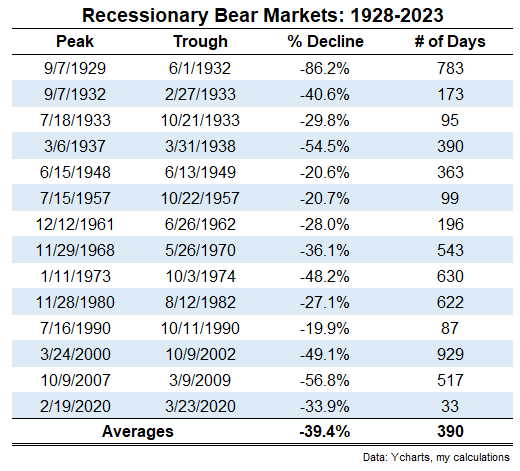
Not all of these drawdowns were the end of the world but this list contains a who’s-who of the worst crashes in history.
The Great Depression. The 1937 crash. The 1973-74 bear market. The dot-com blow-up. The Great Financial Crisis.
One of the reasons so many people predicted the bear market would get a lot worst before it got better was everyone assumed a recession was imminent.
The stock market was already down 20%+ and we hadn’t even experienced an economic contraction. It only seemed like a matter of time before things got worse.
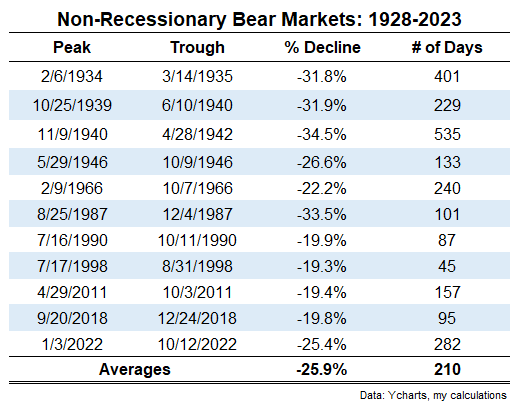
If you look at a list of the non-recessionary bear markets1 the fact that we bottomed makes more sense:
Here’s the tale of the tape between the 2 types of downturns:
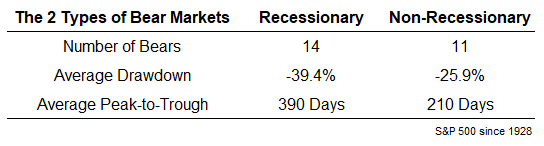
Recessionary bear markets have seen deeper drawdowns that last for a lot longer from peak-to-trough than non-recessionary bear markets, on average.
If you look at the most recent version, which I am now comfortable placing on the non-recessionary list, it was a run-of-the-mill non-recessionary bear market. It was a loss of 25.4% lasting 282 days from peak-to-trough, pretty darn close to the long-term averages of -25.9% and 210 days.
The S&P 500 remains 2-3% from all-time highs on a total return basis so we can probably look at the average time to breakeven for this bear market as well.
Here’s how it stacks up relative to the other bear markets since 1945:
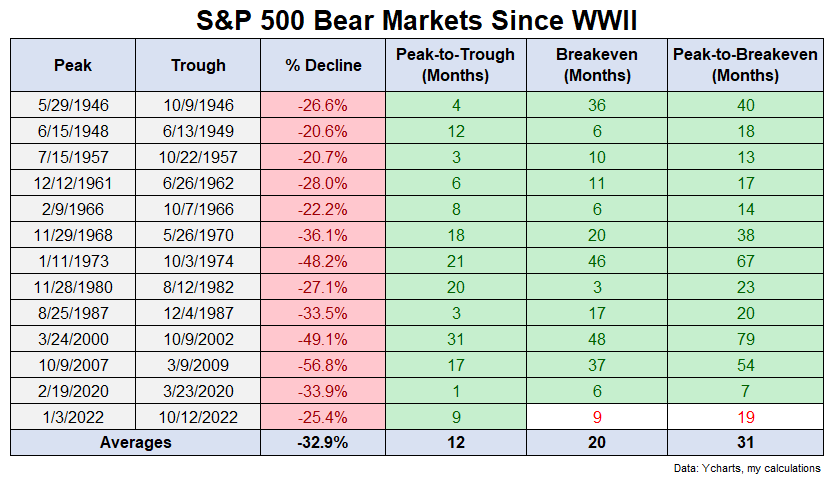
When lumped in with the other 12 bear markets over the past 78 years or so, the inflation scare of 2022 looks relatively tame by comparison.
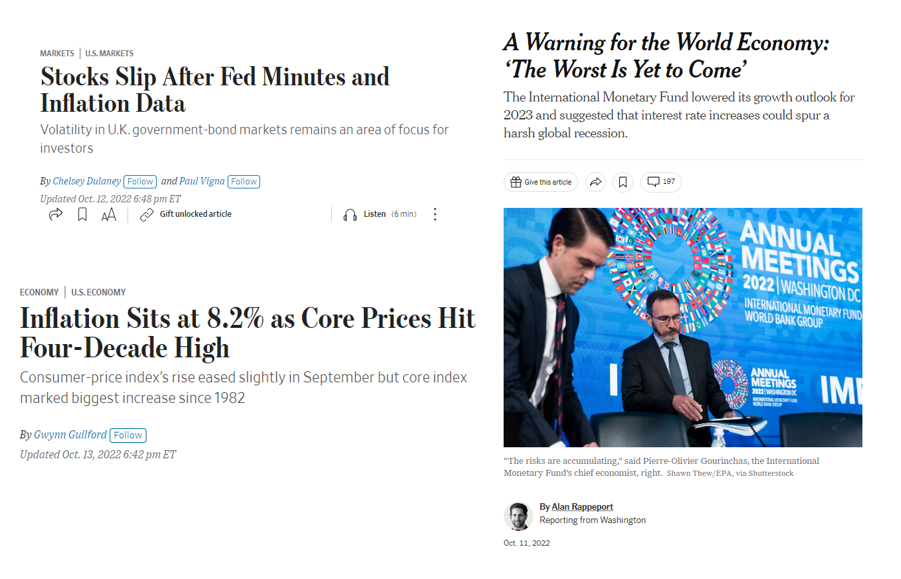
The S&P 500 bottomed on October 12, 2022.
I did a quick search of the major financial publications to figure out what the prevailing sentiment was on and around that day. It wasn’t pretty:
 No all-clear was given. They didn’t sound an air horn at the bottom just like they don’t ring a bell at the top.
The interesting dynamic at play this time around is that “everyone” was calling for a recession but it was the stock market that sniffed it out ahead of time that it wasn’t happening yet.
But the stock market is simply the collective actions of investors.
So maybe we can say everyone was right and wrong about what’s transpired in the past 9-12 months?
I don’t think the bear market was an overreaction either considering the changes we saw to inflation and interest rates. Plus we had such a large run-up in prices in 2020 and 2021 that it was good for knocking down the speculation that was running rampant.
And now that this one is over everyone can go back to worrying about what’s going to cause the next bear market.
Further Reading:
Bear Markets Are Transitory
1I added a handful of 19% and change drawdowns in here. Close enough. I rounded up.
