A reader asks:
Ben, I believe you have written at least once about how surprisingly few times the stock market has grown near its long-term average in a given year. In other words, its typical annual returns are well above its long-term ~10% average, or well below. I’m searching for it on your blog site and cannot find it. Would you mind pointing me in the right direction?
From 1926-2020, the average return for the U.S. stock market was basically 10% per year.
Investing in the stock market would be way easier if you could simply bank on 10% year in and year out. Unfortunately, it doesn’t work that way.1
If stock market returns were consistent each year, there would be no risk. If there was no risk to investing in the stock market, the stock market wouldn’t offer such attractive returns.
It’s the Catch-22 of investing in risk assets.
If you want consistency over the long haul, you have to accept lower returns. And if you want higher returns over the long haul, you have to accept more volatility.
You can never truly escape risk, just change how you accept it.
This volatility is easily observable when looking at the year-to-year returns on the U.S. stock market:
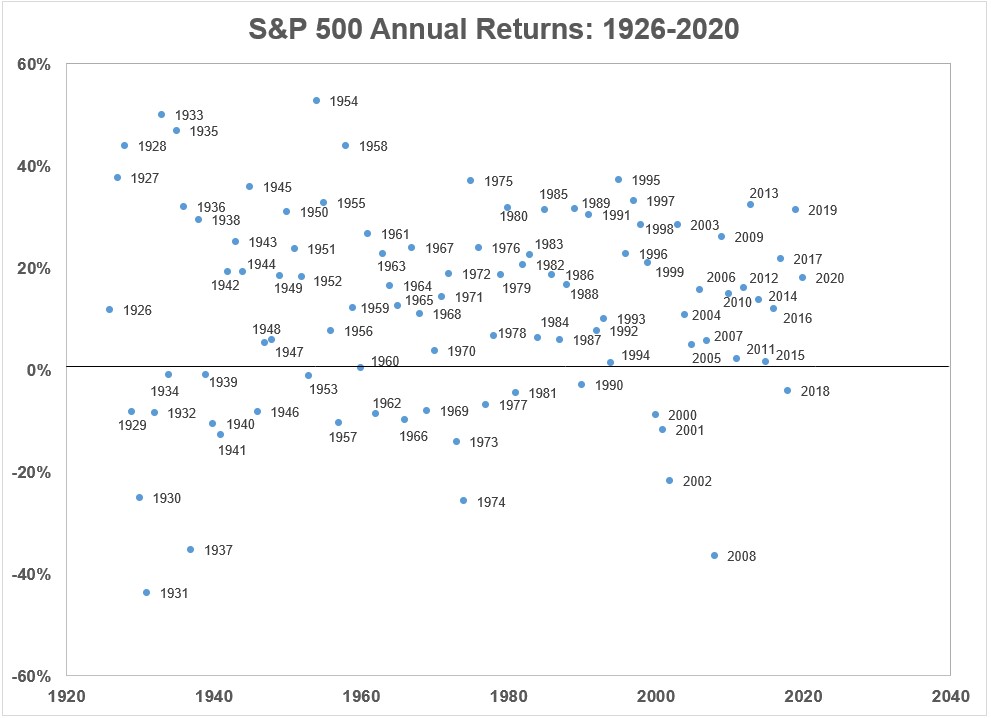
Returns are all over the map. No consistency whatsoever. Good luck predicting what’s going to happen from one year to the next.
Here’s another way of viewing returns over time by different return buckets:
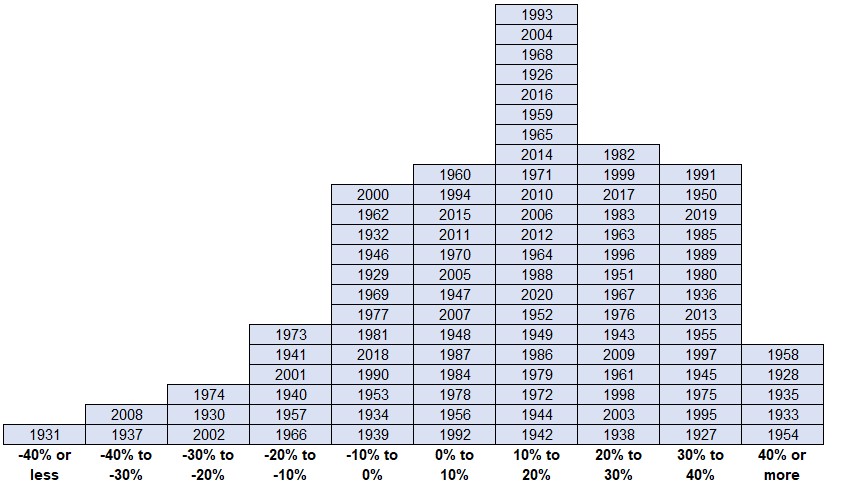
The most returns over the past 95 years have fallen into the 10% to 20% range. But it’s worth pointing out how few returns fall within the range around the long-term 10% average.
If we look at the calendar year returns plus or minus 2% from the 10% average (so 8% to 12%) this has happened in just 5 calendar years. So around 5% of all years since 1926 have seen average returns. In fact, there have been just as many yearly returns above 40% as returns in the 8% to 12% range.
Just 18% of returns have been between 5% to 15% in any given year.
Breaking things down a little further for calendar year returns from 1926-2020:
- 70 out of 95 years saw positive returns (74% of the time)
- 25 out of 95 years saw negative returns (26% of the time)
- 68 out of 95 years were double-digit gains or losses (72% of the time)
- 56 out of 95 years were double-digit gains (59% of the time)
- 12 out of 95 years were double-digit losses (13% of the time)
- 40 out of 95 years were gains or losses of 20% or more (42% of the time)
- 34 out of 95 years were gains of 20% or more (36% of the time)
- 6 out of 95 years were losses of 20% or worse (6% of the time)
Not only have stocks been up roughly 3 out of every 4 years on average, but they’ve shown double-digit gains or losses on a similar frequency. You’ve been more likely to experience a double-digit loss in a given year than a return that’s close to the long-run average.
More than one-third of all years have seen a gain of 20% or more!
Stock market returns are lumpy and not just from one year to the next. YCharts put together this slide that shows how lumpy returns can be over longer periods as well:
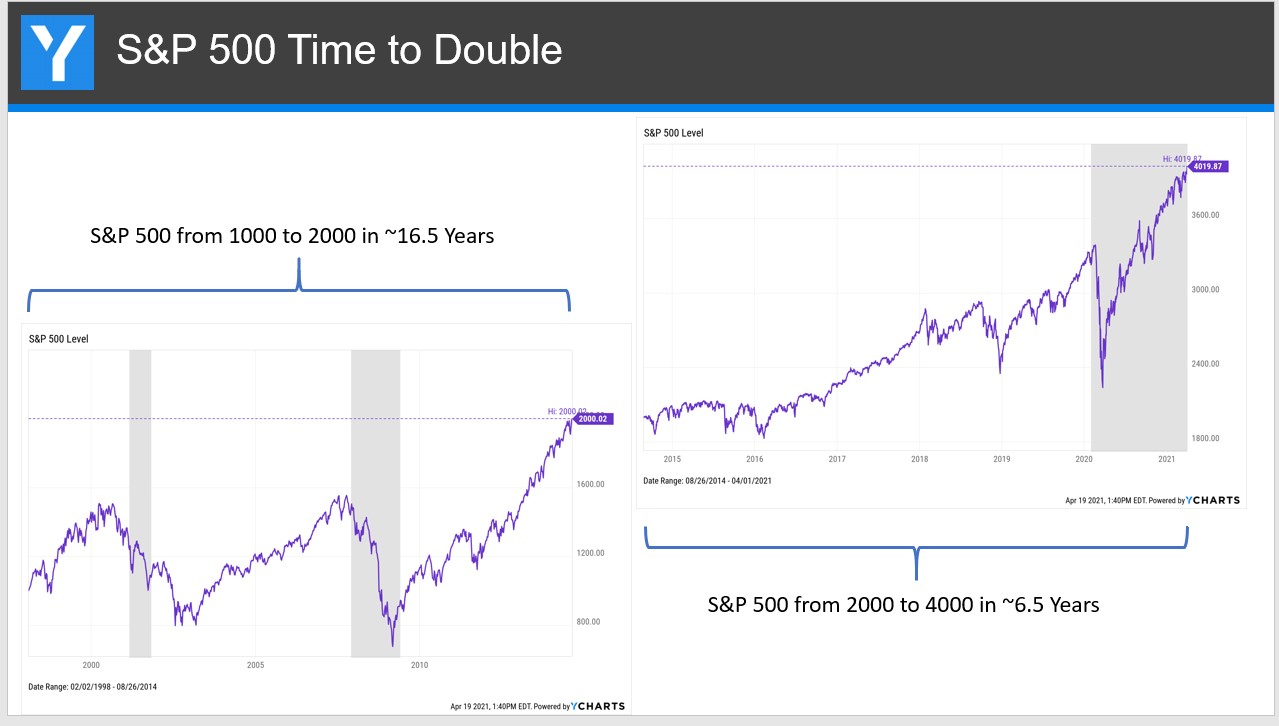
This is on a price basis (no dividends included) but the S&P 500 was range-bound for nearly 17 years. And then when it broke out, it really broke out.
The only way to truly take the randomness out of the stock market is to have a multi-decade time horizon. Yes this is easier said than done but no one said this was easy.
Using the same annual returns from above, I calculated every rolling annual 30 year return. The best 30 year return was 13.6% per year from 1975-2004. And the worst 30 year return was 8.0% per year from 1929-1958.
And remember, even 8% over 30 years can produce extraordinary results. The total return to get that 8% annual return was nearly 900%. Not bad for the worst result ever.2
Caveats abound with long-term numbers like this of course.
We haven’t taken taxes or fees or inflation into account. And we’re only working with 95 years of long-term market data here. That would be just three non-overlapping 30 year periods.
The good news is those three non-overlapping periods all produced relatively solid annual returns.
- 1926-1955: 9.7%
- 1956-1985: 9.4%
- 1986-2015: 10.3%
Or if you prefer:
- 1931-1960: 9.8%
- 1961-1990: 10.1%
- 1991-2020: 10.6%
I don’t know if the next 30 years will be this kind to investors in U.S. stocks. You could make the case investors should reduce their expectations going forward.
But if those lower expectations turn out to be correct this makes thinking and acting for the long-term even more important than ever. The stock market is always going to produce wildly different returns from year to year. I don’t see that ever changing.
Unfortunately for investors, it’s never been easier to pay such close attention to the short-term movements of the stock market.
That makes the benefits even greater for those who are able to ignore the short-term to focus on the long-term.
Further Reading:
How Often Do Long-Term Bonds Beat Stocks?
1Here’s the other problem — we have no clue if that 10% annual return over the past 95 years will still be as high over the next 95 years. There’s a good case to be made that it probably won’t but who knows.
2Also worth noting the 30 year return starting from the year 2000 could end up being the worst of all time. As of right now the annual return from the start of the century is 7.1%. You can thank the tech bubble for such a horrible entry point.

