The United States makes up nearly 60% of the global stock market by market capitalization:
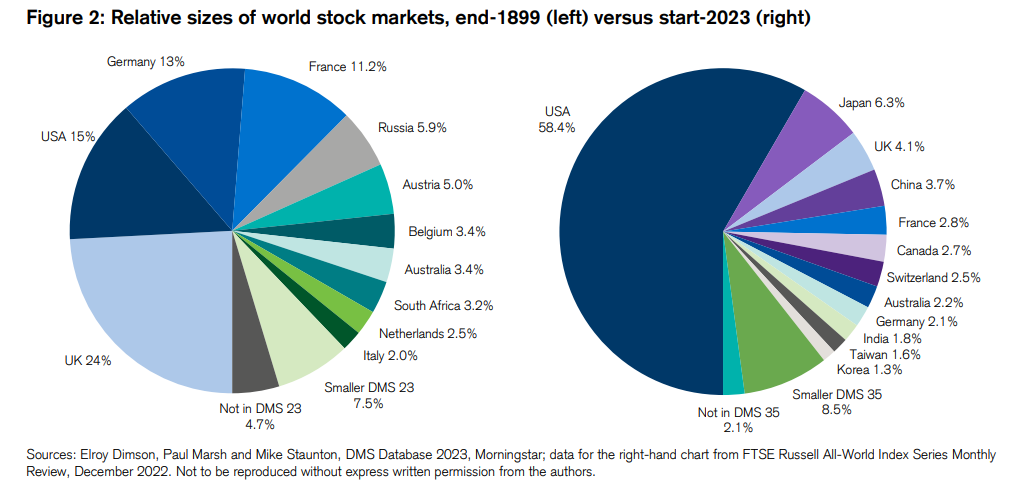
The dominance of American stocks over the rest of the world wasn’t just a 20th-century phenomenon either.
The performance over the past decade and change shows U.S. stocks winning hands down over our foreign counterparts:
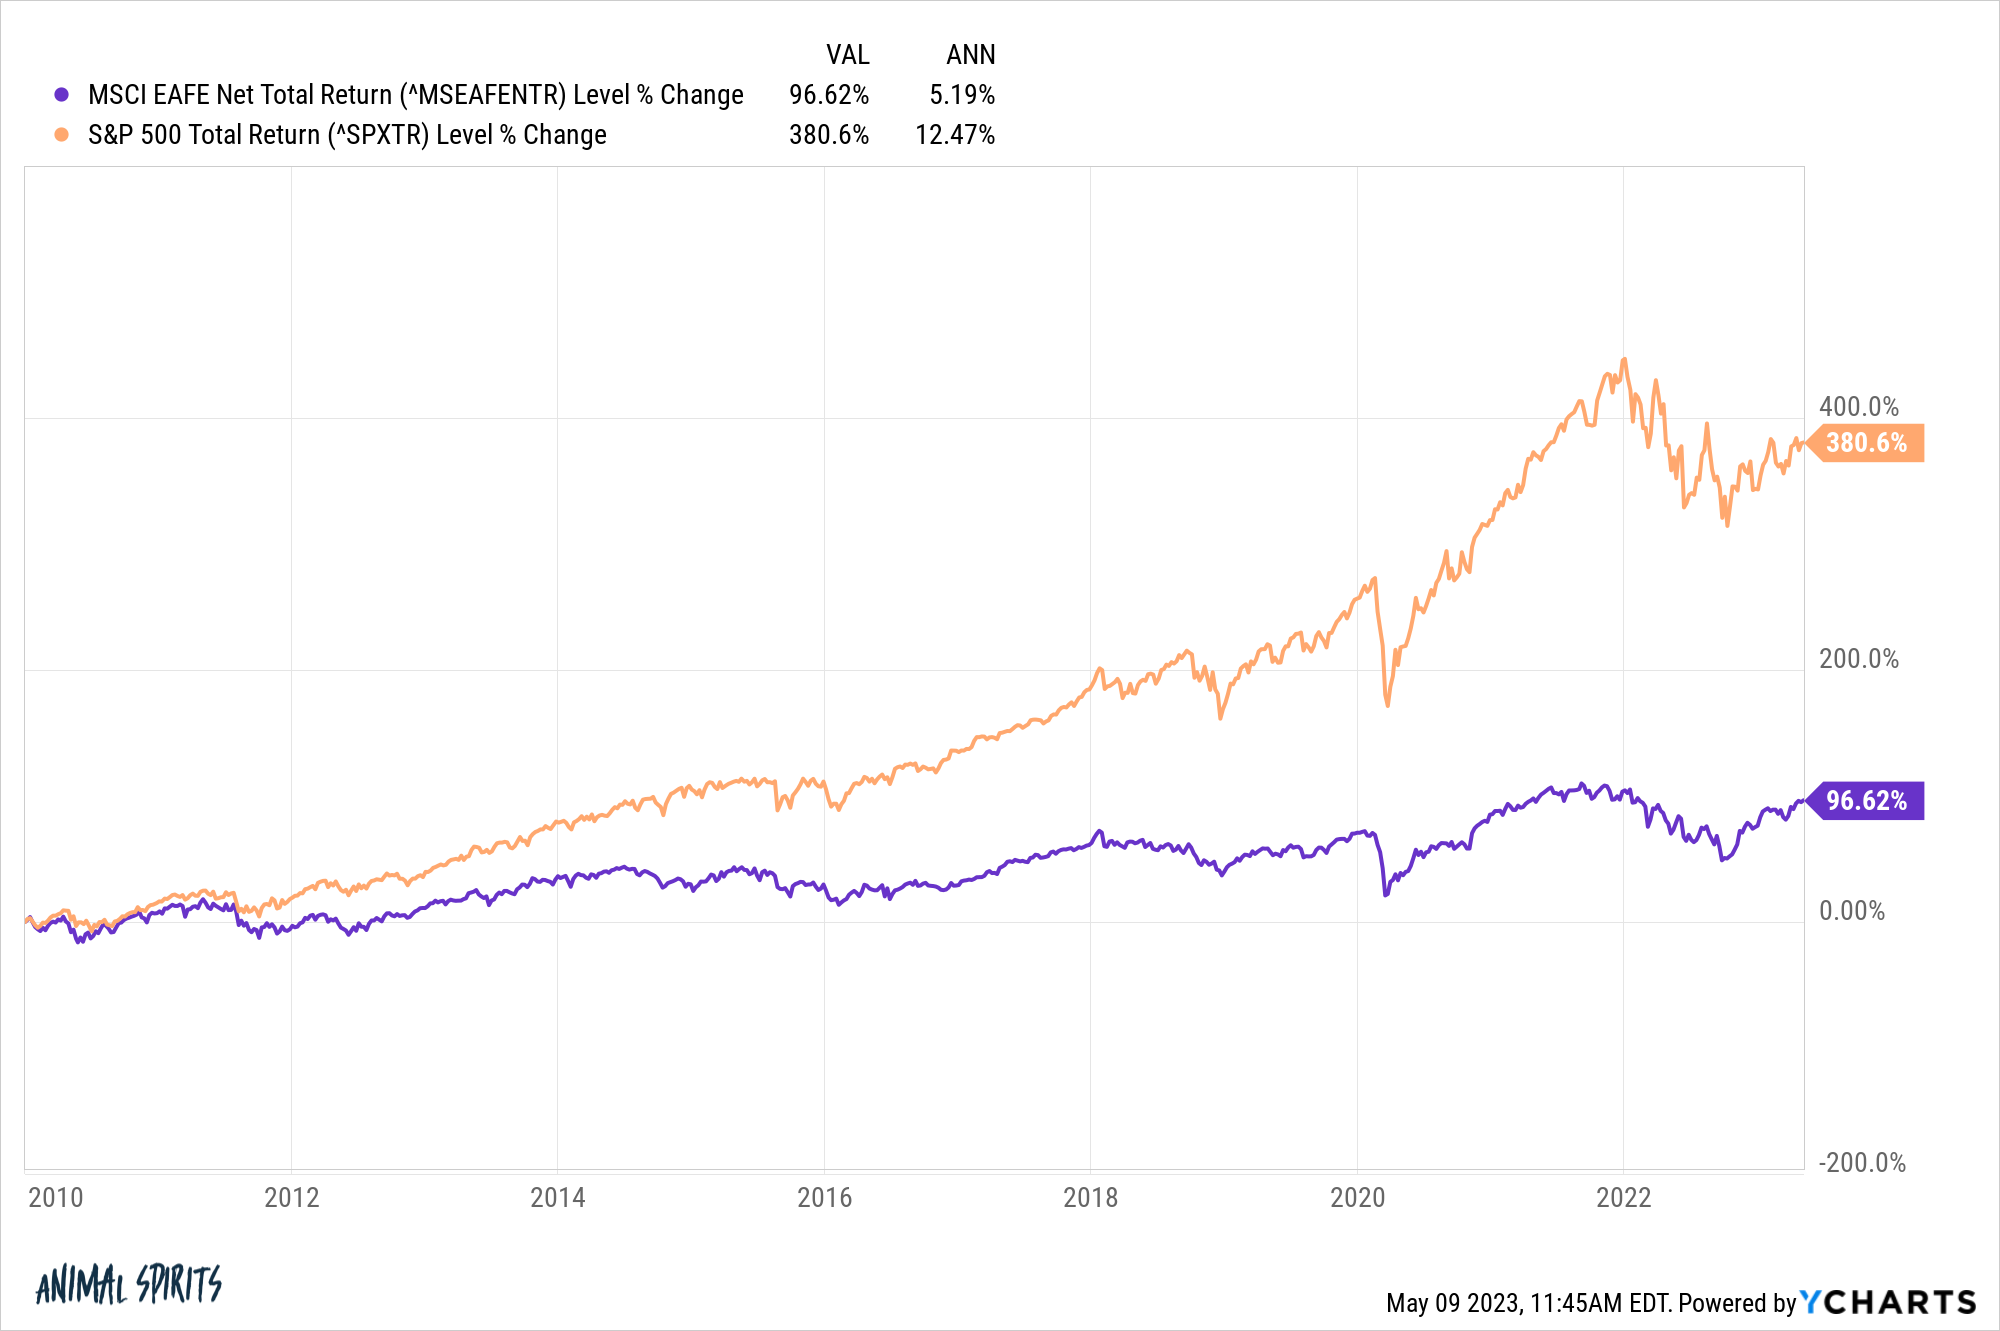
Many investors look at these numbers and wonder: What’s the point of owning international stocks if the U.S. is obviously the only game in town?
I understand the sentiment. The United States has the majority of the biggest and best companies in the world. Many of those corporations are multi-national and get a decent percentage of their revenue from overseas.
Having said that, it’s still worthwhile to consider international diversification over the long-run.
We have MSCI data for international stocks going back to 1970. Here are the annual returns for the S&P 500 and MSCI World ex-U.S. through April 2023:
- U.S. stocks +10.5%
- International stocks +9.1%
That’s a win for the stars-and-stripes but not a blowout by any means.
The win percentage isn’t that much better either. Over the past 53 years from 1970-2022, international stocks had higher returns than U.S. stocks 25 times. The U.S. stock market had better performance in 28 out of 53 years.
It seems like U.S. stocks always outperform but that’s recency bias at work. The performance is cyclical just like everything else in the markets.
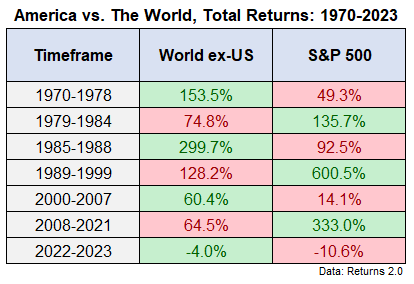
Here are total returns by various periods of over- or underperformance for each going back to 1970:
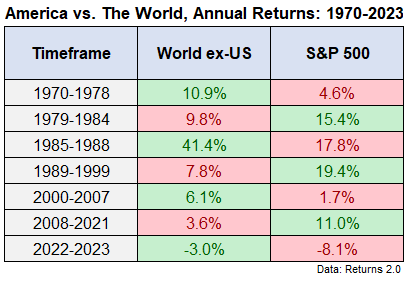
Some investors have an easier time wrapping their heads around annualized returns so here are those figures as well:
U.S. stock had an unbelievable run coming out of the Great Financial Crisis but international stocks did far better at times in the 1970s, 1980s and early-2000s.
It’s also true that much of the outperformance has taken place during the latest cycle. From 1970-2012, the annual returns were basically dead even:
- U.S. stocks +9.7%
- International stocks +9.6%
All of the outperformance has essentially come since 2013.
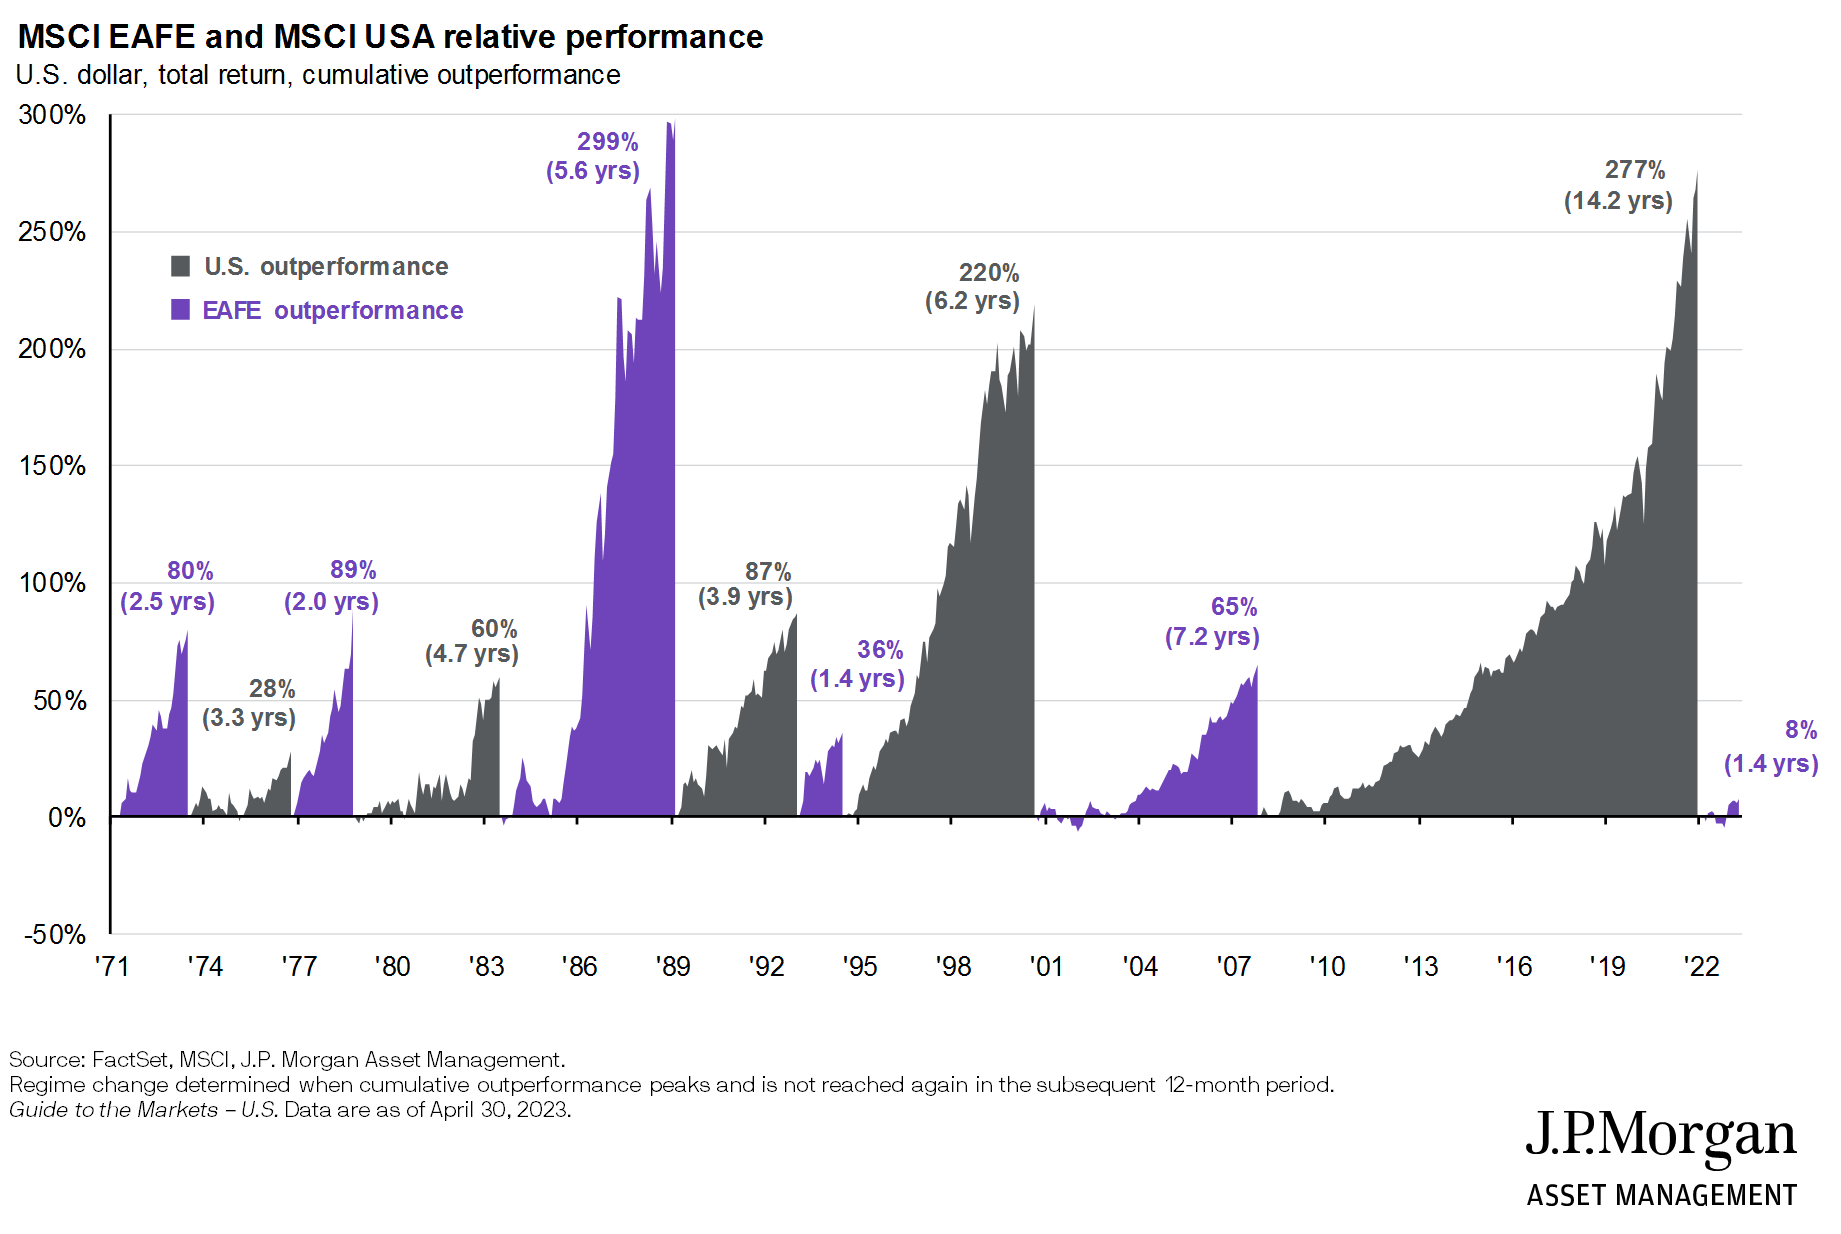
One thing that jumps out is the magnitude and length of outperformance by U.S. stocks since 1990 or so.
This JP Morgan chart does a nice job of visualizing the length of relative performance over time:
AQR just put out a new research piece that looks at the reasoning behind the relative strength of U.S. stocks over the past 30+ years:
Since 1990, the vast majority of the US’s outperformance versus the MSCI EAFE Index (currency hedged) of a whopping +4.6% per year, was due to changes in valuations. The culprit: In 1990, US equity valuations (using Shiller CAPE14) were about half that of EAFE; at the end of 2022, they were 1.5 times EAFE. Once you control for this tripling of relative valuations, the 4.6% return advantage falls to a statistically insignificant 1.2%.
Here is the visual representation of these words:
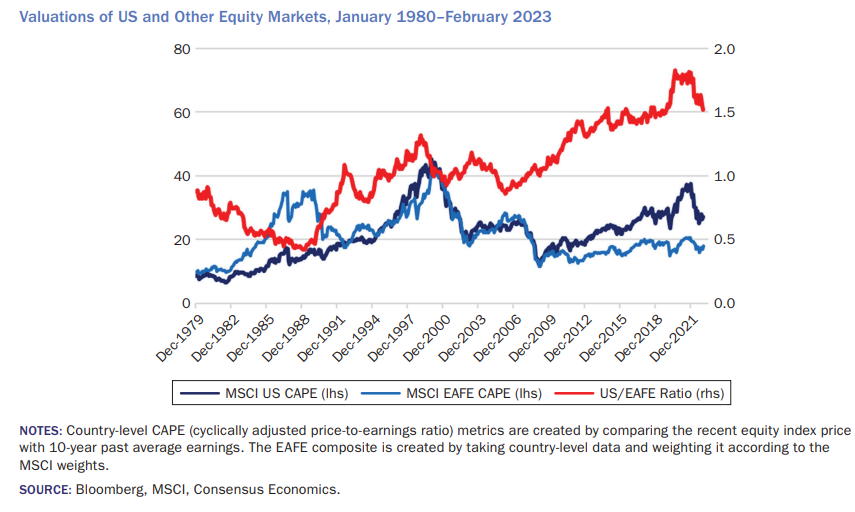
Basically, international stocks went from relatively expensive (hello Japan) to relatively cheap and U.S. stocks went from relatively cheap to relatively expensive.
Could this continue? Maybe.
Would I bet my life (or portfolio) on it? Probably not.
I like AQR’s conclusion on whether or not international diversification is still worth it despite the underperformance in recent decades:
International diversification is still worth it, even if it hasn’t delivered for US-based investors in 30 years. Most of the US equity outperformance during this period reflects richening relative valuations, hardly a reason for raising or even retaining US overweights today. If anything, historically wide relative valuations point the other way. Today is an unusually bad time to take the wrong lessons from the past. Unfortunately, rarely has doing the right thing been so hard (and it’s never easy).
Diversification is hard because you just know there is always going to be something in your portfolio that’s going to underperform. You just don’t know what that asset class or strategy it will be at any given time.
That’s a feature, not a bug of spreading your bets when it comes to portfolio management.
It’s certainly possible your portfolio would be fine over the long-haul investing exclusively in U.S. stocks from current levels.
But it’s also highly probable U.S. stocks will underperform international stocks, possibly for an extended period of time.
If you could predict the future there would be no reason to diversify but no one has the ability to know what comes next in the markets or global economy.
All investing involves trade-offs.
Diversification is about giving up on the ability to hit a grand slam so you don’t strike out at the plate.
Global diversification is about accepting good enough returns to avoid the potential for terrible returns at an inopportune time.
Further Reading:
Diversification Isn’t Undefeated But it Never Gets Blown Out

