Following yesterday’s bloodbath, the S&P 500 was down nearly 27% from all-time highs. It’s strange because somehow the carnage actually feels worse than that when compared to history’s other bear markets:
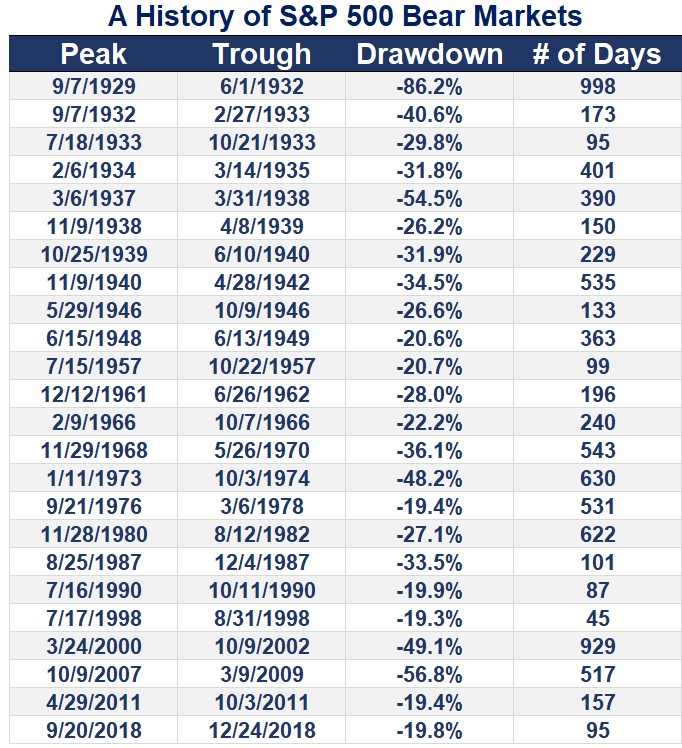
By my count there have been 24 bear markets since 1928, good enough for one every 3-4 years. The average fall from grace has been a 33% drop, lasting just shy of a year from peak-to-trough.
Obviously, the bear market you’re experiencing will never be average but the current iteration isn’t even in the top half of the worst bears in history. There have been 14 larger drawdowns throughout history. Certainly this one could still have some legs but that’s where we stand at the moment.
No one wants to hear this right now because we’re living in scary times but things will get better eventually. They’re likely to get worse before they get better, potentially much worse, but I have faith in our human spirit to continue moving forward.
The question is not only how bad can it get but how long will it take to make our money back?
Here’s how things look historically in terms of erasing the bear market drawdown completely:
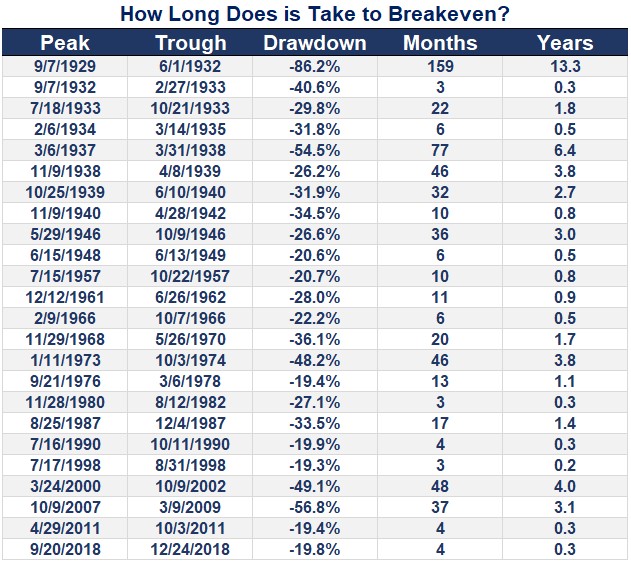
The Great Depression is obviously the worst offender in terms of how long it took to recoup losses.1 The longest breakeven in the modern era (which I consider the post-WWII time frame) was the aftermath of the dot-com crash, which took four years in total. Surprisingly, the recovery following the Great Recession took just 3.1 years.
The average breakeven since 1928 was 26 months or just over 2 years. In the modern era, the average was just shy of 17 months or around a year-and-a-half to get back to even. Half of all bear markets have seen breakevens lasting less than a year while one-third have taken 2 years or longer.
So investors could be waiting a while before being made whole from the prior peak. But there is a silver lining here if you look at these numbers a different way. The last column in this table shows the gains necessary to be made whole from these different loss levels:
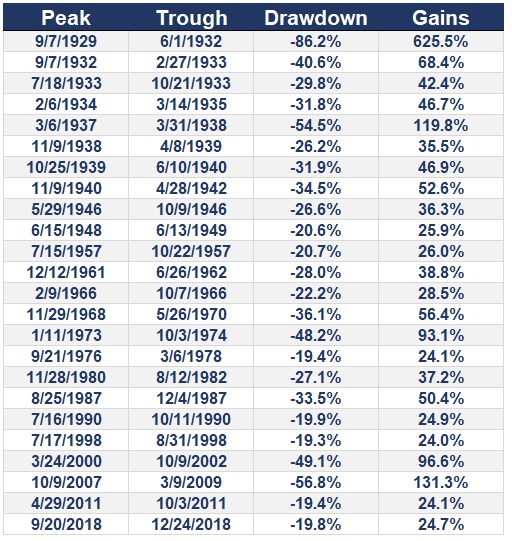
Some people may choose to look at these numbers negatively because it shows you need to earn larger percentage gains than the initial losses just to make your money back. I look at this data as an opportunity.
If it takes a number of months or potentially years to make your money back, that gives investors time to take advantage of higher expected returns. For those who are net savers, this means plenty of time to deploy capital at lower prices than we were being offered in recent months. For those with diversified portfolios who won’t be making new contributions, this means opportunities to slowly rebalance into the pain.
Here’s something I can say with 100% certainty — every bear market in the history of U.S. stocks has led to new all-time highs at some point in the future.
Is it possible this time is different?
Sure, anything is possible.2
I choose to believe things will be better in the future. People will still wake up in the morning looking to become better people and make something of themselves. Innovation is not going away nor is the human spirit.
Times are tough right now and stock market losses aren’t helping matters.
But we’ll get through this…eventually.
Further Reading:
The Relationship Between Recessions and Market Crashes
1I used total returns for my calculations here, which include dividends. From everything I’ve read, reinvesting dividends during the Great Depression was not an easy process but I wanted to keep things consistent here for comparison purposes.
2Please don’t say “what about Japan” to me right now. This is not that.
