Here’s a story about how difficult it is to predict markets in the short-term.
Earlier this year I was working on a piece for Bloomberg. I started pulling on a string with an idea in early January. Stocks were already up 4-5% on the year and that’s following 2017 which saw returns in excess of 20% with little-to-no volatility to speak of.
Seemingly everyone and their brother has predicted a crash during this bull markets but after the 2017 outlier, I wanted to explore the possibility of melt-up in the market. After some research, I turned this melt-up thesis to the editors on January 26. That date just so happened to coincide with the peak of the market just before a quick 10% correction in the S&P 500. The entire downturn happened in just 8 trading days.
It usually takes a few days for these pieces to see the light of day, so this piece was shelved, never to be heard from again. No one wants to read about the possibility of a melt-up during a correction when everyone is more worried about a bear market than a blowoff top.
Well, here we are 7 months later at all-time highs yet again. There have now been 17 new all-time highs in 2018, including 4 in a row over the past week that took the S&P 500 back over those January levels. That’s after 62 new all-time highs in 2017 and 18 in 2016.
I may be tempting the market gods here, but let’s revisit my melt-up research that never got off the ground. Let’s see if we can figure out what melt-ups may have looked like in the past.
I looked at all 12-month returns on the S&P 500 going back to 1926. To sort out dead cat bounces during a bear market, I used only those 12-month periods that occurred after already seeing gains for three years. This is important because a large majority of the biggest gains in the stock market occur following a crash or during a snapback rally in the midst of a bear market.
An extreme example of this occurred in during the Great Depression. Stocks fell in excess of 80% from late-1929 through the early summer of 1932. Then in July and August stocks posted back-to-back gains of more than 38% for a total return of more than 90%. Over the next six months, stocks would go on to fall an additional 30%.
These were the 10 biggest melt-ups in this group:
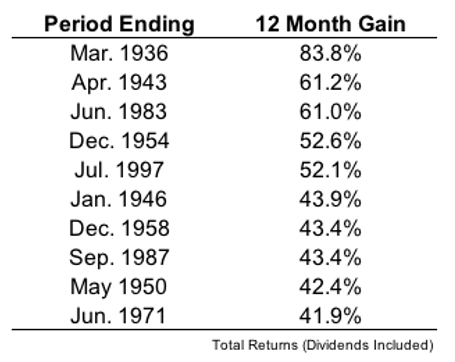
The interesting thing to note here is that only two of these melt-ups closely preceded a bear market. Stocks fell almost 27% starting in May of 1946 and more than 33% in the 1987 Black Monday crash. Otherwise, these weren’t so much blow-off tops as they were large gains in the midst of a bull market.
What most investors really care about is the gains before a market peak. In these terms, the blow-off top is really a misnomer when you look at the data. The following table shows the 12-month price gains in the S&P 500 before the end of each bull market since World War II:
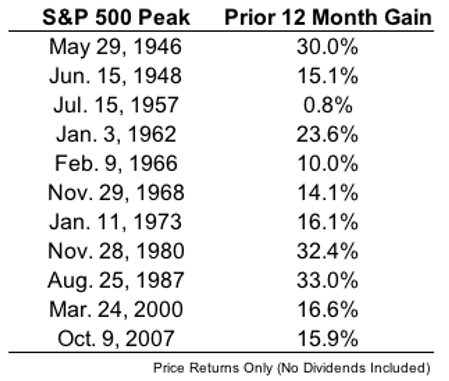
Along with the 1946 and 1987 periods already mentioned, there were also strong gains leading up to the 27% bear market of 1980. But the other periods shown here were fairly subdued in terms of the gains investors typically expect to see during a euphoric period.
If we look at all rolling one-year returns on the S&P 500 going back to 1926 and exclude the losses (so only looking at the 12-month gains), the average gain is roughly 21%. So the gains going into the past 11 market peaks haven’t been that far out of the ordinary.
This is because market tops are more of a process than an event. Market crashes can happen fast and indeed the Great Depression and Black Monday crash of 1987 are perfect examples of this. But this rarely works in the opposite direction as markets usually grind higher as opposed to experiencing gains in huge chunks.
And the psychology of a market top is much different, as well. Market tops almost lull investors to sleep and usually don’t have an event or piece of news that triggers them. It’s often just that the number of enthusiastic buyers has been exhausted. There are typically very few stocks or sectors that are propping up the markets and few names hitting 52-week highs.
Even if these characteristics don’t hold, I still think it’s a fool’s errand to try your hand at predicting market tops because no one knows what will spook investors and cause them to panic. Investors have had plenty of opportunities and excuses to sell out of stocks in recent years but haven’t taken the bait.
Recessions are probably your best bet but there are plenty of corrections and bear markets outside of recessions, as well.
Eventually, that elusive sell-off will occur but if history is any guide, investors shouldn’t expect to see enormous gains before we get there. The biggest gains typically come during or after bear markets or in the initial stages of a new bull market, not a blow-off top in the late stages of the bull.
And if this piece turns out to be the peak before another correction or an actual bear market, please buy my new market timing newsletter.
Further Reading:
The Anatomy of Market Tops
