In the depths of the stock market crash in March, the S&P 500 had fallen nearly 34% from all-time highs in about 4 weeks.
At that point the year to date return for the S&P was a loss of more than 30%. As of the close of the market on Wednesday, it’s now up more than 12%.
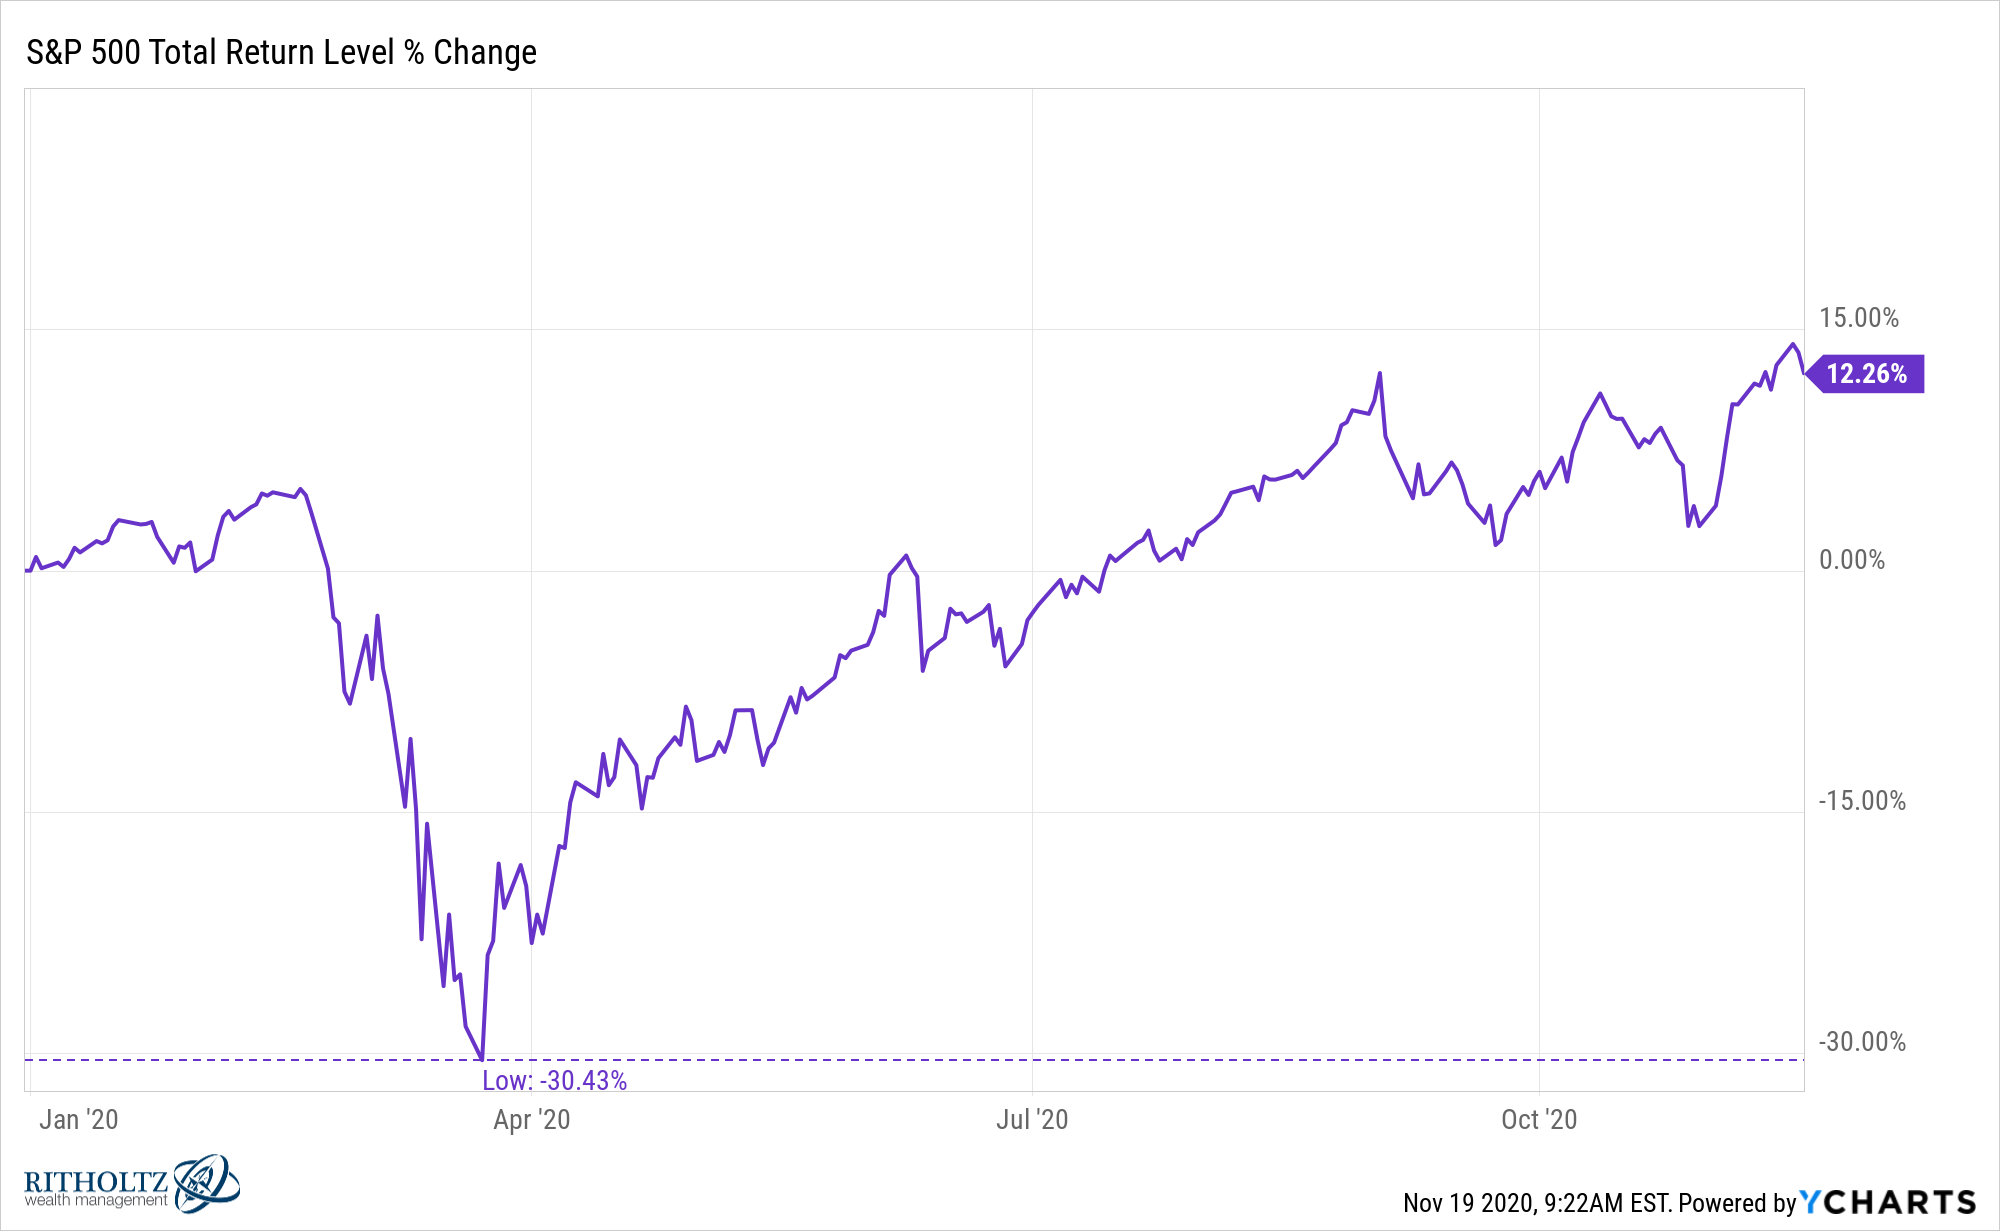
There are still 6 weeks or so left in the year but as of this moment the massive swing from huge losses to a gain will likely go down as the biggest stock market reversal in history.
I looked back at the intra-year losses for the S&P 500 from 1928 through 2020. Here are those intra-year losses paired with how the stock market finished the year:
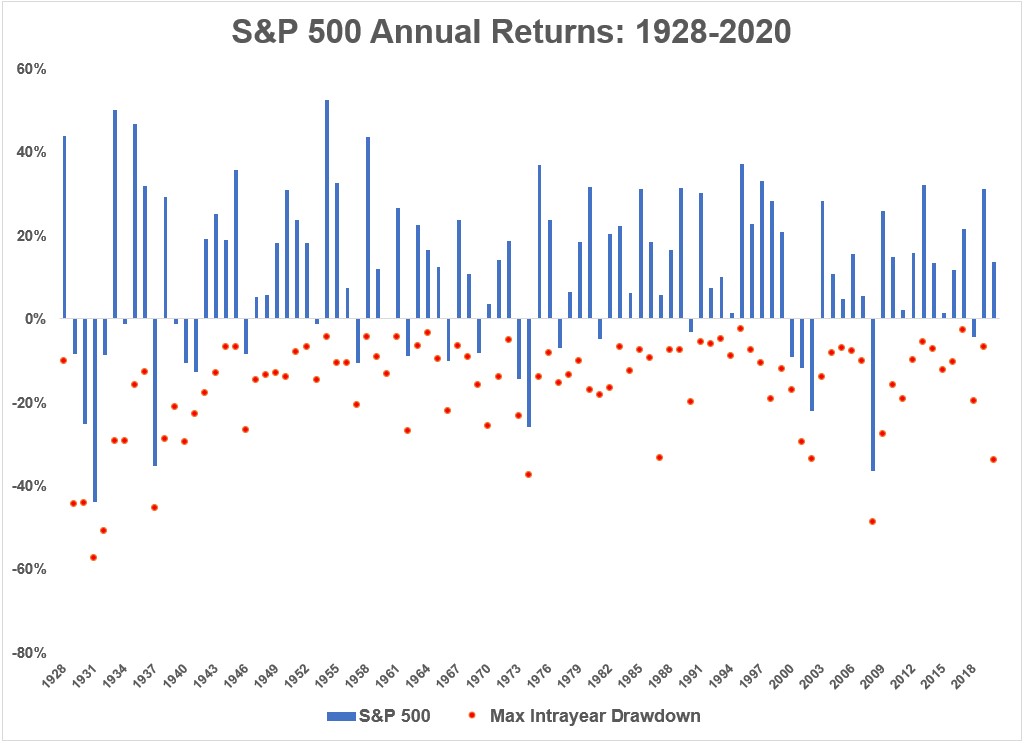
Every year there is a peak-to-trough loss, some bigger than others.
Over this 93 year period, the average drawdown in a given year has been roughly 17%.
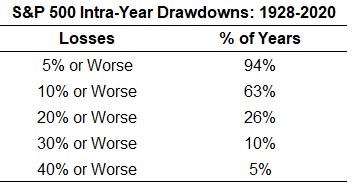
Since 1928, the stock market has seen 5% losses almost every year, 10% losses 3 out of every 5 years, 20% losses 1 out of every 4 years, 30% losses 1 out of every 10 years and 40% losses 1 out of every 20 years.
The majority of the worst losses took place in the 1930s. In fact, there was a double-digit drawdown every single year from 1928-1943 and 11 out of those 16 years experienced losses in excess of 20%.1 So there was a bear market in 70% of all years in that time.
Here are all of the worst intra-year drawdowns along with the corresponding total returns at year end:
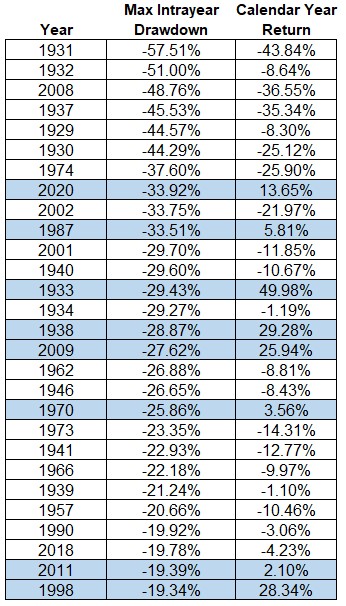
The only other time in history when the S&P 500 finished with a positive return in the same year it also saw a drawdown of 30% or worse was in 1987.
Even with the Black Monday crash, stocks finished that year with a gain of more than 5%. But that had more to do with the fact that the market was up 40% on the year before the worst one-day crash in market history.
1933, 1938 and 2009 all experienced large losses while finished with substantial gains.
But 2020 looks like it could go down in history as the worst intra-year drawdown that finished the year with a positive return. And the fact that those gains are now in double-digit territory is not something many (any?) people saw coming. The S&P is now up well over 60% since bottoming in late-March.
Although the 2020 stock market is something of an outlier, it’s not out of the ordinary for stocks to see gains on the year despite large losses on the way to those gains.
In the 59 years the stock market has experienced intra-year losses of 10% or worse since 1928, the final year-end returns have been positive almost 60% of the time. And close to 40% of the time the market has been up by 10% or more in a year with a loss in excess of 10%.
The stock market can look like a raging lunatic in the short-term but that doesn’t mean you have to invest like a raging lunatic as well.
Sitting on your hands and not panicking, even when stocks are down big, remains one of the best investment strategies on the planet.
Further Reading:
Explaining The 2020 Stock Market
1The longest streak without a double-digit intra-year drawdown was from 1992-1996. Not a single 10% correction in a calendar year.

