Understanding the U.S. stock market in 2020 is fairly easy — the bigger, more expensive companies are performing better than the smaller less expensive companies. That’s it.
There are 505 companies in the S&P 500 with a combined market cap of roughly $29 trillion. As of Monday around noon est, the index is down 0.7% for the year. Considering the market was down 34% at the lows in March, this is a decent place to be.
But the performance of the individual components of the market is all over the map and the borders for that map can be drawn neatly by company size. Here’s a look at the S&P 500 broken down by market cap showing the median size, price-to-earnings, prices-to-sales, price-to-cash flow, price-to-book value and year-to-date returns as of the close on Friday:
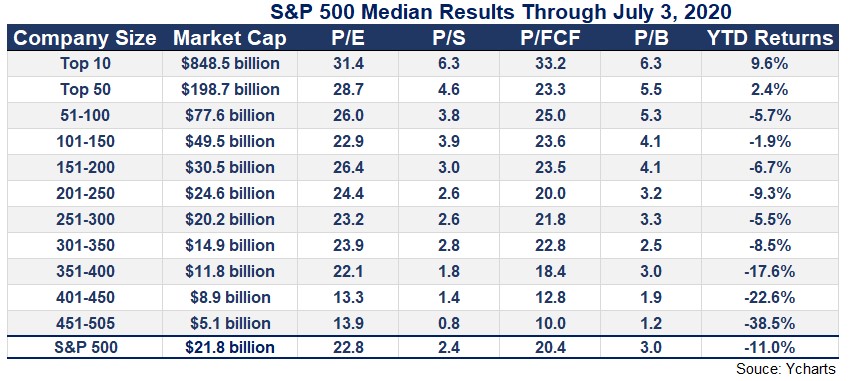
There is a clear pattern at work here. The biggest companies by market cap are the most expensive by traditional valuation metrics and they also have the best returns this year.
The smallest companies by market cap are the least expensive by traditional valuation metrics and they also have the worst returns this year.
The market doesn’t always line up so perfectly by size but this year’s performance attribution is crystal clear.
Considering the median stock in the index is down 11% on the year, the fact that the market is more or less flat can be explained exclusively by the biggest companies holding the highest weights in the S&P. The top 50 (and really the top 10) stocks have more than made up for the larger median losses in the rest of the market.
There are two ways to look at this data:
(1) The S&P 500 is so top-heavy that once these stocks falter, look out below.
(2) This is the nature of a market-cap weighted index where the winners carry the day without having to pick them in advance.
In a recent outlook piece, Morgan Stanley shared a graph that perfectly illustrates the beauty of an indexed approach to investing:
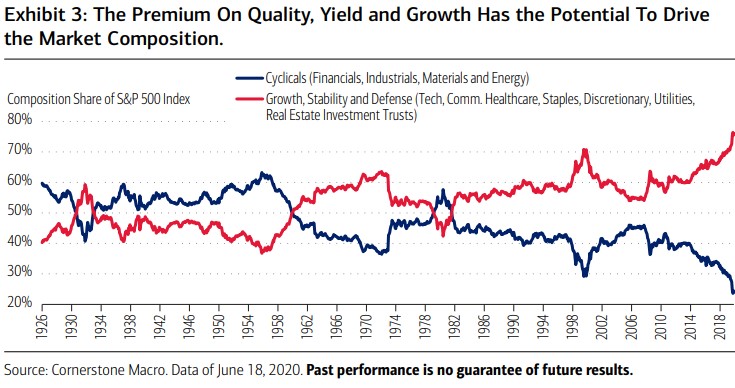
Cyclical stocks had their day in the 1940s, 1950s and early 1980s but the market is now dominated by growth, stability and defense stocks. Cyclicals are now at their lowest weighting in the index on record.
If you invested in a simple S&P 500 index fund you didn’t have to predict this sea change in advance. You didn’t have to make a bet on certain stocks, industries or sectors. The winner-takes-all nature of the S&P 500 itself did this for you.
The same is true of the larger stocks outperforming in 2020. There were no tilts involved to benefit from these moves. No research or financial statement analysis or reading through quarterly earnings transcripts. The market does all that for you.
Market cap weighted investing is far from perfect and doesn’t diversify investors from every risk out there. But it remains one of the hardest investment strategies to beat because of its very nature.
Index funds are nothing special. They’re simply low-cost, low-turnover, tax-efficient and rules-based.
The market remains very hard to beat.

