Ryan Detrick shared a stat last week that should put stock market investors at ease with the recent rally:
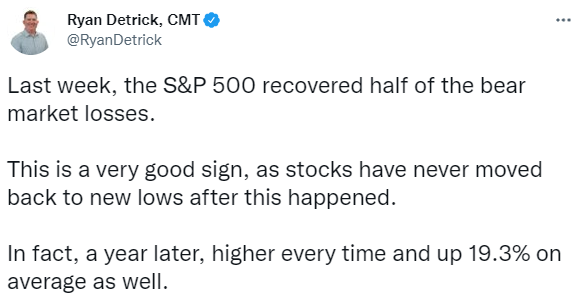
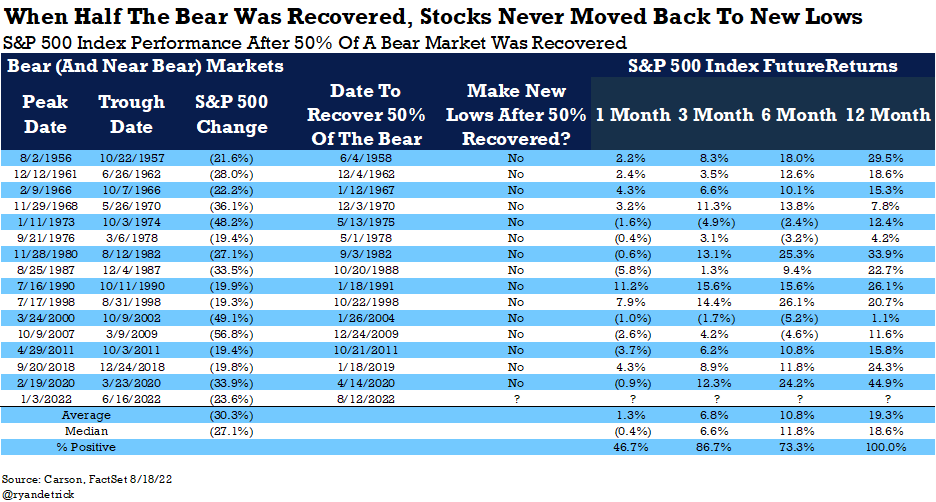
Here is Ryan’s data to back this up:
And the chart:
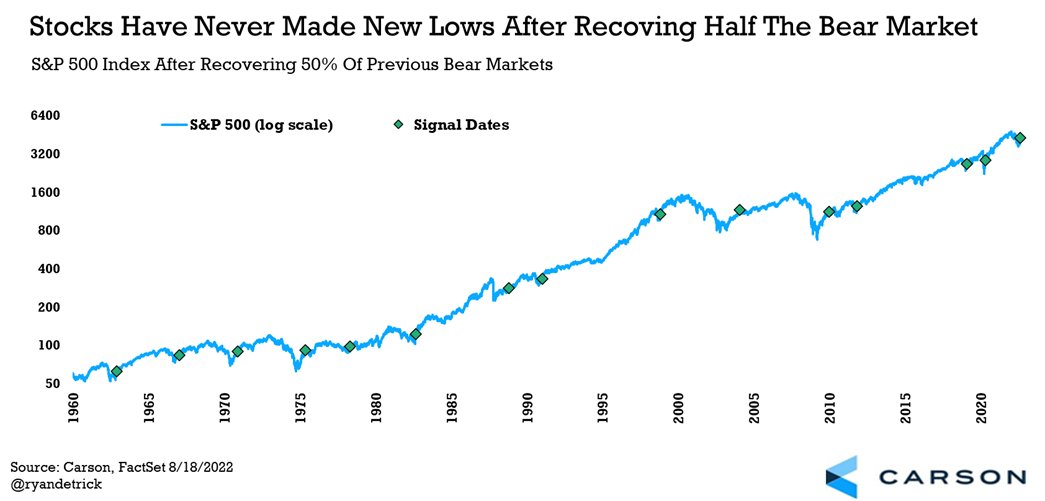
This sounds pretty good to me and it makes sense intuitively.
Bear market rallies are a common occurrence but not to this degree.
So are we out of the woods?
Maybe?
The problem is that although it appears we have skirted a recession for the time being, it’s hard to completely take an economic contraction off the table in the coming months or years.
High inflation is a problem that seems like it can only be corrected by a recession.
I wrote about this in March when the energy crisis went into full swing:
Inflationary spikes don’t cause every recession but every inflationary spike has only been alleviated by a recession.
On the following chart I’ve highlighted every instance since 1940 that the U.S. has experienced an inflationary spike of 5% or more:
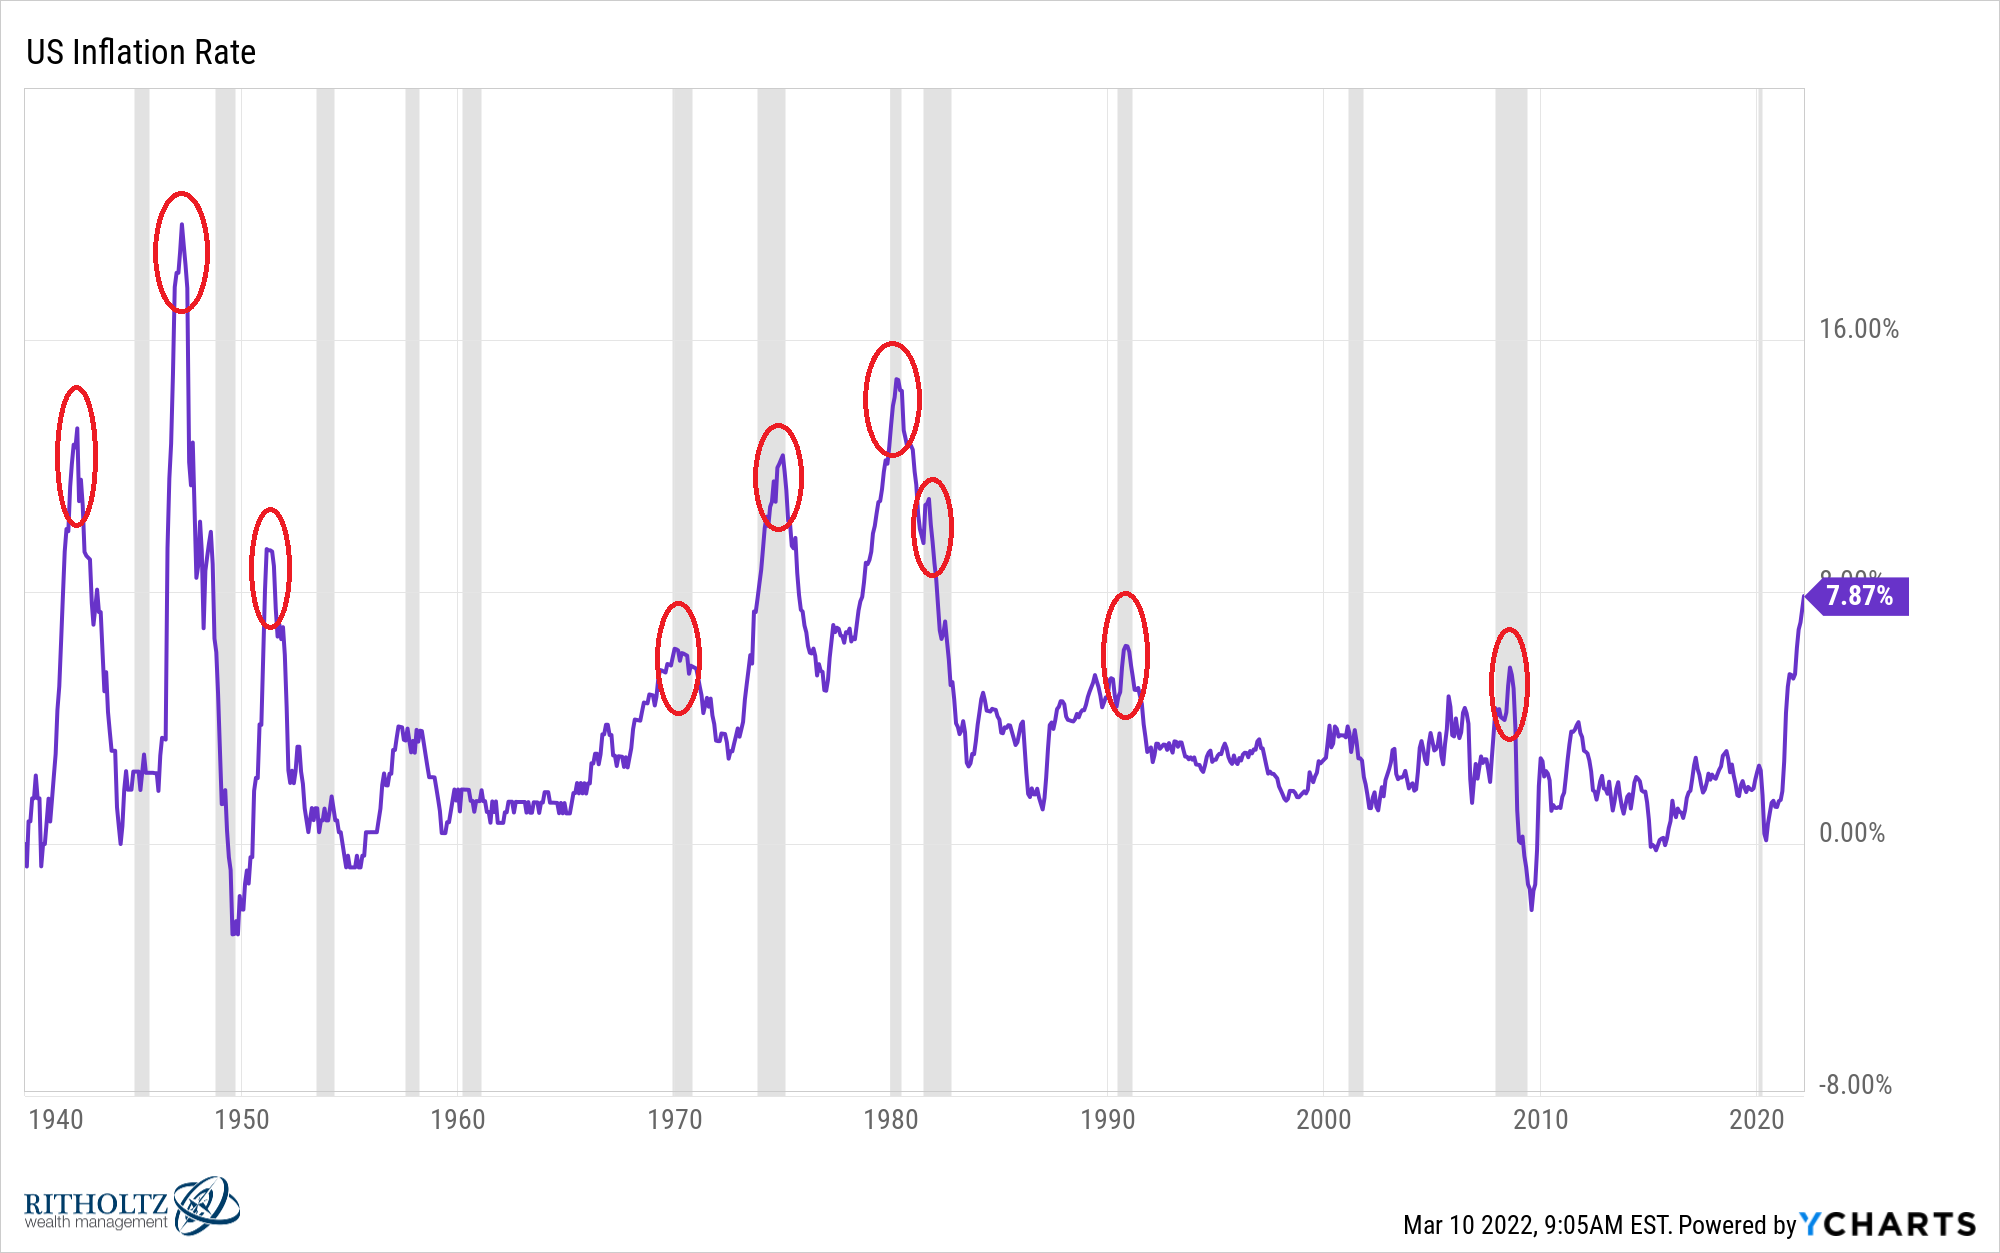
Here are the numbers:
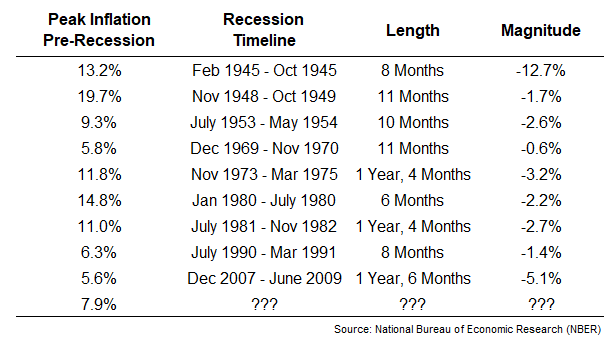
This sounds pretty bad to me. Recessions aren’t great and it is difficult to see how inflation comes in without a commensurate slowdown in the economy.
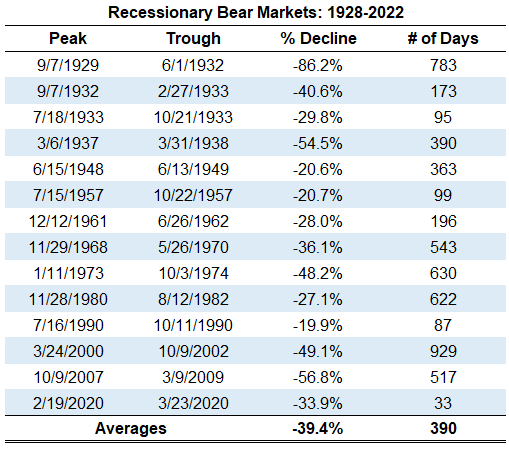
Maybe the stock market has already moved on but it’s hard to see the economy go into a recession without re-testing the lows in the stock market. Recessionary bear markets usually don’t go very well:
So we have an old-fashioned data-off.
Either the stock market is getting ahead of itself or we’re going to see a soft landing from 9% inflation for the first time in history. Or both things will happen or neither.
We have so much market and economic data these days that there are probably dozens of other rules that are in conflict with one another right now.
There are no iron-clad rules when it comes to this stuff. ‘Always’ and ‘never’ have no place in the world of finance where rules are made to be broken. There are always exceptions.
It’s also the case that our knowledge of this data by itself could cause weird outcomes in the market.
In the past, data was hard to come by so no one had any idea about stats like this to set their baselines.
Louis Engel was an executive from Merrill Lynch who created the first advertisement for a modern investment firm in 1948. It ran in the New York Times and went into great detail about how to buy and sell stocks and bonds, something that was not so easy to do at the time.
The ad was a smashing success. Millions of people responded which gave their “thundering herd” of brokers plenty of prospective clients.
More than a decade later, Engel wanted to double down on the success of that first ad by dispensing information about the long-term benefits of investing in the stock market.
Many investors were still scarred by the stock market crash during the Great Depression. Most individuals preferred the safety of bonds and actually assumed fixed income outperformed equities over the long haul.
The problem is no one could really prove conclusively what the long-term returns were in the stock market.
Data was scarce on things like dividends, mergers, spin-offs and bankruptcies so you couldn’t simply look up the long-term returns on the overall stock market like you can today.
In his book, Trillions, by Robin Wigglesworth explains the pains Engel went through to make this happen:
But when Engel in 1960 wanted to run an ad arguing explicitly that stocks were a good investment for ordinary people, it was nixed by the Securities and Exchange Commission. Wall Street’s financial watchdog argued that he needed evidence to make that claim.
So Engel called up his alma mater, the University of Chicago, to find out if anyone could conclusively and empirically answer the question of what stocks really returned in the long run. Merrill Lynch granted $50,000 to James Lorie, the associate dean of Chicago’s business school, who in March 1960 set up the Center for Research in Security Prices (CRSP) in Chicago to collect the necessary data. Initially he hoped to have a definitive answer within a year. “We spent $ 250,000 and took four years,” he later joked.
It took until 1964 to put together the returns from 1926-1960. The data surprised a lot of people.
From 1926-1960, the U.S. stock market was up more than 10% per year. Even if you measured performance from the peak of the market in September of 1929 before the Great Depression crash that saw stocks fall more than 80%, you would have earned roughly 8% per year through 1960.
Stocks were indeed the long-term winner over bonds.
It’s hard to believe how many investors were more or less flying blind back in the day. People take for granted the sheer amount of information investors have available at their fingertips today.
That information can be helpful in terms of setting expectations and baselines. But you can’t use historical data to predict the future with 100% certainty.
Things that have never happened before happen all the time in the markets.
Further Reading:
The First Modern Investing Advertisement

