A reader asks:
So I know you guys have talked a lot about are we in a recession now and being in a bear market (equities declining 20%). When is a bear market by definition over? For instance if we just trade flat for the next year and then do enter a recession does this correction still count as part of that?
The short answer is, yes, if we don’t reach all-time highs and rollover again at some point in the coming months people will lump it all in as one bear market.
Just look at all of the dead cat bounces during the 2000-2002 bear market:
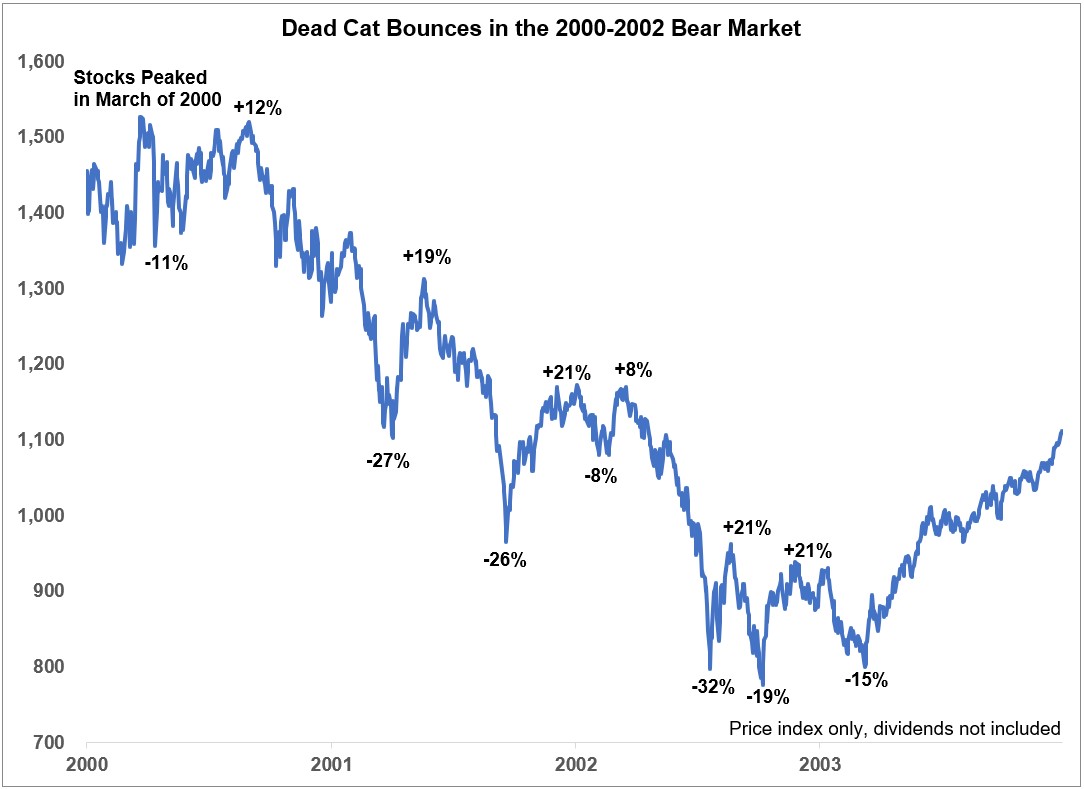
The stock market got cut in half but it wasn’t a straight line down. There were many corrections and rallies within the broader bear market.
Like many things in the market, there aren’t any hard and fast rules for this kind of thing, especially in real-time.
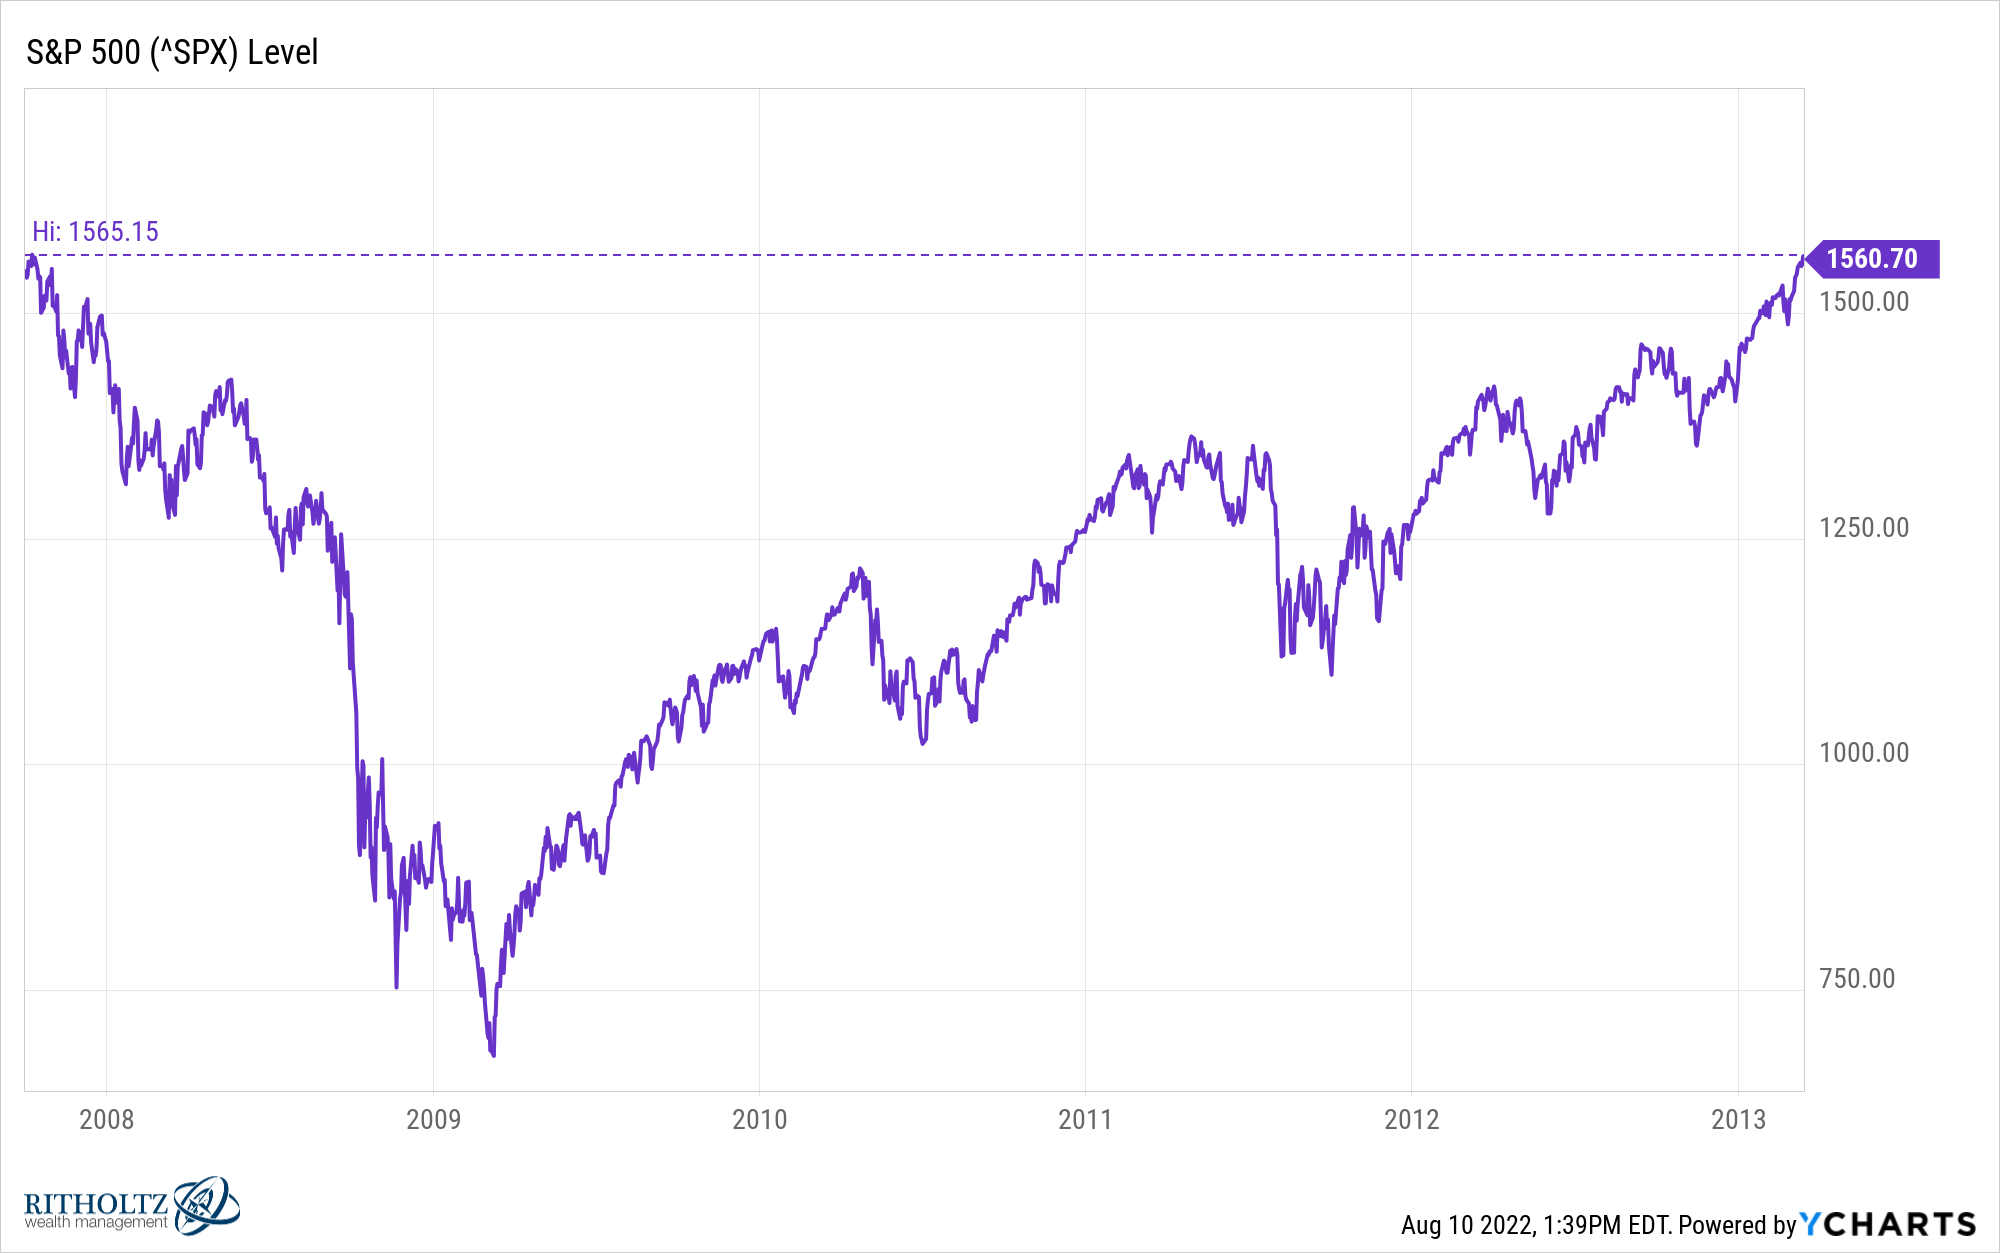
Let’s look at the 2008 scenario as an example. The S&P 500 topped out in early October 2007 and bottomed in March 2009.
On a price-only basis, the index didn’t reach those 2007 highs again until March 2013:
So did the bear market last from peak to peak? Peak-to-trough?
From the bottom, the stock market was up 150% if we include dividends:
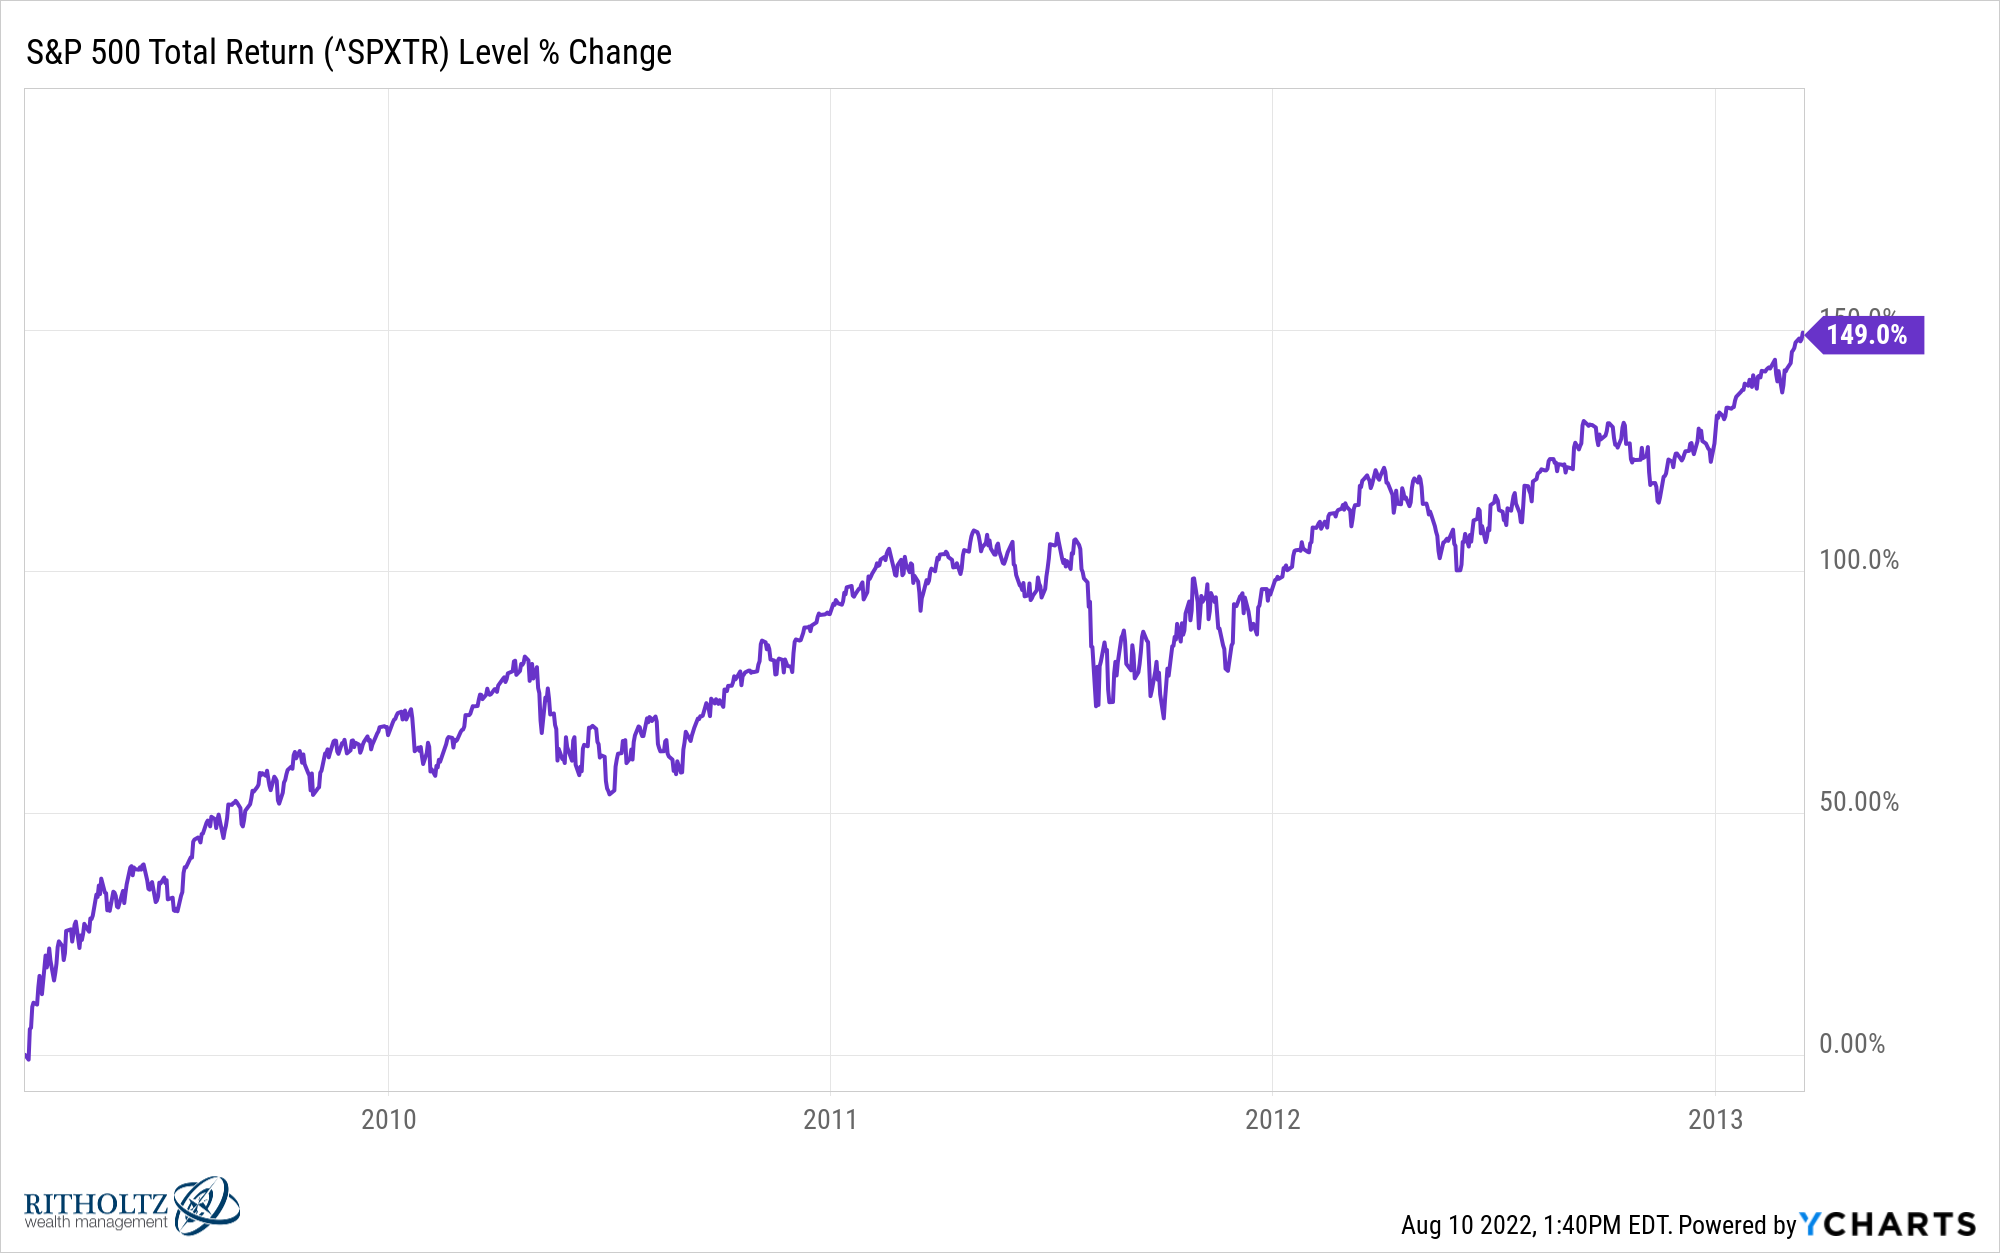
So maybe the bear market was officially over at the bottom?
It certainly didn’t feel like we got an all-clear considering there were two scary corrections in 2010 and 2011.
Most market people believe there was a bull market from 1982-2000. It was one of the greatest bull markets of all-time.
But I’m sure a lot of people assumed it was over during the 1987 crash when stocks fell more than 20% in a single day and 30% in a week.
The problem is we have cyclical bulls, cyclical bears, secular bulls and secular bears. They vary in length and magnitude so there are no all-clears when you’re in it.
Yardeni Research has these really cool bull and bear market tables that go back to the late-1920s.
This first table shows corrections and bear markets all the way back to 1928:
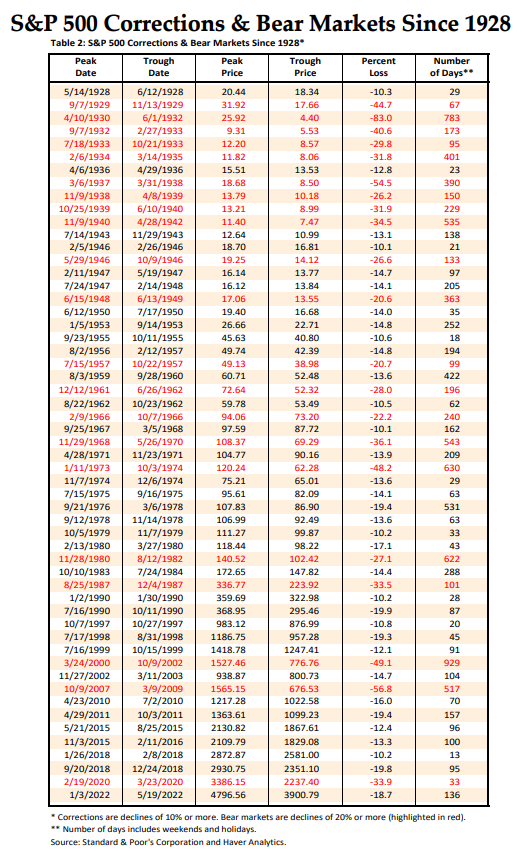
Corrections are defined as losses of 10% or more while bear markets are downturns of 20% or worse.
There have been A LOT of these.
By my count there have been 34 corrections and 21 bear markets in this time. That’s 55 downturns in total.
How about bull markets?
Yardeni defines a bull market as gains of over 20% from the bottom of a bear market:
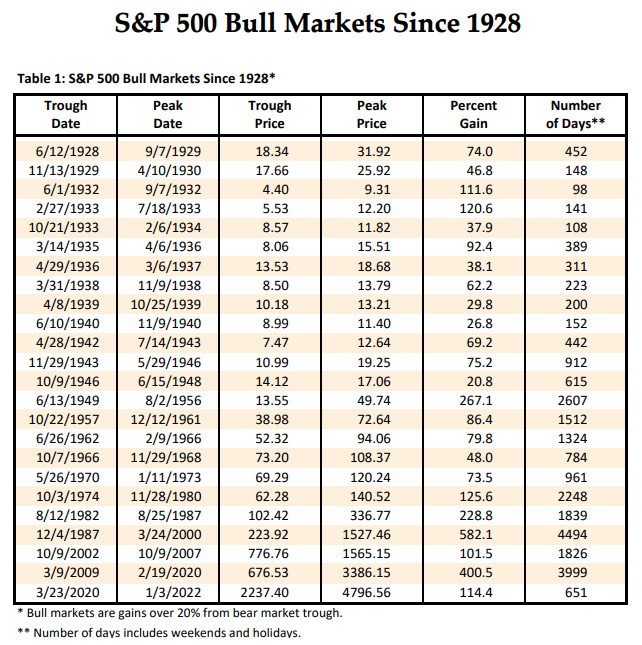
There have been far fewer bull markets than corrections or bear markets over time. But those bull markets tend to last much longer and the gains more than outweigh the losses over time.
This is the beauty of investing in the stock market — losses are baked into the long-term returns.
A lot of this feels like semantics. It’s like arguing about the definition of a recession or inflation — does it really matter?
Probably not that much if you’re a long-term investor who expects gains, losses, corrections, crashes, volatility and everything in-between.
However, understanding the difference between uptrends and downtrends can be helpful in terms of situational awareness.
Uptrends are slow and methodical. Gains don’t come in big chunks but rather a stairstep process. Uptrends almost lull investors to sleep because there isn’t much going on in terms of volatility.
Downtrends, on the other hand, are erratic. Returns are lumpy as both gains and losses take the elevator up and down. Downtrends pave the way for a broader set of outcomes, and now always in a good way as panic is not a helpful emotion when making investment decisions.
For example, by my count there have been around 350 trading days since 1928 when the U.S. stock market was down 3% or worse. There have also been nearly 290 days when it was up 3% or more in a single day.
Considering moves of this magnitude have occurred in less than 3% of all trading days, that would be considered high on the volatility scale in my book.
Here’s the kicker — more than 90% of all up and down 3% days have taken place during a correction of 10% or worse. And 83% of those up and down 3% trading sessions took place during a bear market drawdown (down 20% or worse).
Bad stuff happens in bad markets.
This seems like such an obvious statement that it goes without saying. But it’s an important reminder that the biggest down days and the biggest up days tend to take place during market downtrends.
So is the current bear market over? Was that the bottom?
I don’t know. I’m not smart enough to answer that question. The S&P 500 has now made back more than half of its losses:
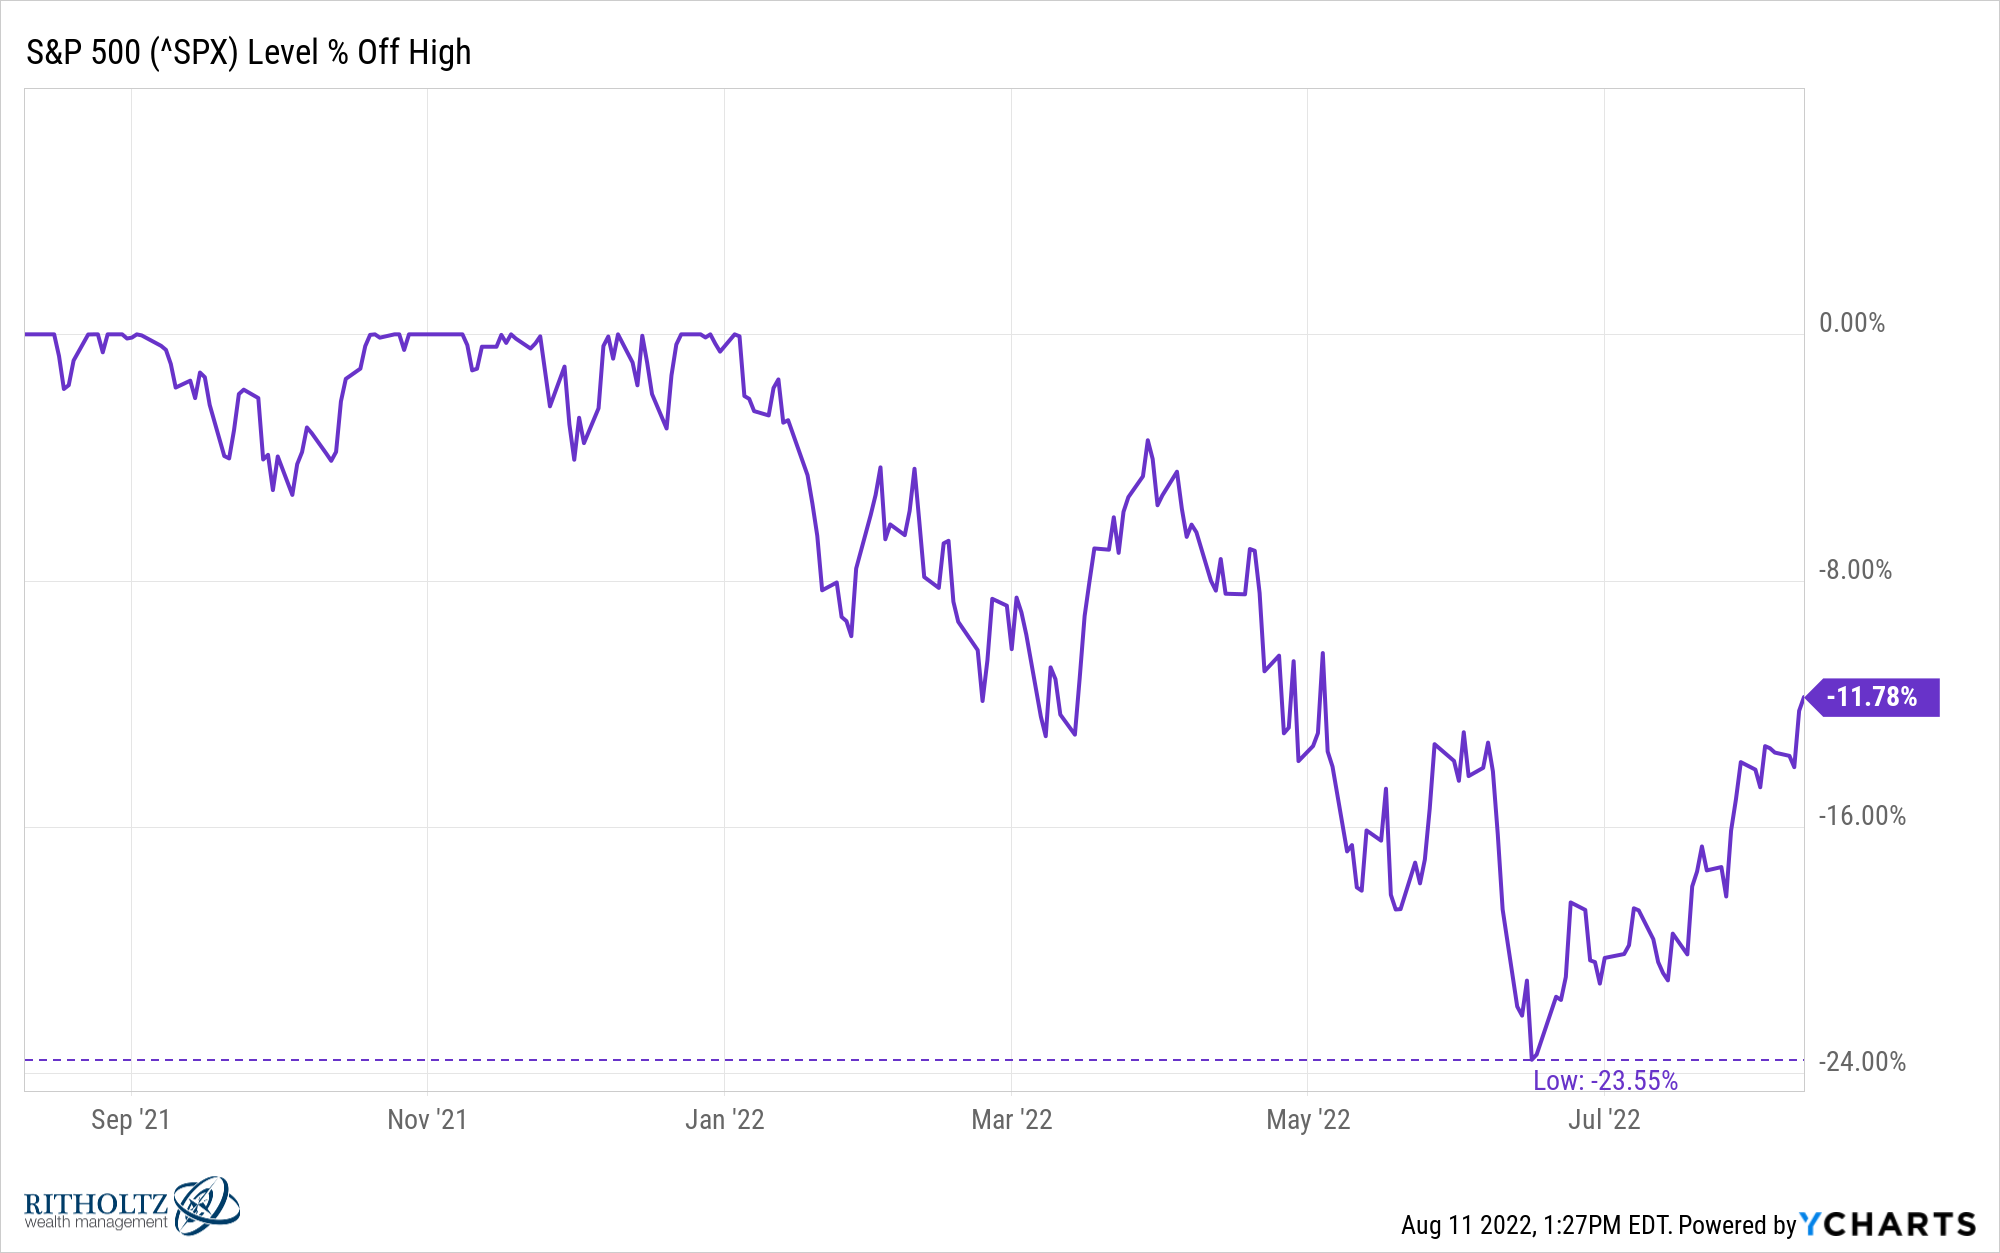
It’s possible that was it.
Unfortunately, this is the kind of thing that can only be known with certainty in the rearview mirror.
We talked about this question on this week’s Portfolio Rescue:
Further Reading:
A Short History of Dead Cat Bounces
And here’s the podcast version of the show:

