After falling more than 4% the previous Friday and nearly 3% last Monday, the S&P 500 closed at a drawdown of almost 34% from all-time highs.
Things were looking bleak for the market but then a funny thing happened — it finally started going up…in a hurry.
A 9.4% gain on Tuesday was followed by a 1.2% increase on Wednesday and a 6.2% advance on Thursday, good enough for a 3-day surge of 17.6%.
There was a chorus of market prognosticators who reminded us that stocks don’t tend to bottom on runs like this. In fact, this type of burst has all the makings of a dreaded dead cat bounce.
The advance was blamed on a short-covering rally or algorithms or rebalancing or Joe Exotic’s heavenly mullet.
No one really knows why stocks jumped so much so fact but the 3.4% decline on Friday makes it seem like the dead cat bounce crowd may be right. It’s quite possible this is a temporary relief rally within a broader bear market that isn’t over just yet.
This type of move has precedent.
Many of history’s great crashes have exhibited head-fake rallies that offered investors a false sense of hope that proved to be fleeting.
During the Great Depression stock market crash there was a 47% rally from late-1929 until the early Spring of 1930. It didn’t last of course.
Before that rally stocks had fallen 45%. After rising almost 50%, they would go on to fall by more than 80%.
Ouch.
That crash also included monthly gains of 8%, 9%, 12% and 14% before all was said and done along with rallies of 23%, 27% and 35%. I can’t imagine the amount of false hope each of these rallies must have given investors. Talk about a soul-crushing crash.
The nasty 1973-1974 bear market that cut the market in half saw a 20% bounce before it was over.
Even the 2007-2009 market crash gave us a gain of more than 25% that was eventually relinquished.
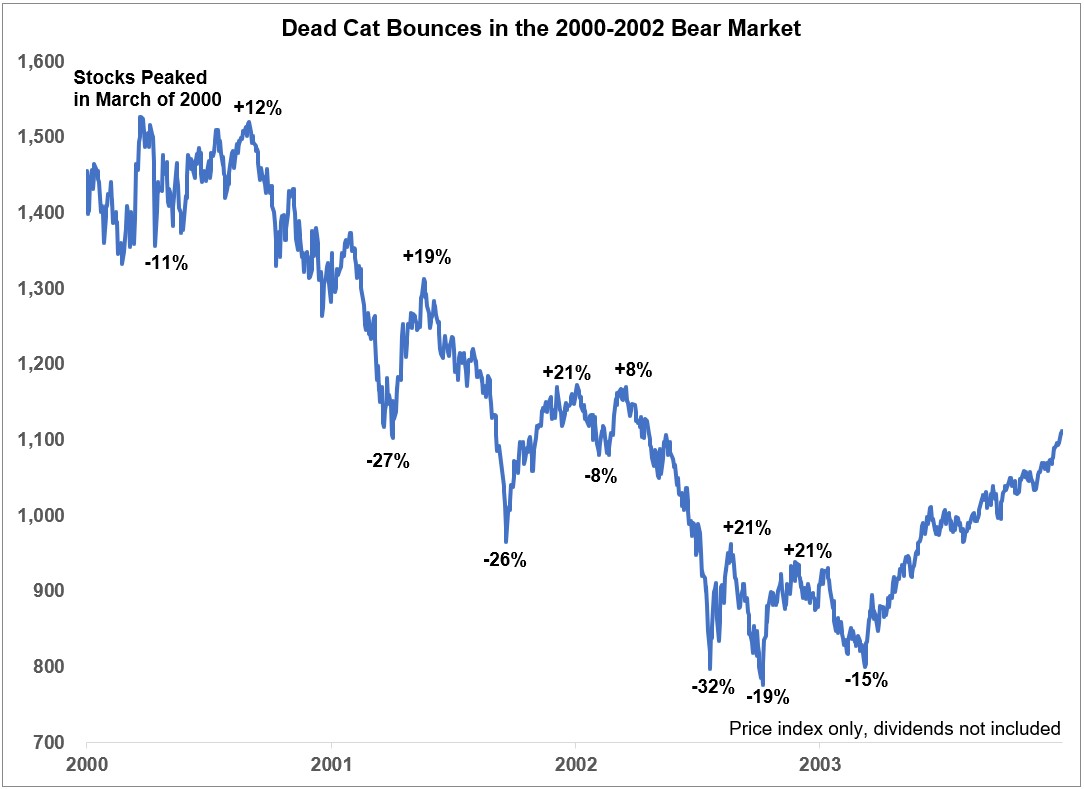
The bear market from 2000-2002 saw three separate rallies of around 20% before finally settling in at a bottom more than 50% lower than the peak.
On a spreadsheet, it often looks like market crashes are a straight line down but that’s typically not the case:

The Great Depression is always the worst-case scenario but the dot-com crash may be second on that list. It included not only the bursting of the tech bubble but also the Enron scandal and 9/11.
Even after bottoming in October of 2002 and quickly rising more than 20%, there was yet another 15% decline before finally taking off until 2007.
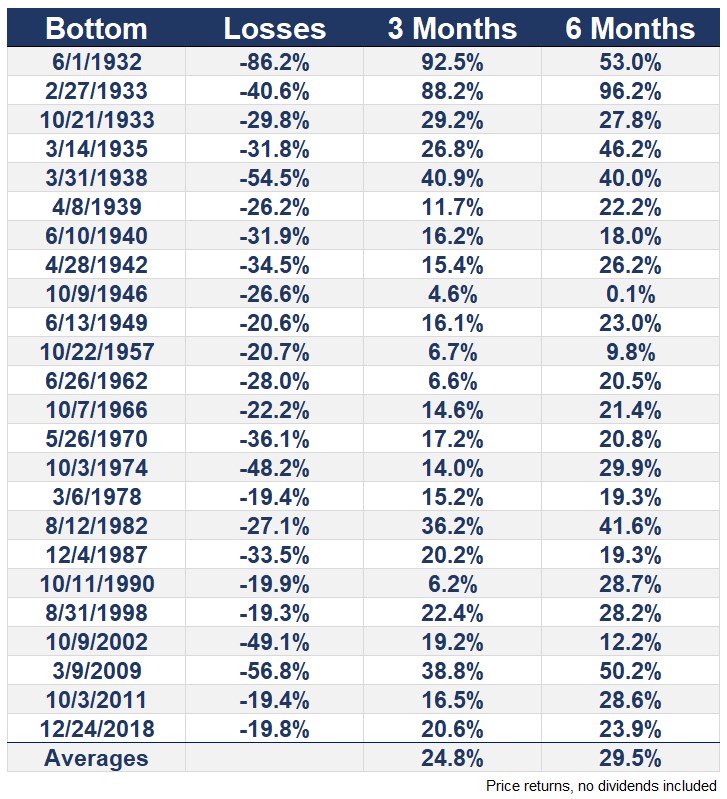
There’s a good reason why it’s so difficult to tell the difference between a dead cat bounce within the context of a bear market and an actual market bottom. When stocks do eventually bottom, they tend to see strong gains coming out of the gate.
Here are the 3 and 6-month returns from the bottom of past S&P 500 bear markets:

I’m sure every one of these recoveries was called a dead cat bounce, bear market rally, short-covering or junk stock rally. It’s hard to trust the market to give you gains when all it’s done recently is take them away.
The stock market can move hard and fast in both a dead cat bounce AND a bear market bottom. The true nature of these bounces will only be known in hindsight.
There are people who will tell you with certainty that they know for sure whether this bounce or the next is the true bottom of this market crash. There are always backtests or historical parallels to back any market stance.
It will only look clear with the benefit of hindsight. This crash has been so swift and severe that it will likely play by its own set of rules.
That means no warning ahead of time before it bottoms and no certainty about the difference between a dead cat bounce and an actual end of the bear market.
The only trade I’m certain about at the moment is going long humility and short hubris.
Further Reading:
Some Questions I’m Pondering During the Crisis
