A large number of people have rightly been pointing to higher valuations to temper investor expectations about future returns. The problem is many of these same people have taken things a step further and used valuations to predict market crashes or the path of returns. Valuations don’t work very well as a timing indicator, as momentum and trend tend to trump valuation and fundamentals in the short-to-intermediate-term. This piece I wrote for Bloomberg gives some more context around this idea.
*******
Investors have been warned about rising stock market valuations for years. Some have been calling them a bubble. Others assume they mean a crash is imminent. Still others have been telling investors to expect low returns for the foreseeable future.
The problem is that most investors don’t really understand what higher-than-average valuations mean for stocks, and the data is highly inconclusive.
By my count, there have been 15 bear markets since World War II for the S&P 500. That means there has been a bear market about every five years over the past 70-plus years. Valuations were elevated in many of the market peaks that preceded these downturns but not all of them. Take a look at each bear market along with the trailing 12-month price-earnings ratio, the Shiller cyclically adjusted price-to-earnings ratio (CAPE) and the 10-year Treasury yield:
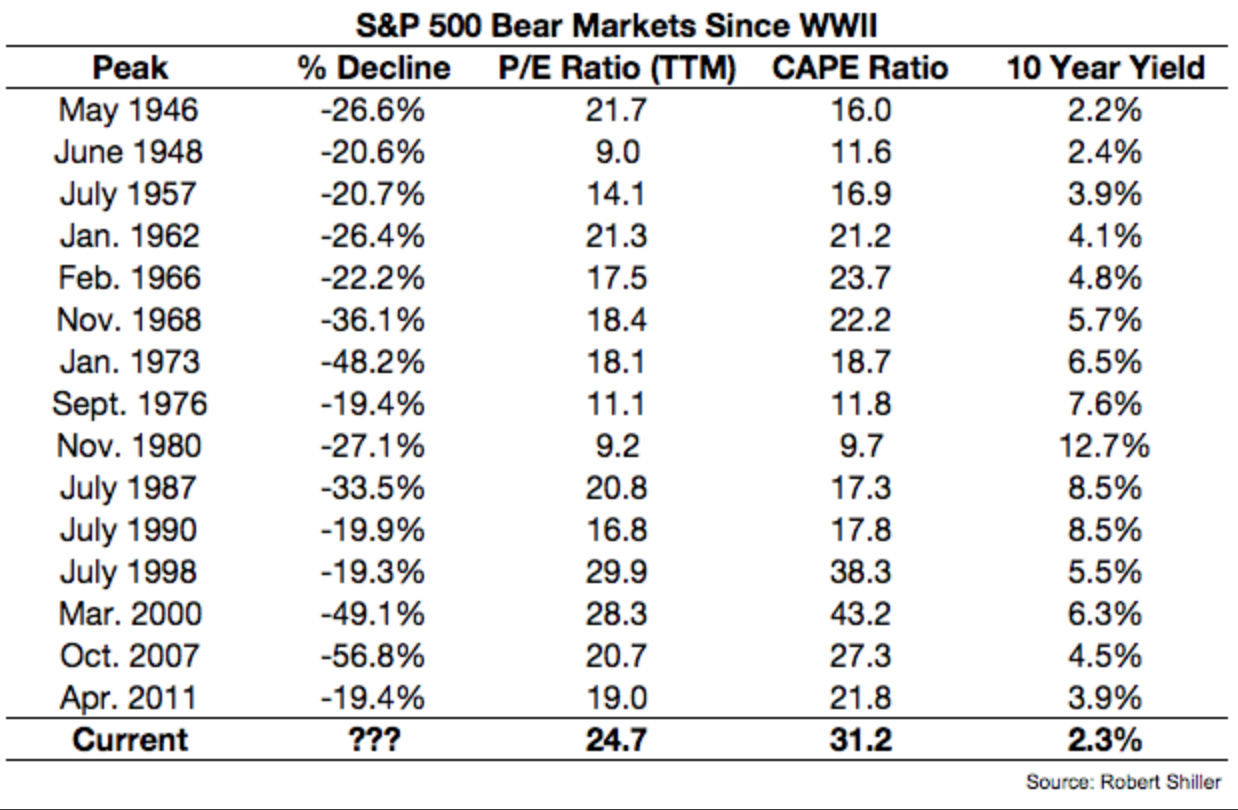
Since 1945, the average trailing 12-month P/E ratio has been 17.5; the average CAPE ratio was 18.6. That means six of the 15 bear markets came from below-average P/E ratios and seven of 15 peaked out at below-average CAPE ratios. And interest rates don’t help much here either. Stocks can fall when rates are high, low or otherwise.
The majority of stock market slumps may have occurred coming off of elevated valuations, but there’s no threshold level that, once breached, gives investors a clear signal to get out. There’s no rhyme or reason that determines the trigger that will cause investors to change their allocation preferences or panic.
Although there’s no clear relationship between a market crash and valuation levels, there is a strong link between a starting valuation and subsequent returns. The following table shows a range of starting CAPE ratios along with future three-, five- and 10-year average annual returns on the S&P 500 going back to 1945:
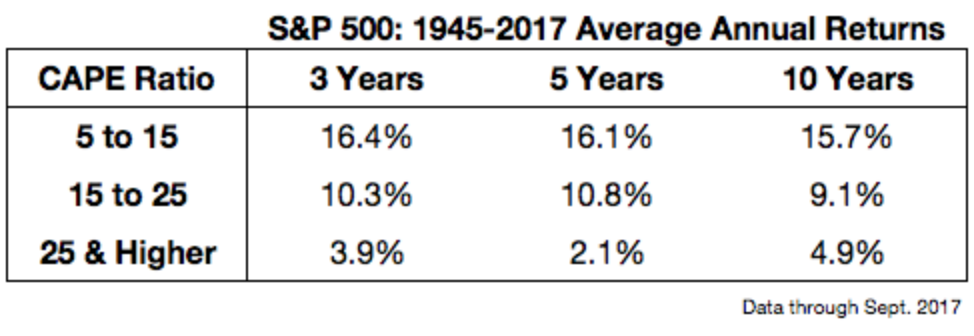
You can see a common theme at the various cut-off points. (1) Lower starting valuations have led to higher-than-average stock market returns, while higher starting valuations have led to lower-than-average stock market returns. This is helpful to understand, but investors also must remember that averages can be deceiving. No one gets an average experience in the markets. This table shows the range of best and worst annual returns using the same valuation starting points and time frames:
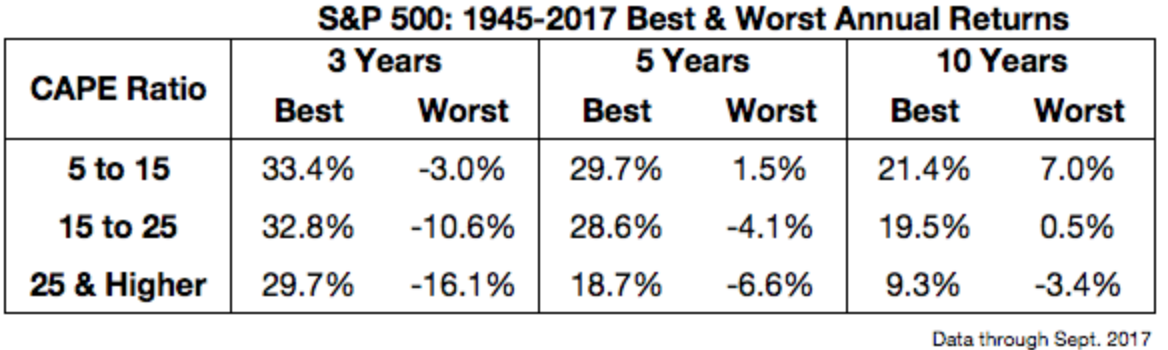
There is still a relationship between valuations and best- and worst-case scenarios. There have been higher highs and higher lows for the low-valuation range and lower highs and lower lows for the high-valuation range. But there have also been some very respectable market returns during periods of high valuations. There were also environments in which low valuations didn’t reward investors as much as you would expect. This is the nature of risk in the stock market.
If nothing else, this type of analysis can help investors reset their expectations. In the future, returns should be lower from current valuation levels. But that doesn’t mean they can’t continue to be above average for some time. And elevated valuations don’t mean stocks have to crash.
Valuations can come down through time or price. Although it would make life easier for those who have been calling for a crash to see stocks drop substantially, another scenario could simply see equities go nowhere for a while or fall, but without a huge crash. As long as fundamentals continue to improve, this would make valuations more attractive.
Stock market valuations have never worked as a timing tool. They don’t tell you when to get out of the market or when to get back in. This is because markets are driven by sentiment, trends and momentum more than fundamentals over the short-to-intermediate terms. But valuations can help investors better frame their expectations for future market returns. It’s not an exact science, but periods of above-average returns typically lead to above-average valuations that eventually lead to periods of below-average returns and valuations. The tricky part is this is not a precise relationship and it doesn’t work on a set schedule.
The past few cycles have taught us that they can last much longer than most people would imagine, both to the upside and the downside.
Originally published on Bloomberg View in 2017. Reprinted with permission. The opinions expressed are those of the author.
(1) From 1945 to September 2017, the CAPE ratio spent 36 percent in the 5-to-15 range, 48 percent in the 15-to 25-range, and 16 percent of its time above 25x trailing 10-year average earnings.

