A reader asks:
I’ve just come across your blog post from 2016, “Deconstructing 30-Year Stock Market Returns.” Thank you for that! It was just about exactly what I was looking for. I wonder if you have updated your finding since then? Also, have you run the analysis for other time periods? 10-year and 20-year rolling averages would also be interesting.
When Matthew McConaughey was on his book tour he told Jimmy Fallon one of the reasons he writes on a regular basis is to forget.
"I write things down to forget."
–@McConaughey explains the value of journaling and how it helped him write “Greenlights.” #FallonTonight pic.twitter.com/GIYzNNmMRK
— The Tonight Show (@FallonTonight) December 15, 2021
I’ve been writing regularly for a long time now too and I definitely forgot about this one. In that post I looked at the rolling 30 year annual returns for the U.S. stock market.
One of my favorite topics to write about is long run returns so we might as well update some numbers to see how things look.
Here are the rolling 10 year returns going all the way back to 1926:
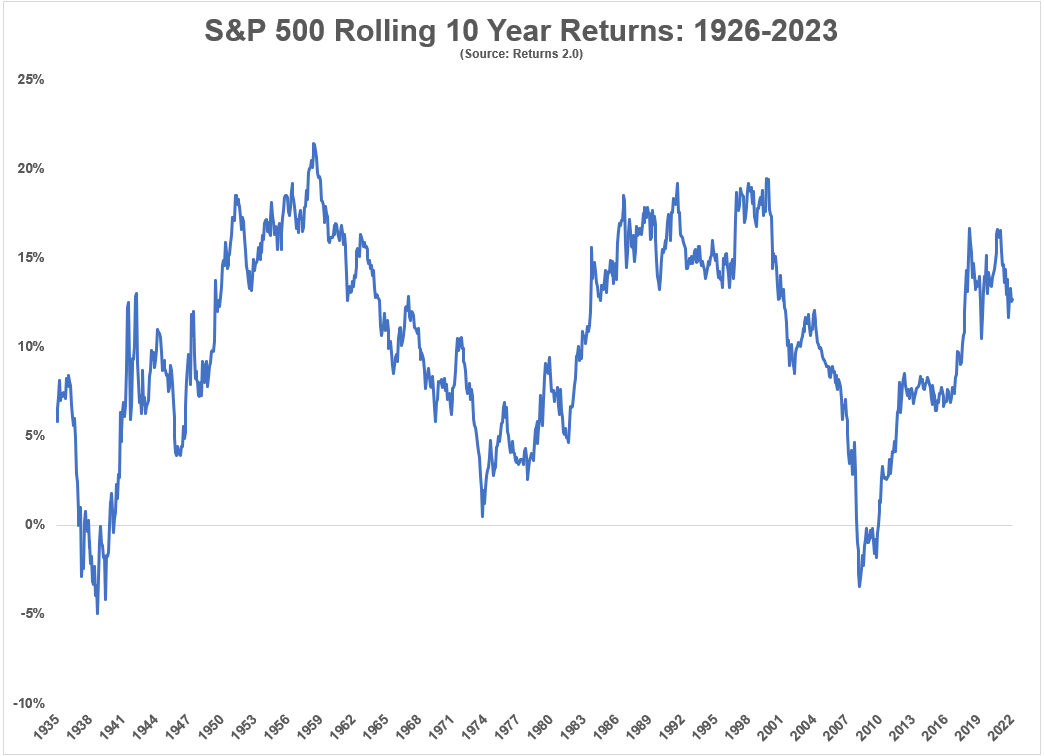
Even over decade-long time frames, there was plenty of volatility in returns.
The best 10 year annual return was 21.4% for the period ending towards the tail-end of 1959. That’s a total return of roughly 600%. As Mr. McConaughhey would say — alright, alright, alright.
The worst 10 year annual return was a loss of almost 5% per year ending in the summer of 1939. That was bad enough for a 10 year total return of -40%. The 1930s were a little rough.
The only other time the market experienced negative returns over 10 years was starting with the bursting of the dot-com at the start of the 2000s followed by the Great Financial Crisis hitting towards the end of that decade.
Over rolling 20 year periods we see the down returns make an exit but still plenty of variation:
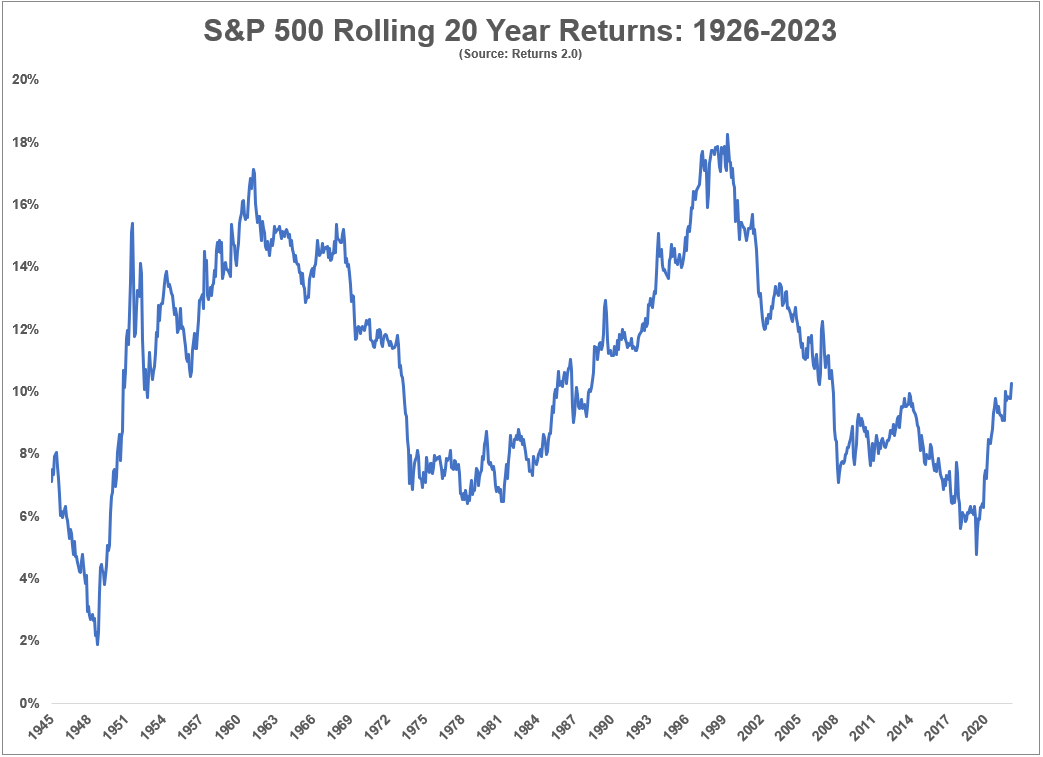
The best 20 year annual return was more than 18% per year from the early-1980s through the spring of 2000 at the aforementioned dot-com bubble peak.
The worst 20 year return was a gain of less than 2% ending in 1949. This makes sense when you consider that period included the Great Depression and World War II.
One of the neat things about the distribution of returns over 20 years is almost 90% of the time annual returns were 7% or higher. Annual returns were 8% or more in 75% of all rolling 20 year observations. They were 10% or higher 56% of the time.
Now for one of my favorite long-run charts — rolling 30 year annual returns:
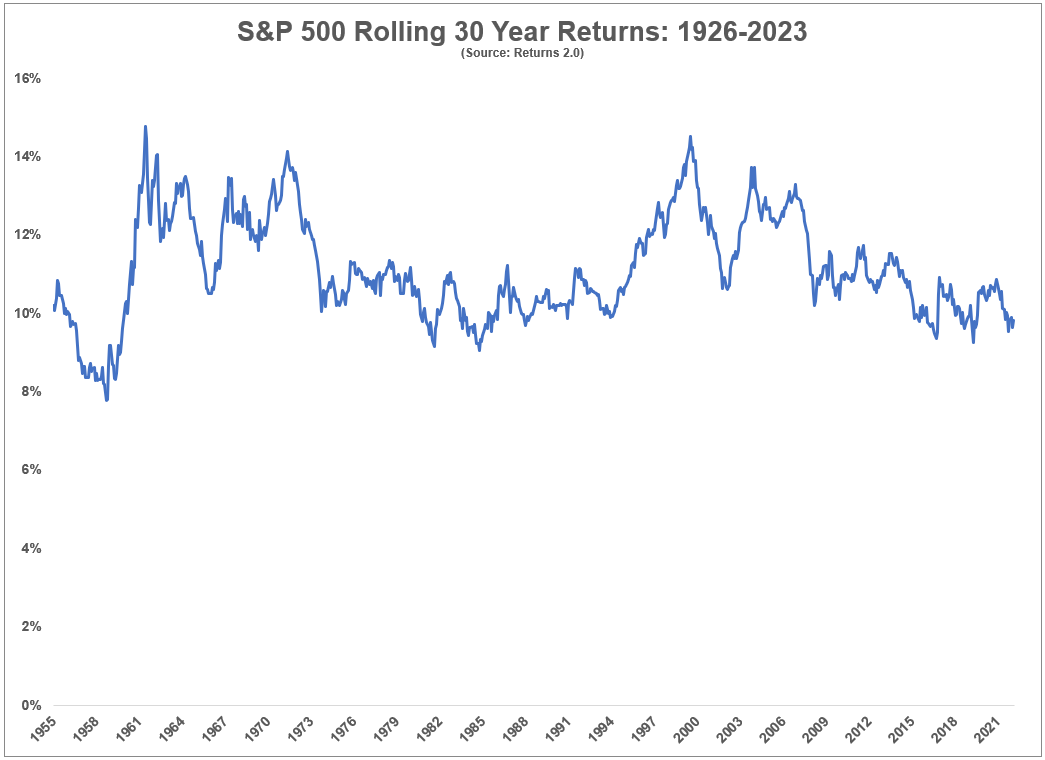
The lowest annual return over any 30 year period going back to 1926 was 7.8%. That’s what you got had you invested at the peak of the Roaring 20s boom in September 1929. You would have lost more than 80% of your investment in the ensuing crash and still made more than 850% in total over 30 years.
Allow me to repeat that stat for the people in the back — the worst 30 year return over the past 100 years or so was a total gain of 850%.1
The best 30 year annual return was 14.8% in the 30 years ending in 1968. This makes sense considering you would have been invested in 1939 following the worst 10 year stretch in history.
The most recent 10 year annual gain through January 2023 was 12.7%. The previous 20 years were up 10.3% per year. And the past 30 years were up 9.8% per year.
The most recent 30 year period since 1993 includes:
The Asian currency crisis, the dot-com crash, 9/11, the Iraq/Afghanistan wars, the Great Financial Crisis, the biggest global pandemic since 1918, the war in Ukraine and 9% inflation not to mention flash crashes, a few recessions, government shutdowns, trade wars, an insurrection, multiple impeachment hearings, 4 legitimate bear market crashes, 9 other stock market corrections and a whole bunch of other crazy and/or bad things I can’t think of right now.
I don’t know if we can have a repeat performance over the next 30 or 100 years.
Here’s what I wrote in my original blog post back in 2016:
We are promised nothing as investors in terms of future returns. Things could certainly be worse from this point forward. You just never know.
Still, it’s hard to look at these numbers and not be optimistic about the future. Bad things happen and human progress continues to march on.
I still believe this to be true.
Bet against human progress at your own peril.
We talked about this question on the latest edition of Portfolio Rescue:
Bill Sweet joined me once again to discuss bonds, Roth IRAs, RMDs, tax policy BBQ ribs and much more.
Further Reading:
Deconstructing 30 Year Stock Market Returns
1The usual caveats apply here — no taxes, fees, inflation or transaction expenses. Still.

