The equity markets are still relatively new in the grand scheme of things.
The way investors viewed stocks in the past is much different than it is today.
Interest rates were much higher in the past. This meant corporations in the late-19th and early-20th centuries had to offer dividend yields on their stocks that were higher than bond yields to entice people to invest in stocks.
Yield was one of the few valuation techniques investors applied to the financial markets.
Because of this yield relationship, there was a very simple valuation signal that would let investors know when stocks had become too pricey. Whenever the dividend yield on the stock market fell below the yield on bonds, stocks were too expensive and it was time to sell.
It was a pretty reliable signal, most notably triggered before the huge crashes that occurred in 1907 and 1929.
And then it stopped working.
Peter Bernstein explains in Against the Gods:
So it is no wonder that investors bought stocks only when they yielded a higher income than bonds. And no wonder that stock prices fell every time the income from stocks came close to the income from bonds.
Until 1959, that is. At that point, stock prices were soaring and bond prices were falling. This meant that the ratio of bond interest to bond prices was shooting up and the ratio of stock dividends to stock prices was declining. The old relationship between bonds and stocks vanished, opening up a gap so huge that ultimately bonds were yielding more than stocks by an even greater margin than when stocks had yielded more than bonds.
The cause of this reversal could not have been trivial. Inflation was the main factor that distinguished the present from the past. From 1800 to 1940, the cost of living had risen an average of only 0.2% a year and had actually declined on 69 occasions. In 1940 the cost-of-living index was only 28% higher than it had been 140 years earlier. Under such conditions, owning assets valued at a fixed number of dollars was a delight; owning assets with no fixed dollar value was highly risky.
World War II and the economic environment that ensued altered this relationship forever.
From 1941-1959, inflation would average 4% per year. Prices doubled in that 19 year period.
This environment was none too kind to bond investors. Bernstein points out 10 year treasuries purchases in 1945 were worth 82 cents on the dollar by 1959. And that was before inflation.
That 82 cents could only buy half as much in 1959 as it could in 1949.
Meanwhile dividends paid out by corporations took off like a rocketship in this same time frame:
Stock dividends took off on a rapid climb, tripling between 1945 and 1959, with only one year of decline—and even that a mere 2%. No longer did investors perceive stocks as a risky asset whose price and income moved unpredictably. The price paid for today’s dividend appeared increasingly irrelevant. What mattered was the rising stream of dividends that the future would bring. Over time, those dividends could be expected to exceed the interest payments from bonds, with a commensurate rise in the capital value of the stocks. The smart move was to buy stocks at a premium because of the opportunities for growth and inflation hedging they provided, and to pass up bonds with their fixed-dollar yield.
Investors are now well aware that stocks provide a long-term hedge against inflation but it does make sense that higher prices can cause a regime change in the markets.
The fact that inflation is still a relatively new concept could help explain why it’s so difficult to understand and why it makes people so angry.
We’re simply not used to inflation for an extended period of time. Few people have experience dealing with the aftermath of rapidly rising prices.
And although overall inflation was extremely low back in the day, it’s not like it was non-existent. It was just far more cyclical.
This is the annual inflation rate in the U.S. from World War I through World War II:
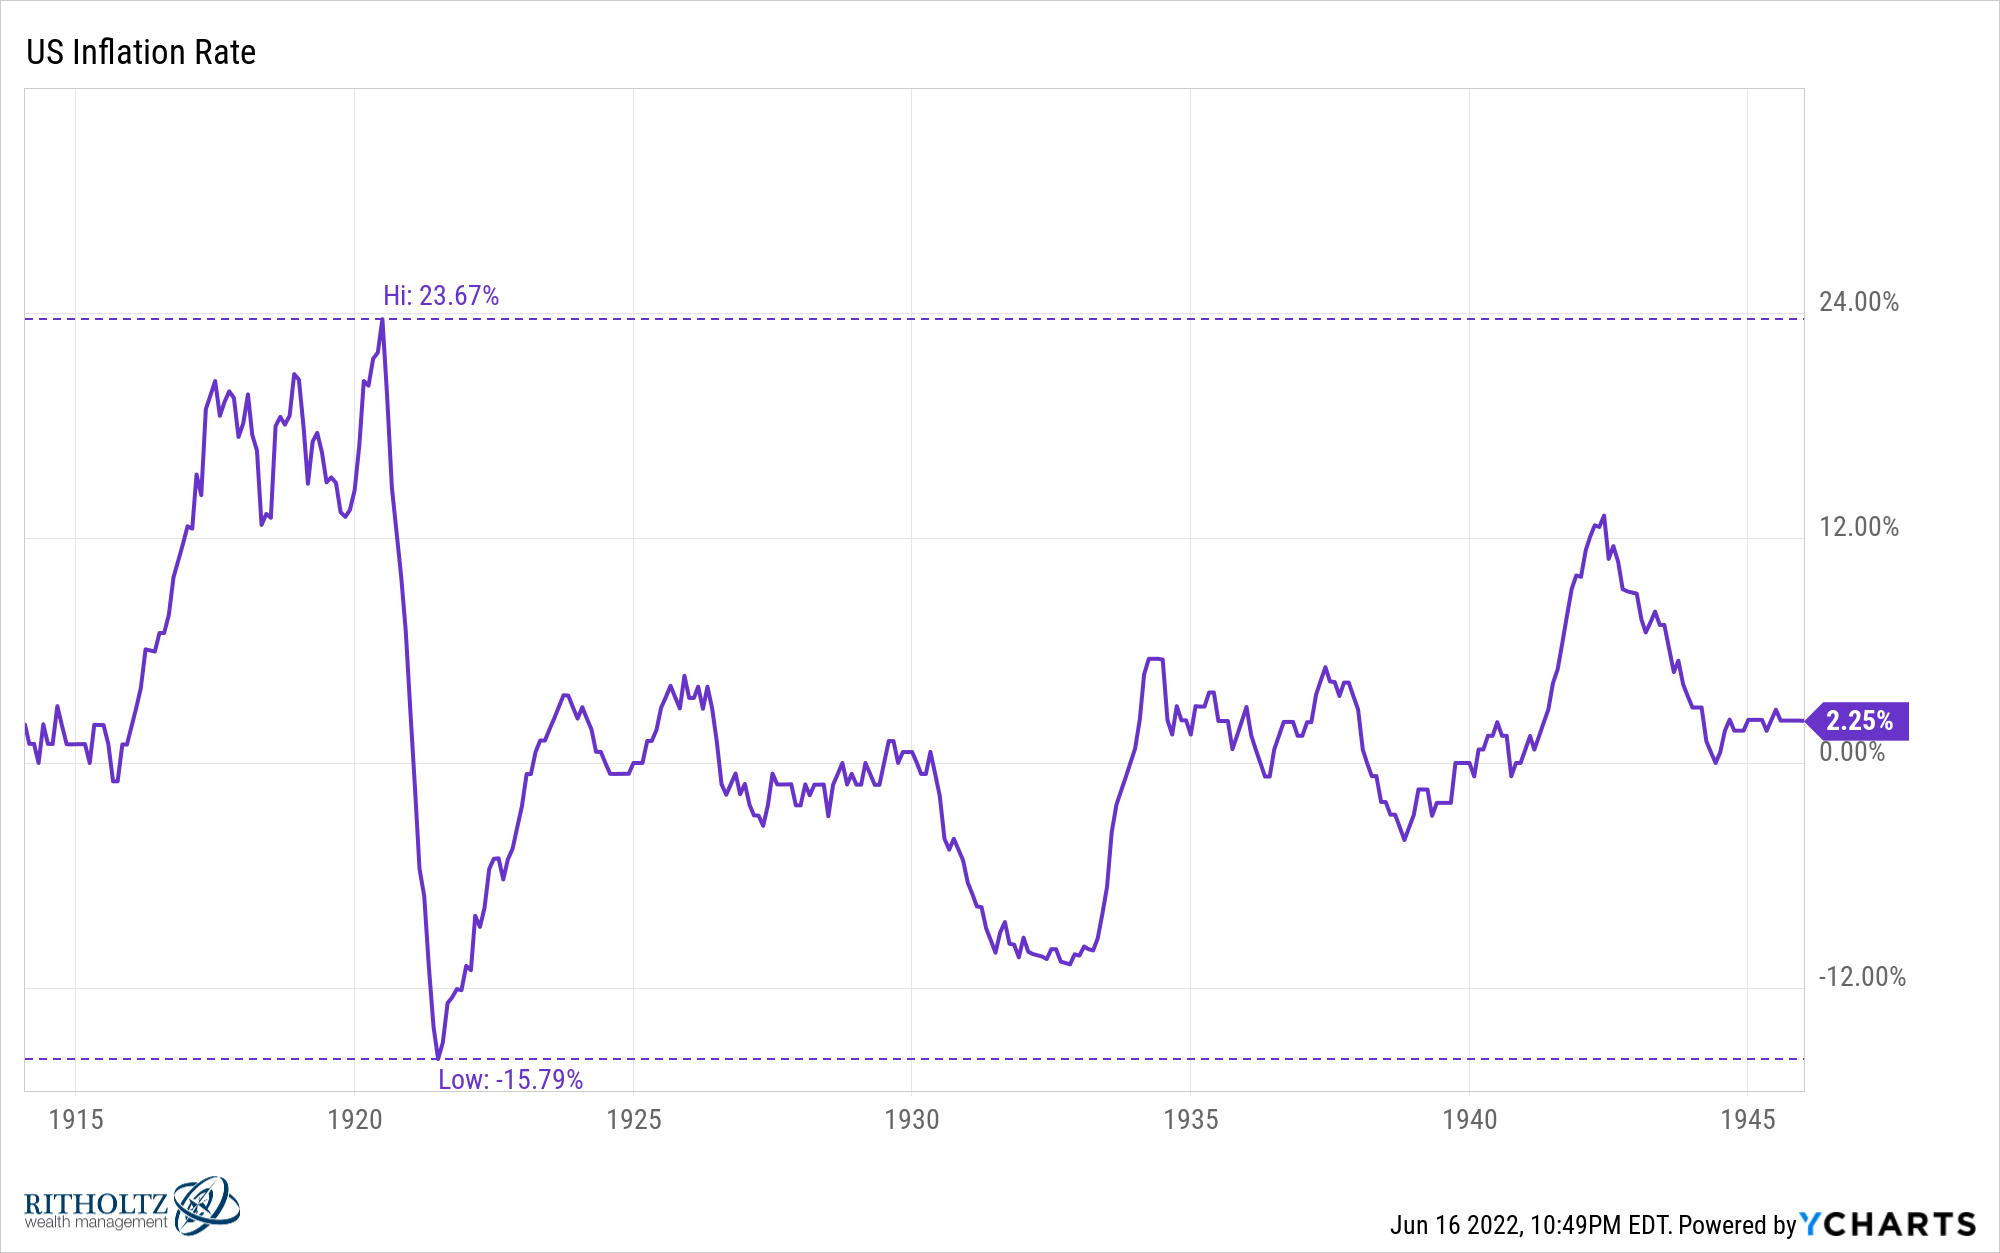
The average inflation rate was just 2% per year but it was above 5% for almost 25% of this time. Roughly one out of every 7 years saw inflation of 10% or more.
But there was also deflation more than one-third of the time.
There was far more economic volatility with few sustained periods of calm.
Contrast those numbers with the 40 year period since 1982.
Inflation hasn’t been above 10% even once (yet). It was above 5% just 8% of the time while deflation occurred in just 3% of all inflation readings.
Yet the average annual rate was more than 3%.
There is a lot we still don’t understand about inflation, especially since there is such a huge psychological component to prices and spending by consumers.
Inflation could remain elevated for some time if governments continue to spend money or the energy crisis worsens.
But it also wouldn’t surprise me to see severe disinflation or even deflation if the Fed overplays its hand with interest rate hikes and we go into a recession.
Maybe we’re due for more economic volatility than we’ve had these past 4 decades. Or maybe the pandemic will be an outlier because there was so much economic weirdness going on.
It’s good to keep an open mind about what comes next in regards to both prices and financial markets.
I’ll let Bernstein have the final word here:
The fact that something so unthinkable could occur has had a lasting impact on my view of life and on investing in particular. It continues to color my attitude toward the future and has left me skeptical about the wisdom of extrapolating from the past.
Michael and I spoke about inflation and much more on this week’s Animal Spirits video:
Further Reading:
The Worst Cast Inflation Scenario

