On January 3 of this year, the first trading day of 2022, the S&P 500 closed at an all-time high of 4,796.56.
The market was up 0.64% that day. It would turn out to be the only day this year the market finished in the black.
It’s been all downhill ever since. The S&P is in the midst of an 18.6% drawdown from those highs.
Even when you include dividends, the total return for this year is -17.7%.
Not great.
Here’s a look at the annual returns every year going back to 1928:
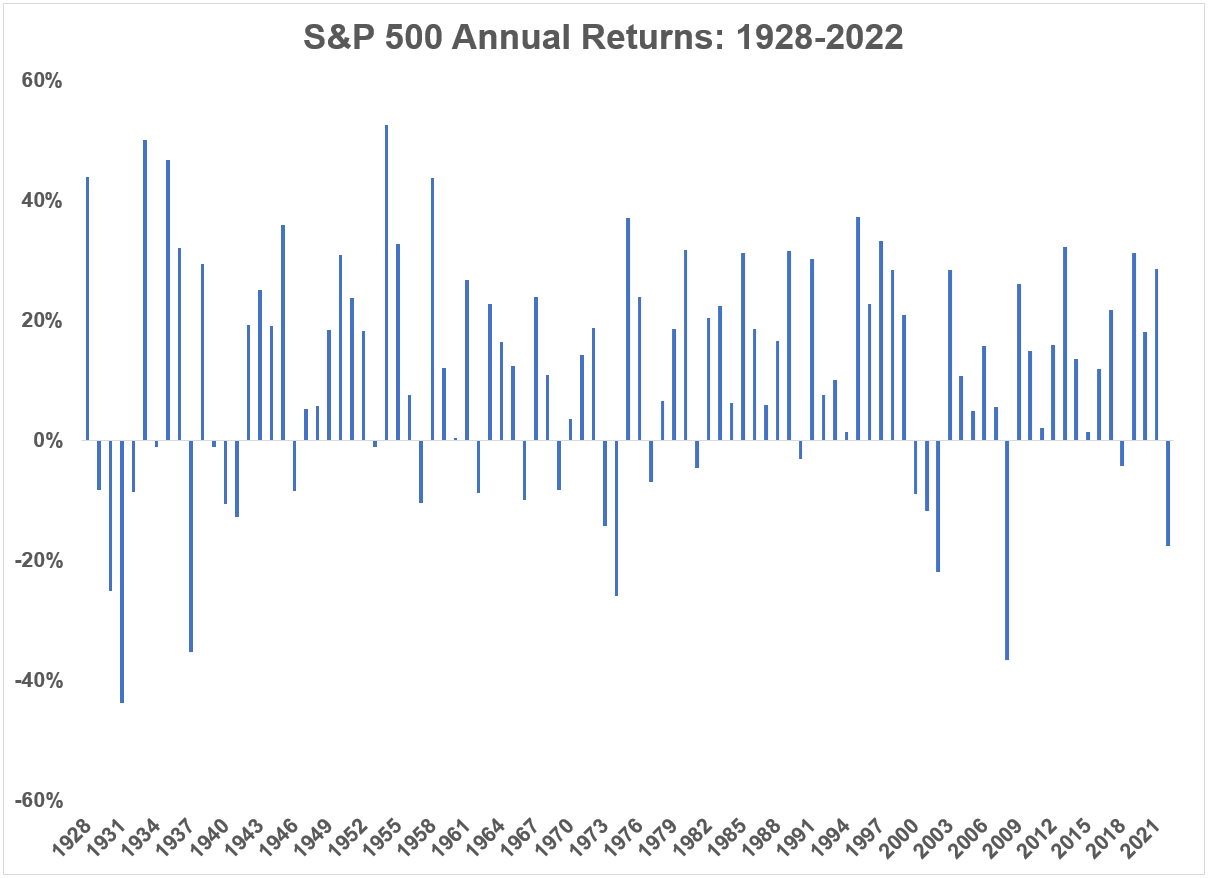
One thing stands out when looking at this chart — lots of big gains and a decent number of big losses.
The stock market is prone to extremes.
I included the 2022 year-to-date return on this chart. You can see that it rivals some of the worst years in history (so far).
Here’s the list of worst annual returns in the U.S. stock market going back to 1928:
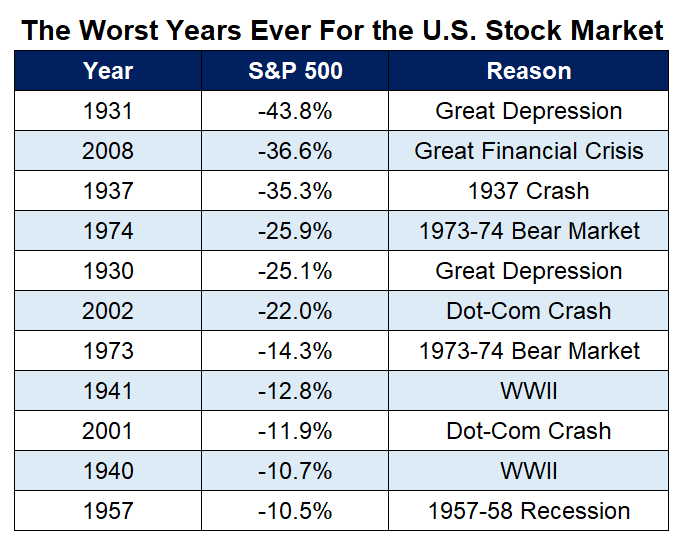 This list includes the only double-digit losses for the S&P in this time frame. It’s happened 11 times.
There’s a running theme here — the worst years have occurred during market crashes, war or economic upheaval.
This year has a little of each category.
If the year were to end today, 2022 would rank as the 7th worst calendar year return for the U.S. stock market since just before the Great Depression.
Again, not great.
There is still plenty of time left before the year is over but there’s no denying this has been a terrible, no good year in the stock market to date.
What are you gonna do? It happens.
Just out of curiosity, I looked at the returns in the years after the worst annual performance on the stock market to see what happened next.
Here are the forward one, three and five year total returns following the previous 11 worst annual returns for U.S. stocks:
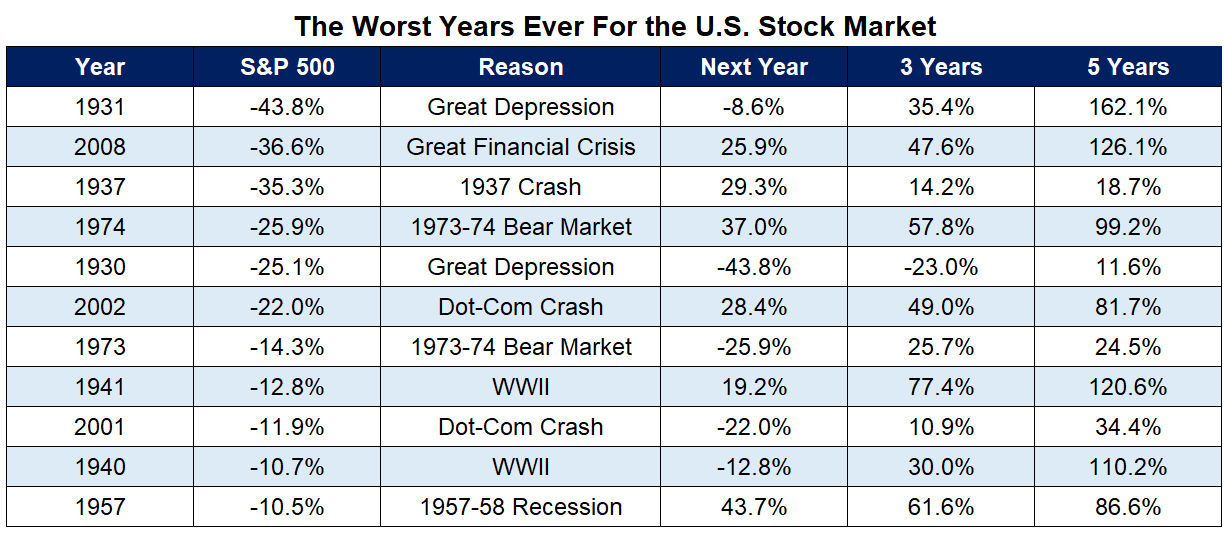
The one year returns are decent, not great. The average returns were 6.4% while just 6 out of 11 times performance was positive.
It’s rare for the stock market to fall two years in a row but not out of the question. It’s happened 8 times since 1928.
The problem is, most of the time when it happens, it occurs around one of these awful years.
Stocks fell 4 years in a row from 1929-1933. Then they fell 3 years in a row from 1939-1941. It didn’t happen again until 1973-1974. The next time was from 2000-2002.
And that’s it. Those are the only times the stock market has fallen two years in a row or more.
It’s rare but it happens.
Could the current situation into one of the all-timer kinds of market crashes?
It’s possible.
We’re dealing with four-decade high inflation, war, a pandemic, labor shortages, supply chain issues, Fed tightening, Taylor Swift’s deafening silence about rising rates and more.
That’s the bad news.
Here’s the good news — the longer-term returns after the worst years ever are pretty good.
The average 3 year forward return is +35%. The average 5 year forward returns is a gain of almost 80%.
There was only one 3 year period with negative returns following a poor down year and it was in the aftermath of the Great Depression. Every 5 year return following one of these dreadful down years saw positive returns.
I don’t know what’s going to happen for the remainder of 2022.
It wouldn’t surprise me if things got worse.
It wouldn’t surprise me if things got better.
This might sound like a cop-out but I’m long humility right now because things are so confusing.
There’s nothing you can do about the losses we’ve already experienced. It’s a sunk cost at this point.
The important thing to remember is the lower stocks go the higher your expected returns are going out into the future.
Lower stock prices are a good thing for long-term investors.
You just have to be patient.
Further Reading:
Lessons From the 10 Best Years in Stock Market History

