Markets are doing what they do. Here are 15 of the craziest charts I’m looking at these days:
1. Pandemic stocks getting taken to the woodshed. Basically all of the pandemic stock darlings are getting annihilated right now. Just look at the carnage here:
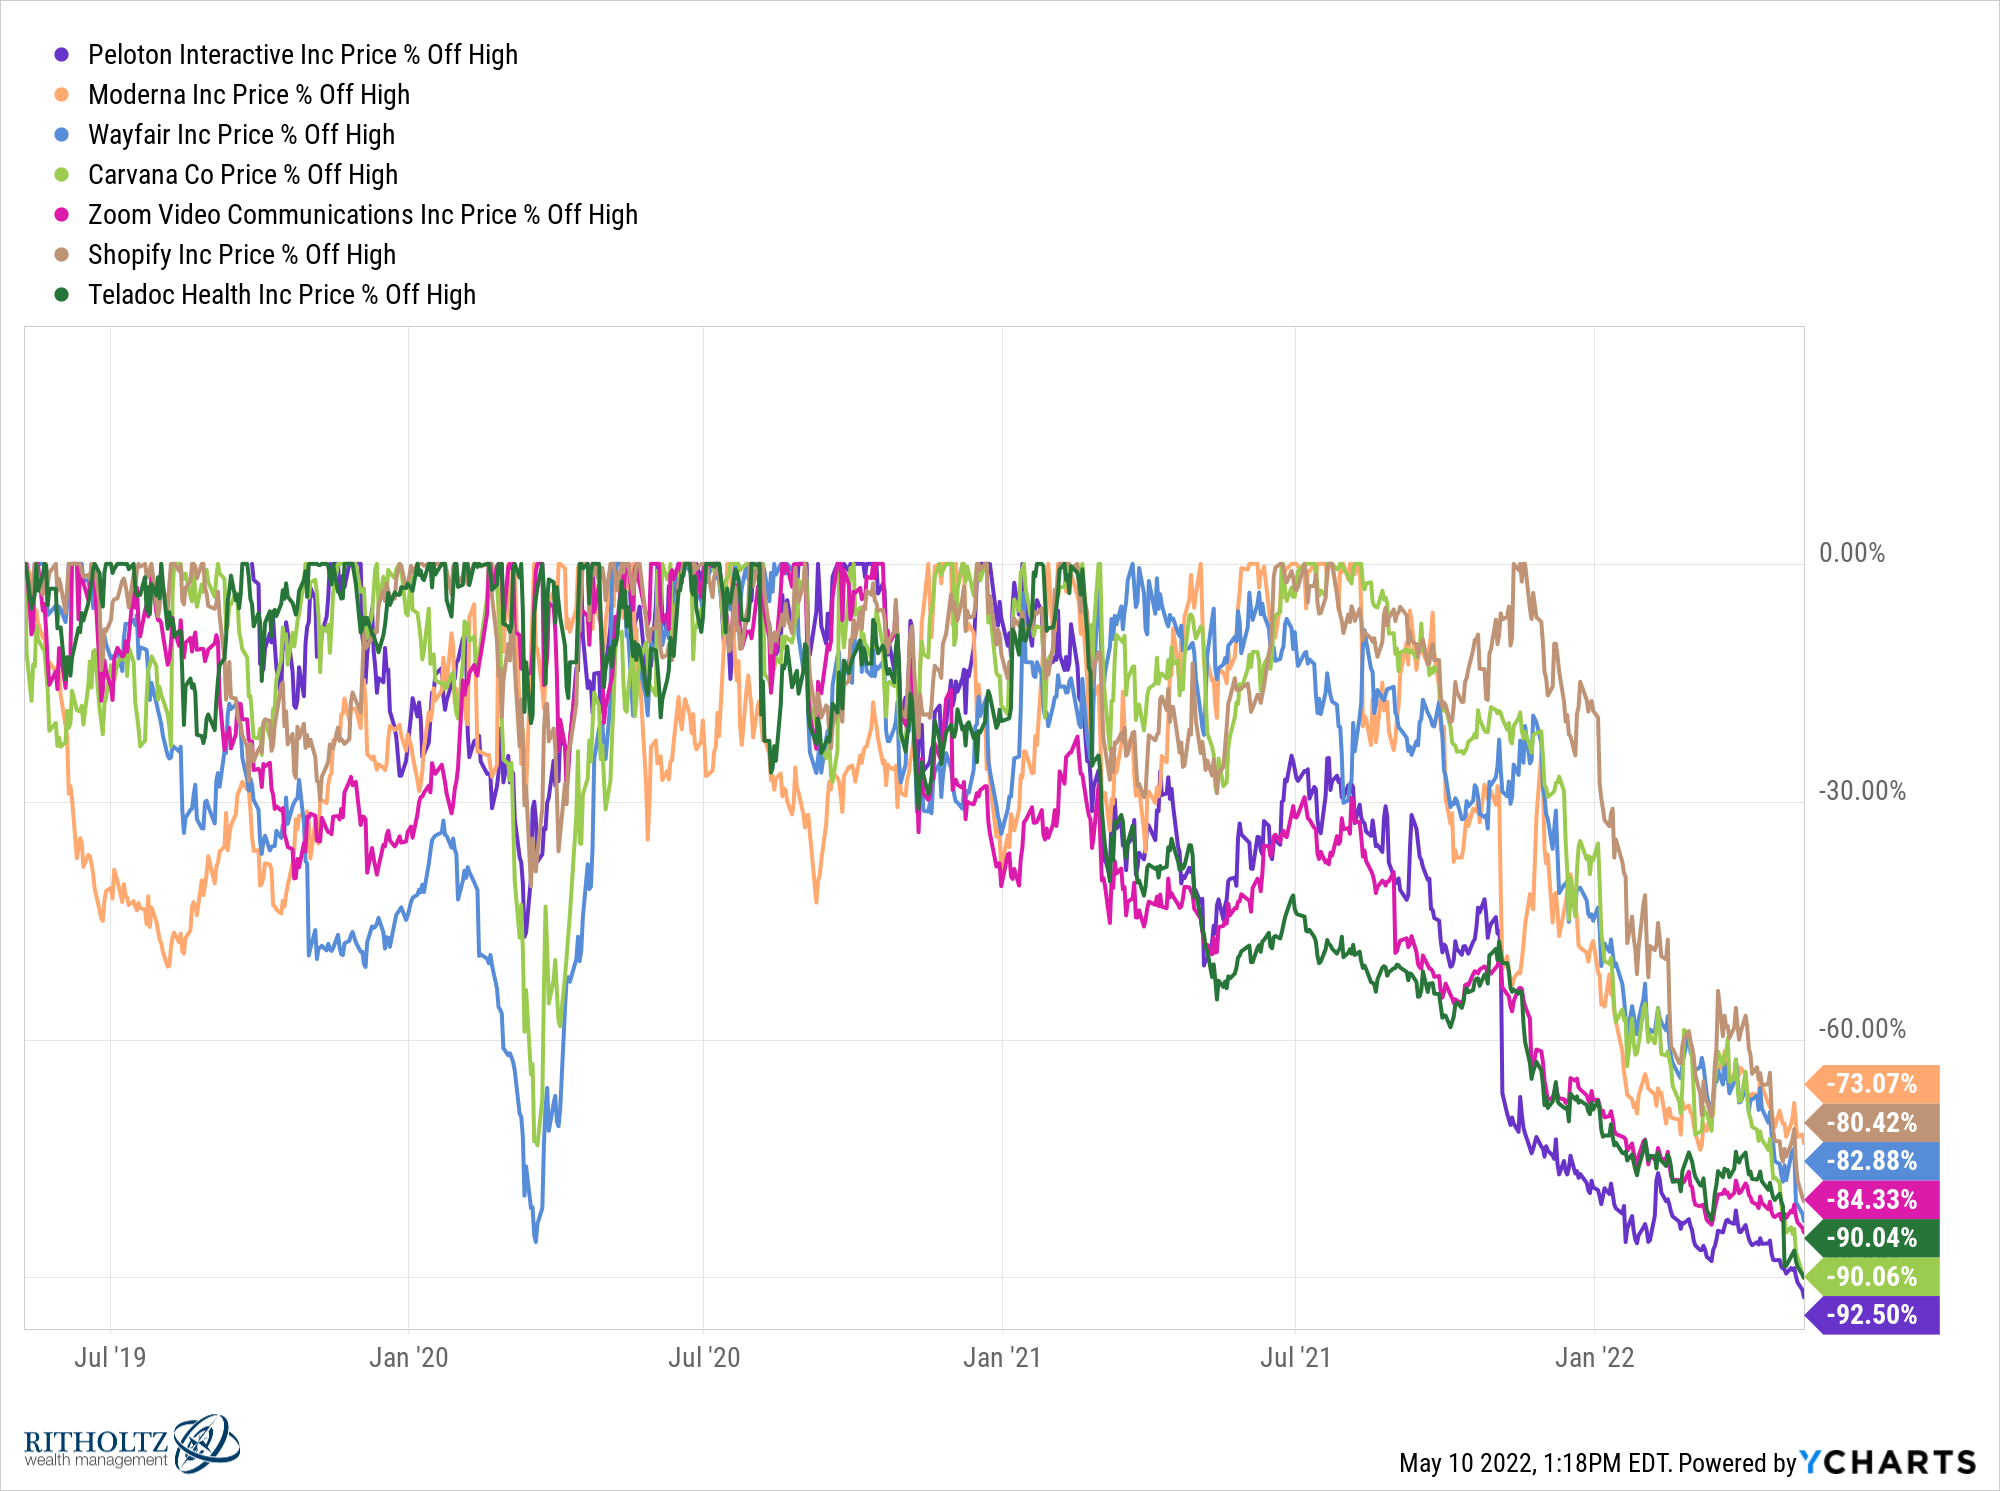
To be fair, many of these stocks were up hundreds of percentage points in 2020-2021 but seeing stocks down 80-90% from their highs that just occurred last year is something else.
2. Housing-related stocks too. Speaking of stocks that are getting crushed, look at Zillow, Opendoor and Redfin:
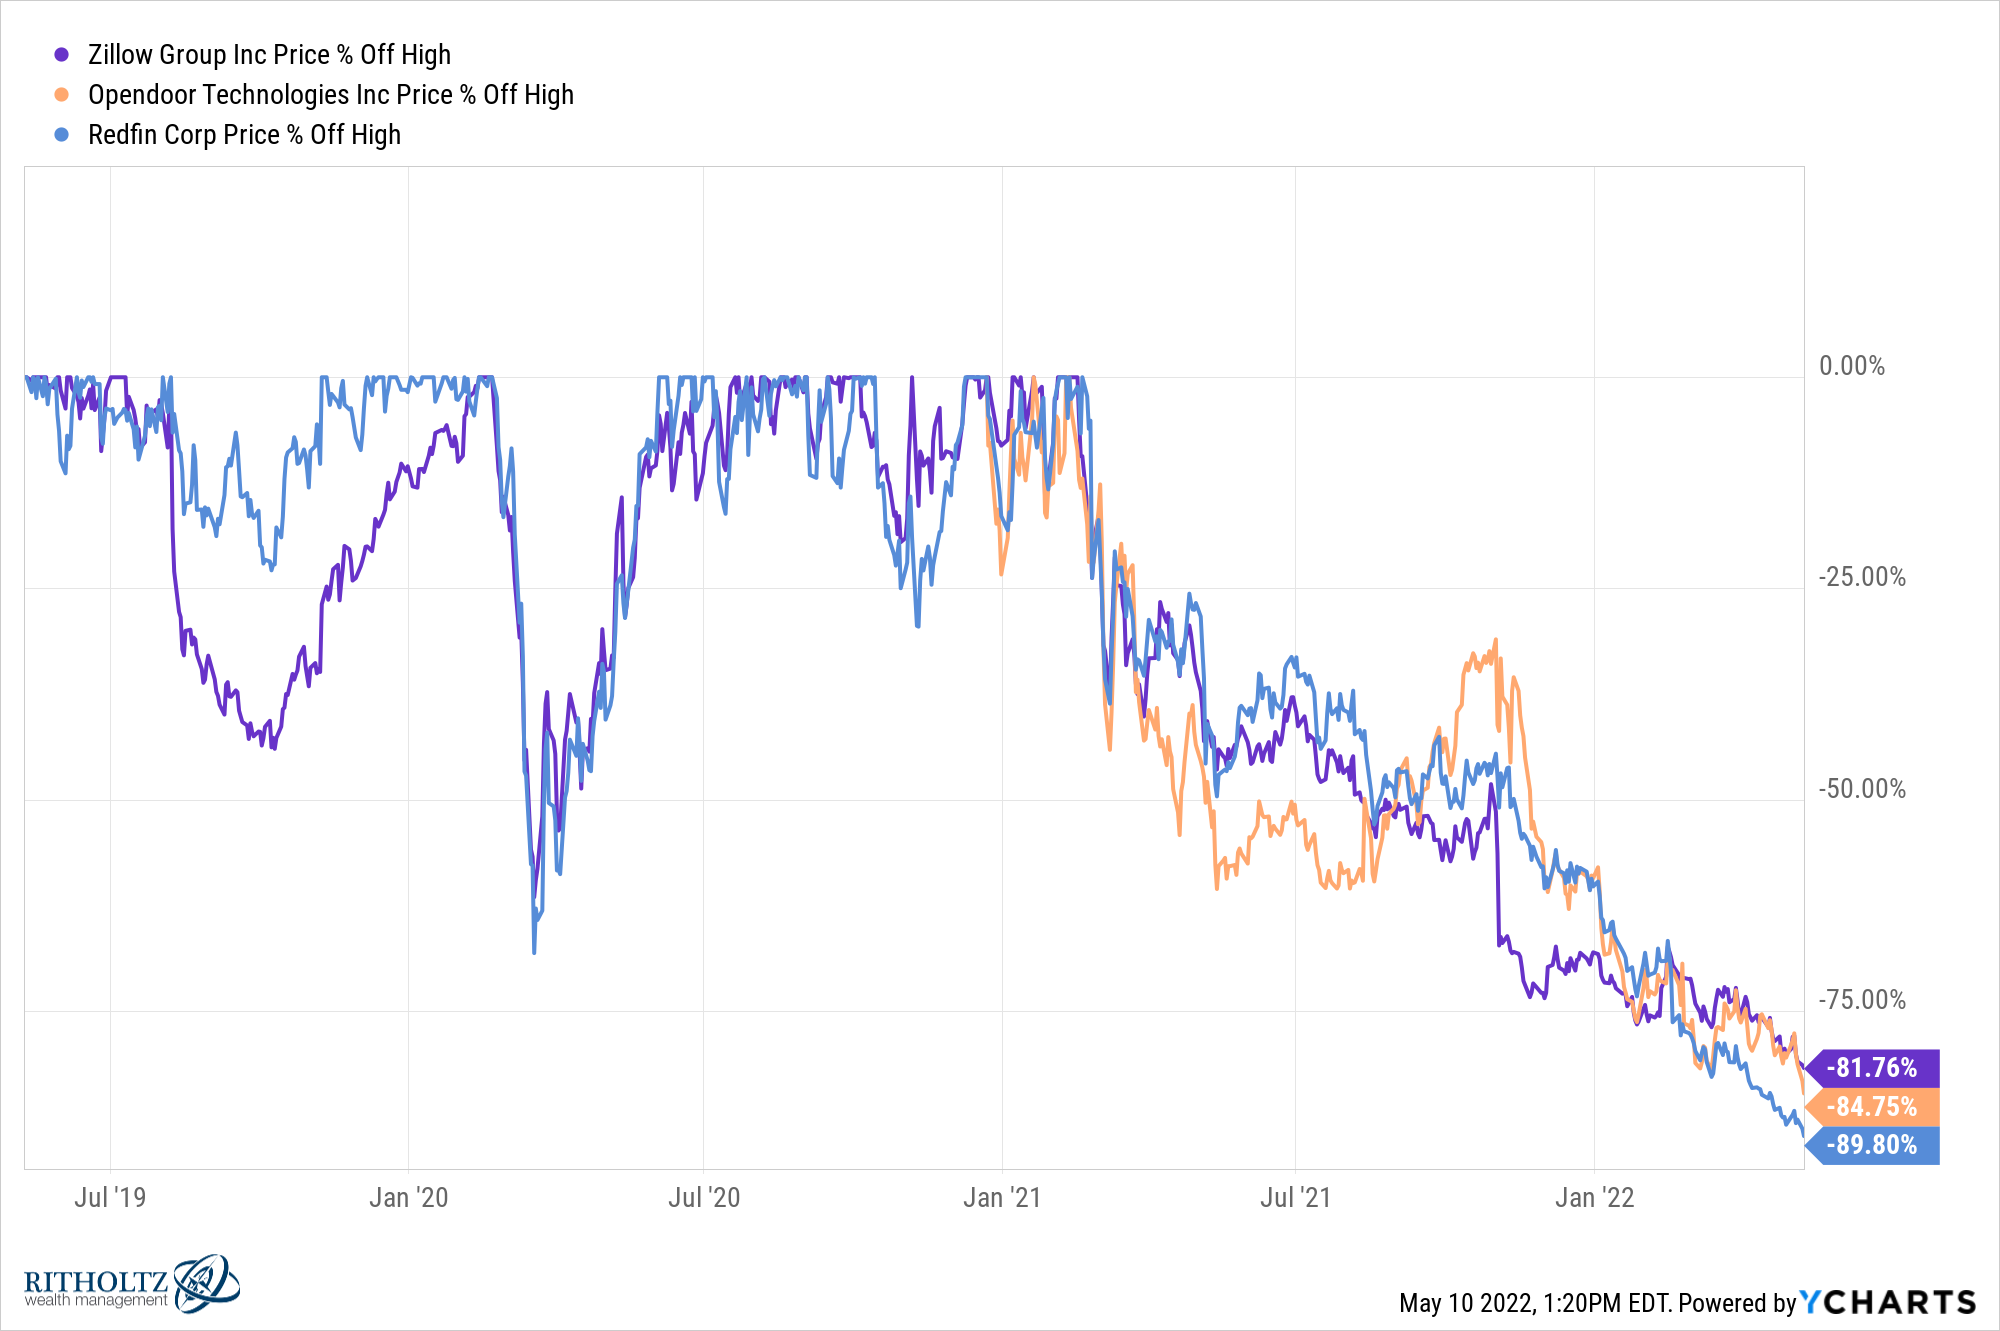
During one of the biggest housing booms of all time, these stocks are all down more than 80%.
3. The number of Russell 3000 stocks in a depression. And it’s not just a handful of stocks that are getting killed.
The Russell 3000 Index is made up of more than 2,700 stocks. The index itself is down 18% from all-time highs. But look at how many stocks are down much more than that:
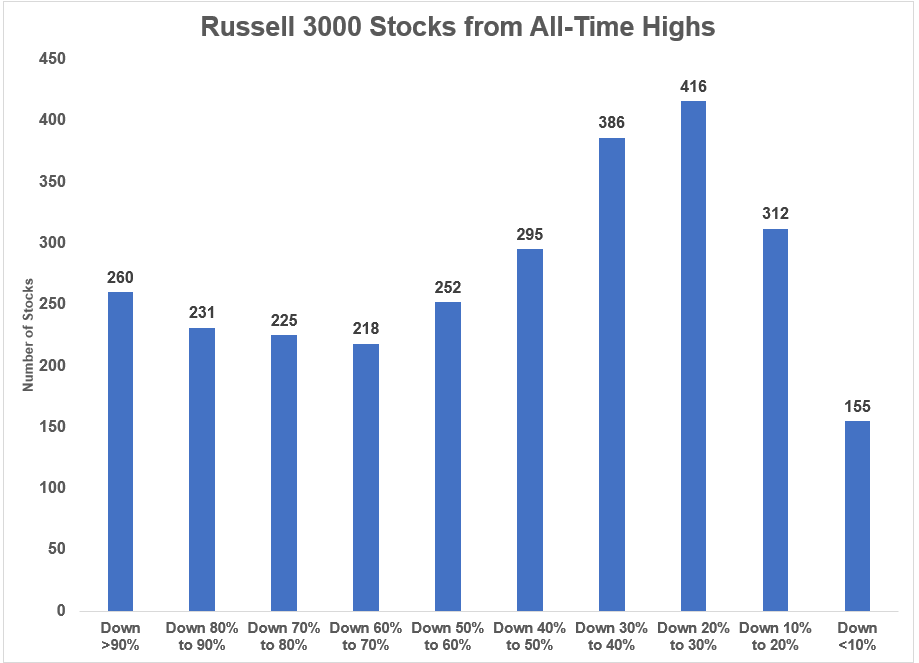
Almost 10% of the index is down 90% from their highs. Nearly 1 in 5 stocks are down 80% from their all-time highs at the moment.
While the stock market is still in correction territory, many stocks are acting like this is the Great Depression.
4. Stocks are getting cheaper. The good news from all of these stocks getting massacred is markets are getting cheaper.
Via Yardeni Research, small and mid cap stocks are now cheaper than they were during the 2018 bear market and approaching the levels of March 2020 (based on forward PE ratios):
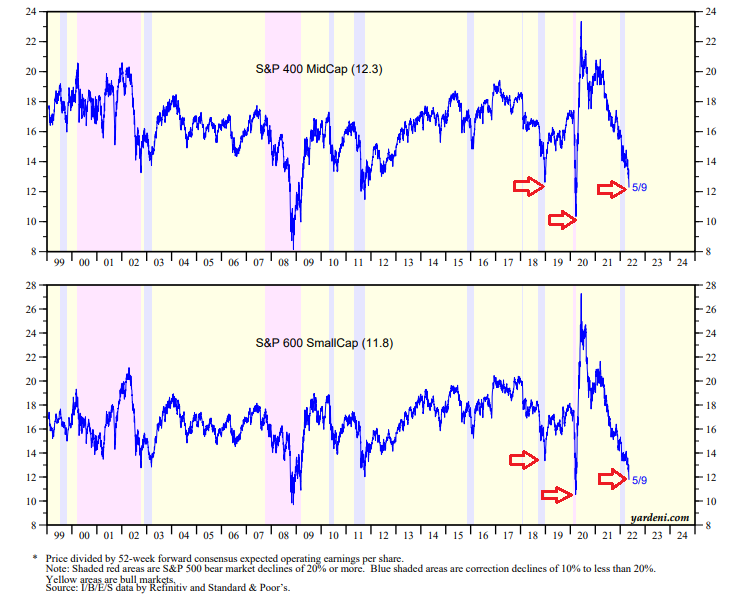
Current returns are falling but expected returns are rising.
This is true with stocks and it’s true with bonds.
5. A truly terrible year for bonds. The Bloomberg Aggregate Bond Index was started in 1976. The worst calendar year return since inception was a loss of 2.9% in 1994.
As of right now, the index is down 10% since the start of this year:
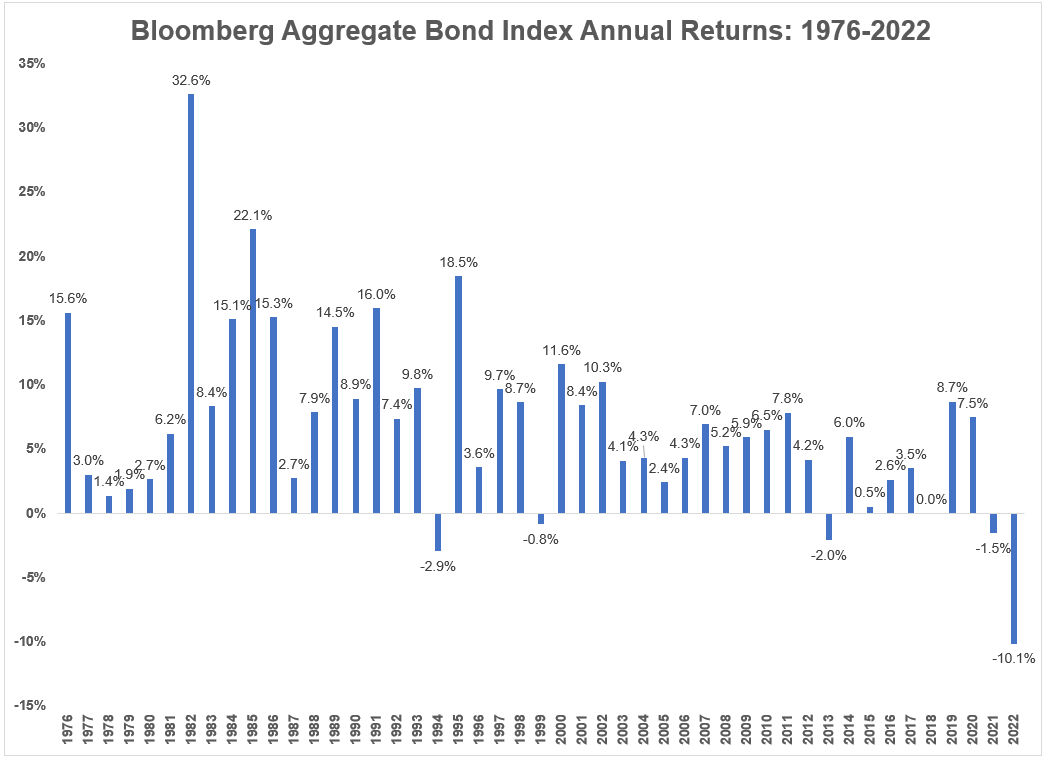
This is truly uncharted territory for fixed income investors.
6. Duration isn’t helping. Bond prices are falling because interest rates are rising. And the longer the duration the more prices are falling.
This PIMCO 25+ Year Zero Coupon Bond Fund1 is now down nearly 40% since March 2020:
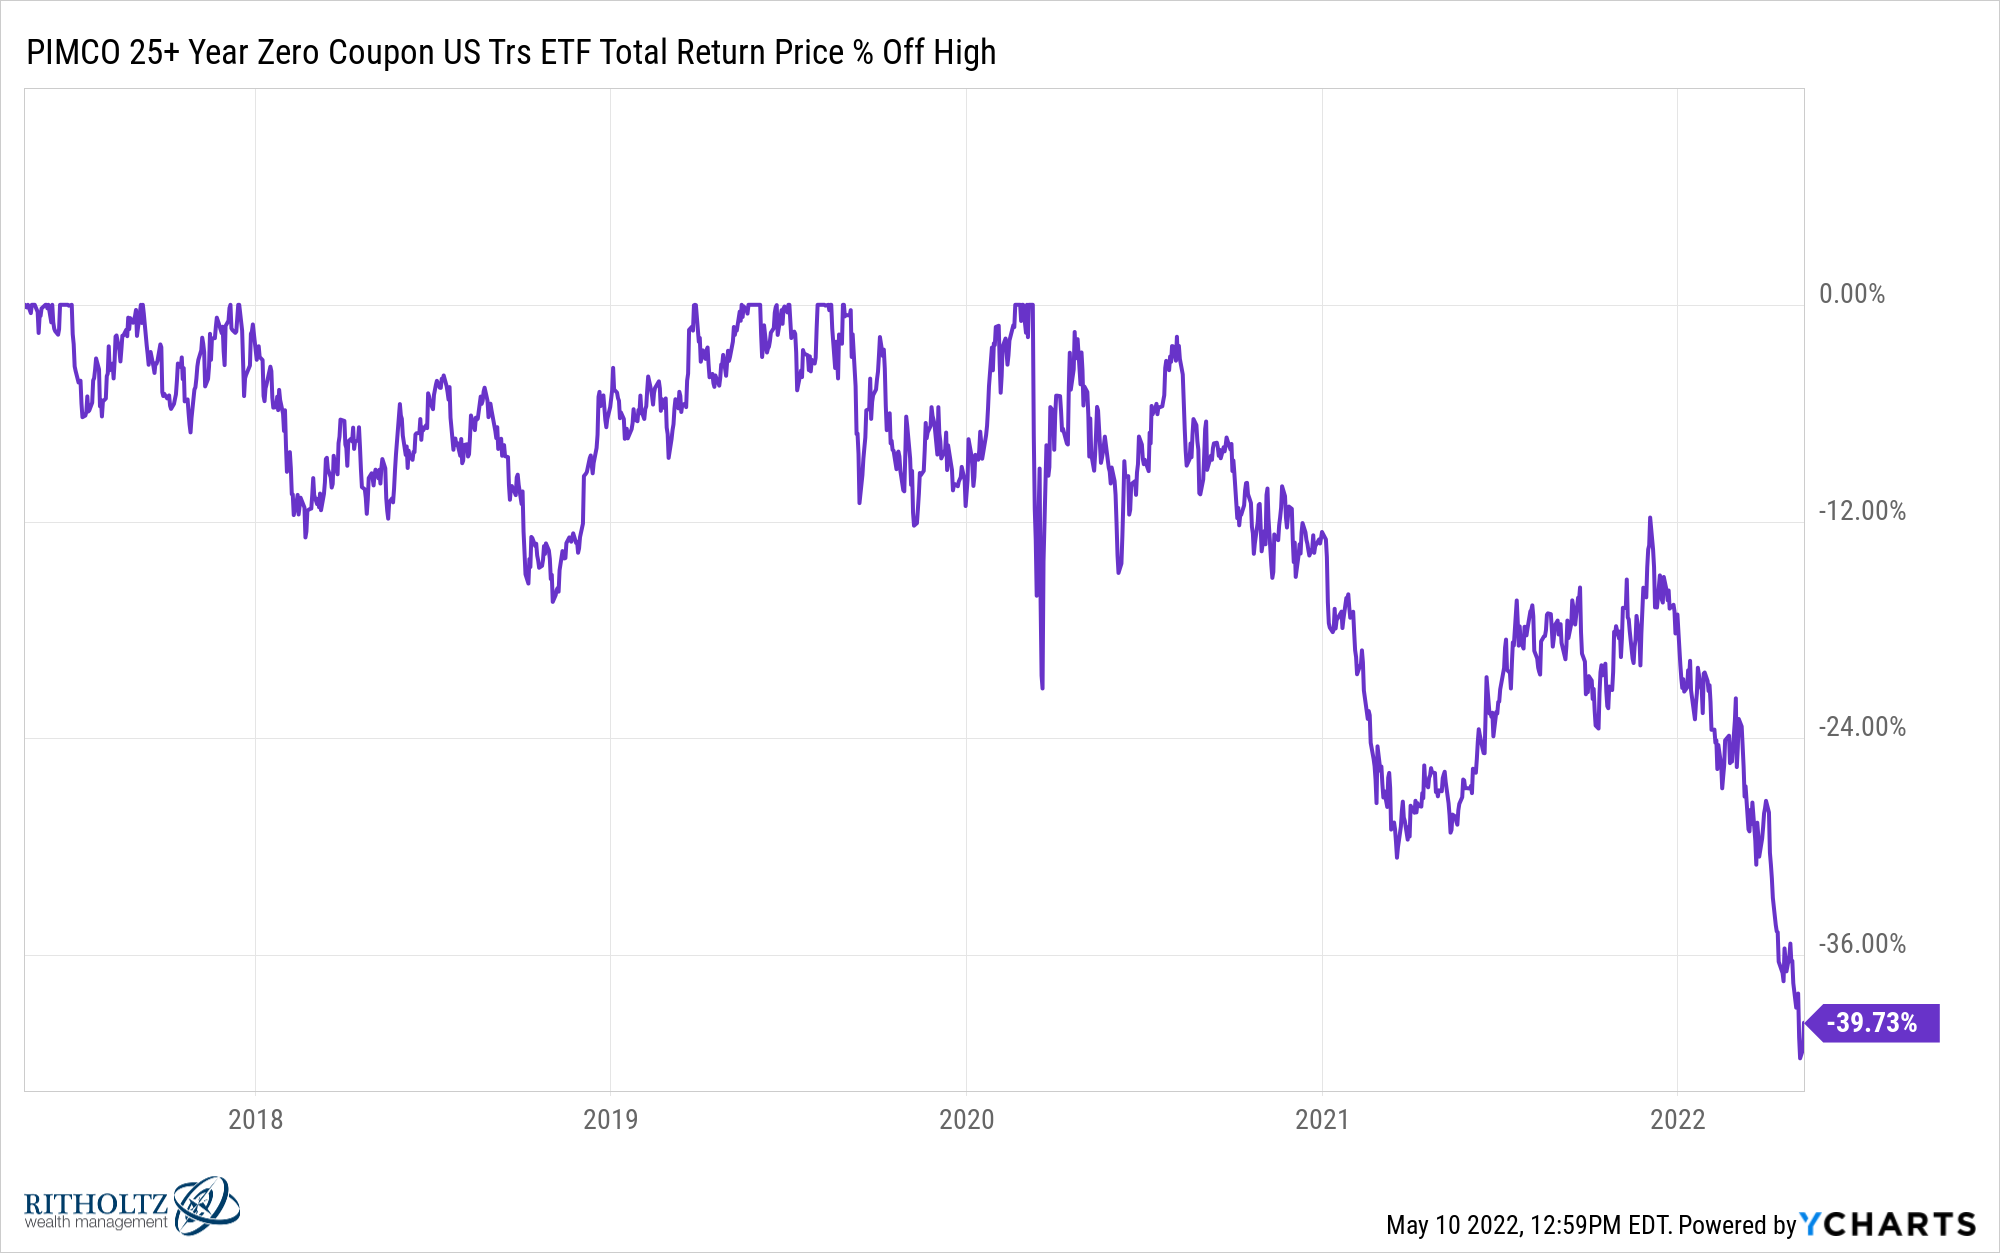
This is an all-out crash.
7. Value stocks are finally shining. Rising rates and higher inflation are helping at least one corner of the stock market — value stocks. But this regime shift has been none too kind to growth stocks:
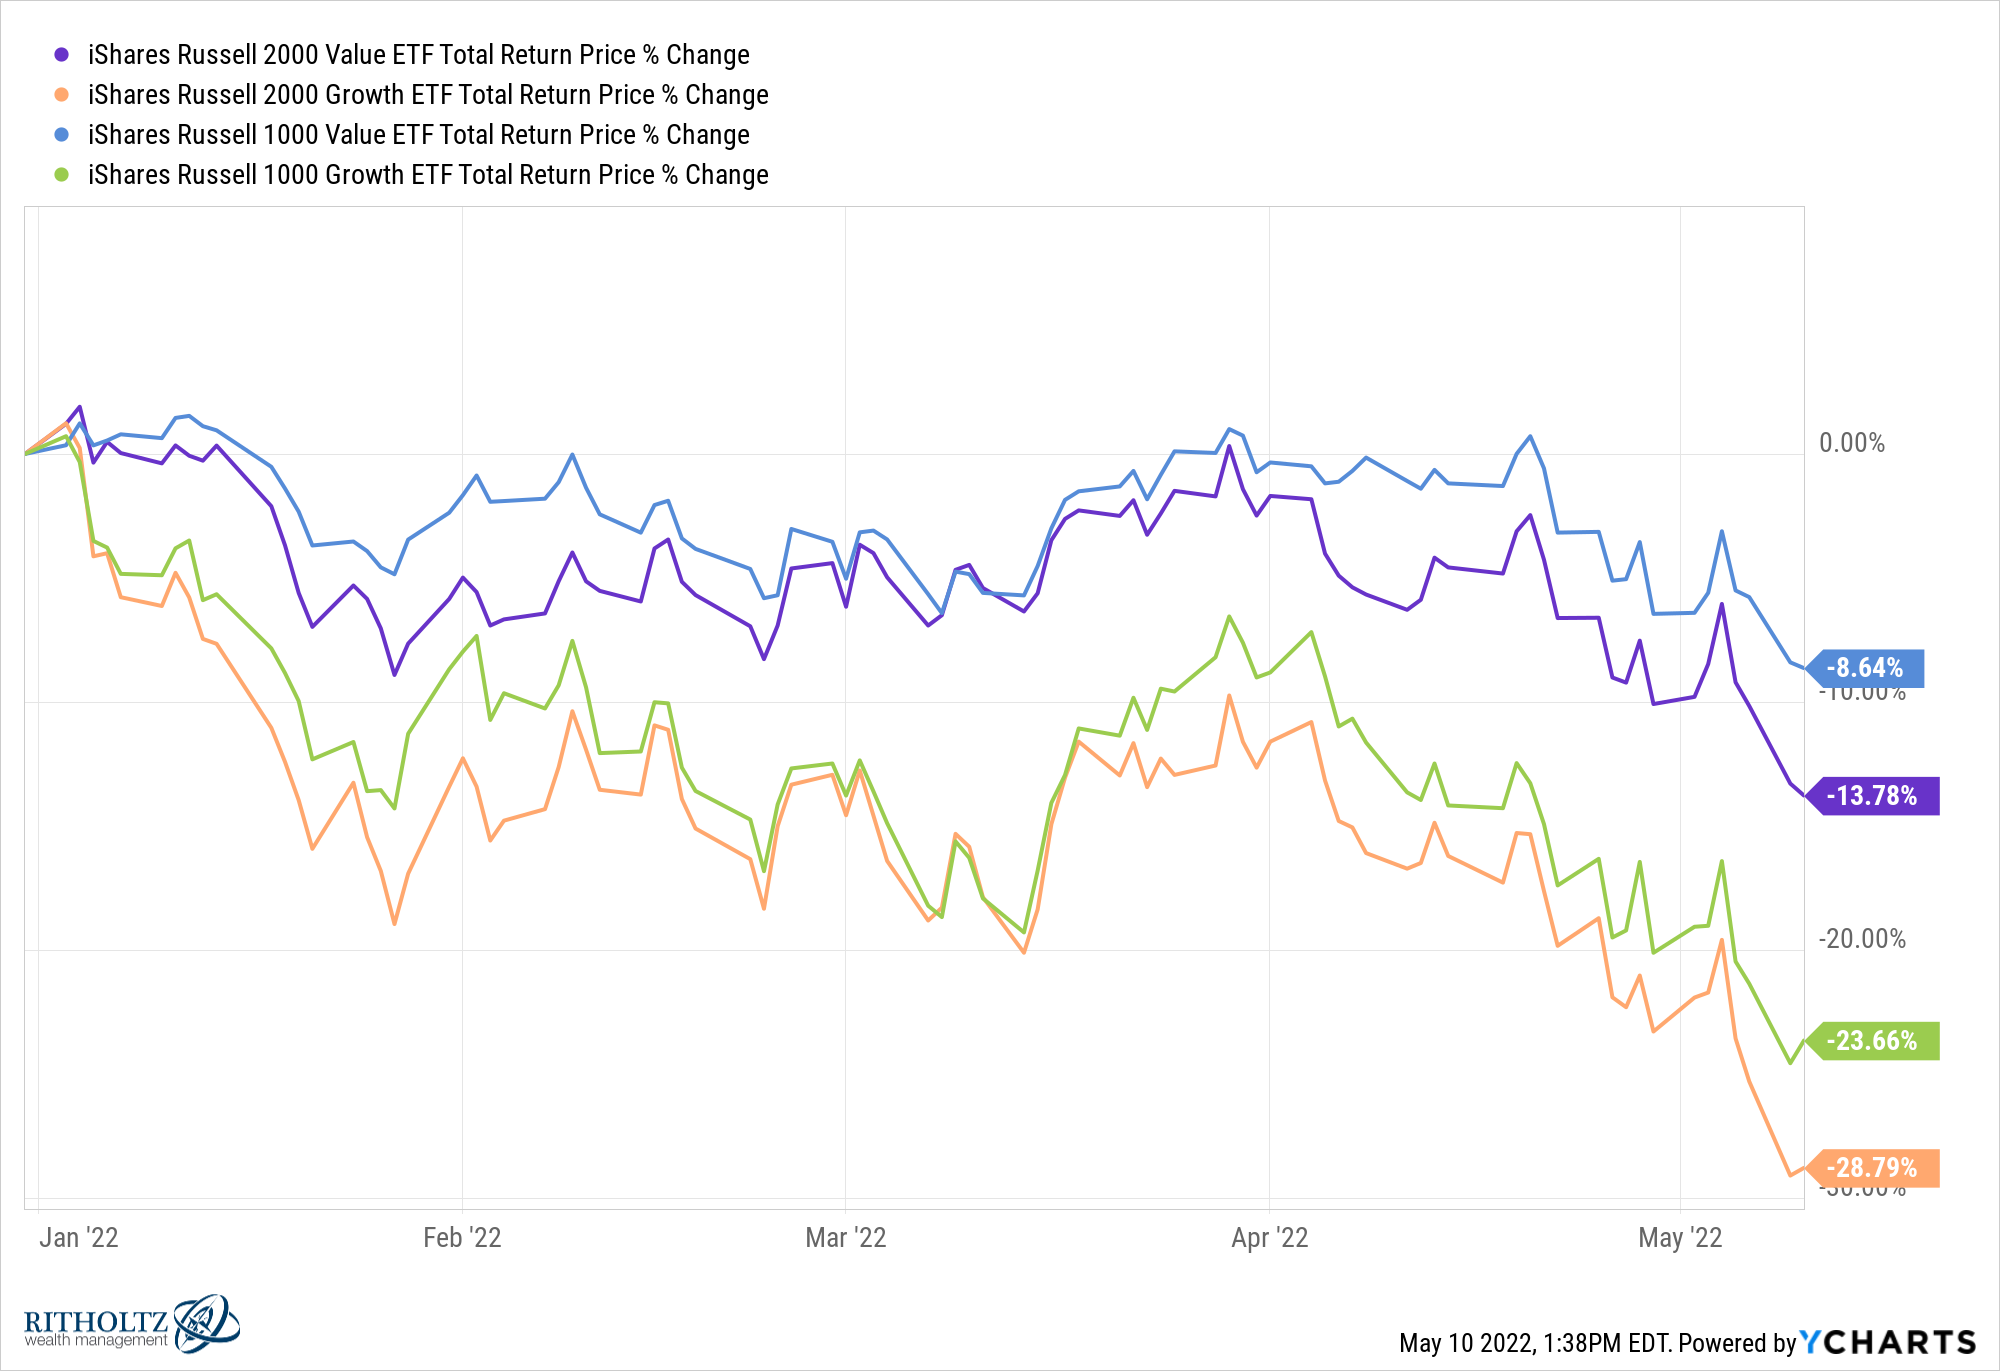
Both small and large cap value stocks are outperforming small and large cap growth stocks (as measured by the Russell indices) by 15% this year.
8. Energy stocks have seen a furious rally. Energy was one of the worst-performing sectors of the 2010s, rising just 3.3% per year from 2010-2019 versus 13.4% annual returns for the S&P 500. The Nasdaq 100 was up almost 18% per year during the teens.
Now look at the performance of energy and tech since the start of 2021:
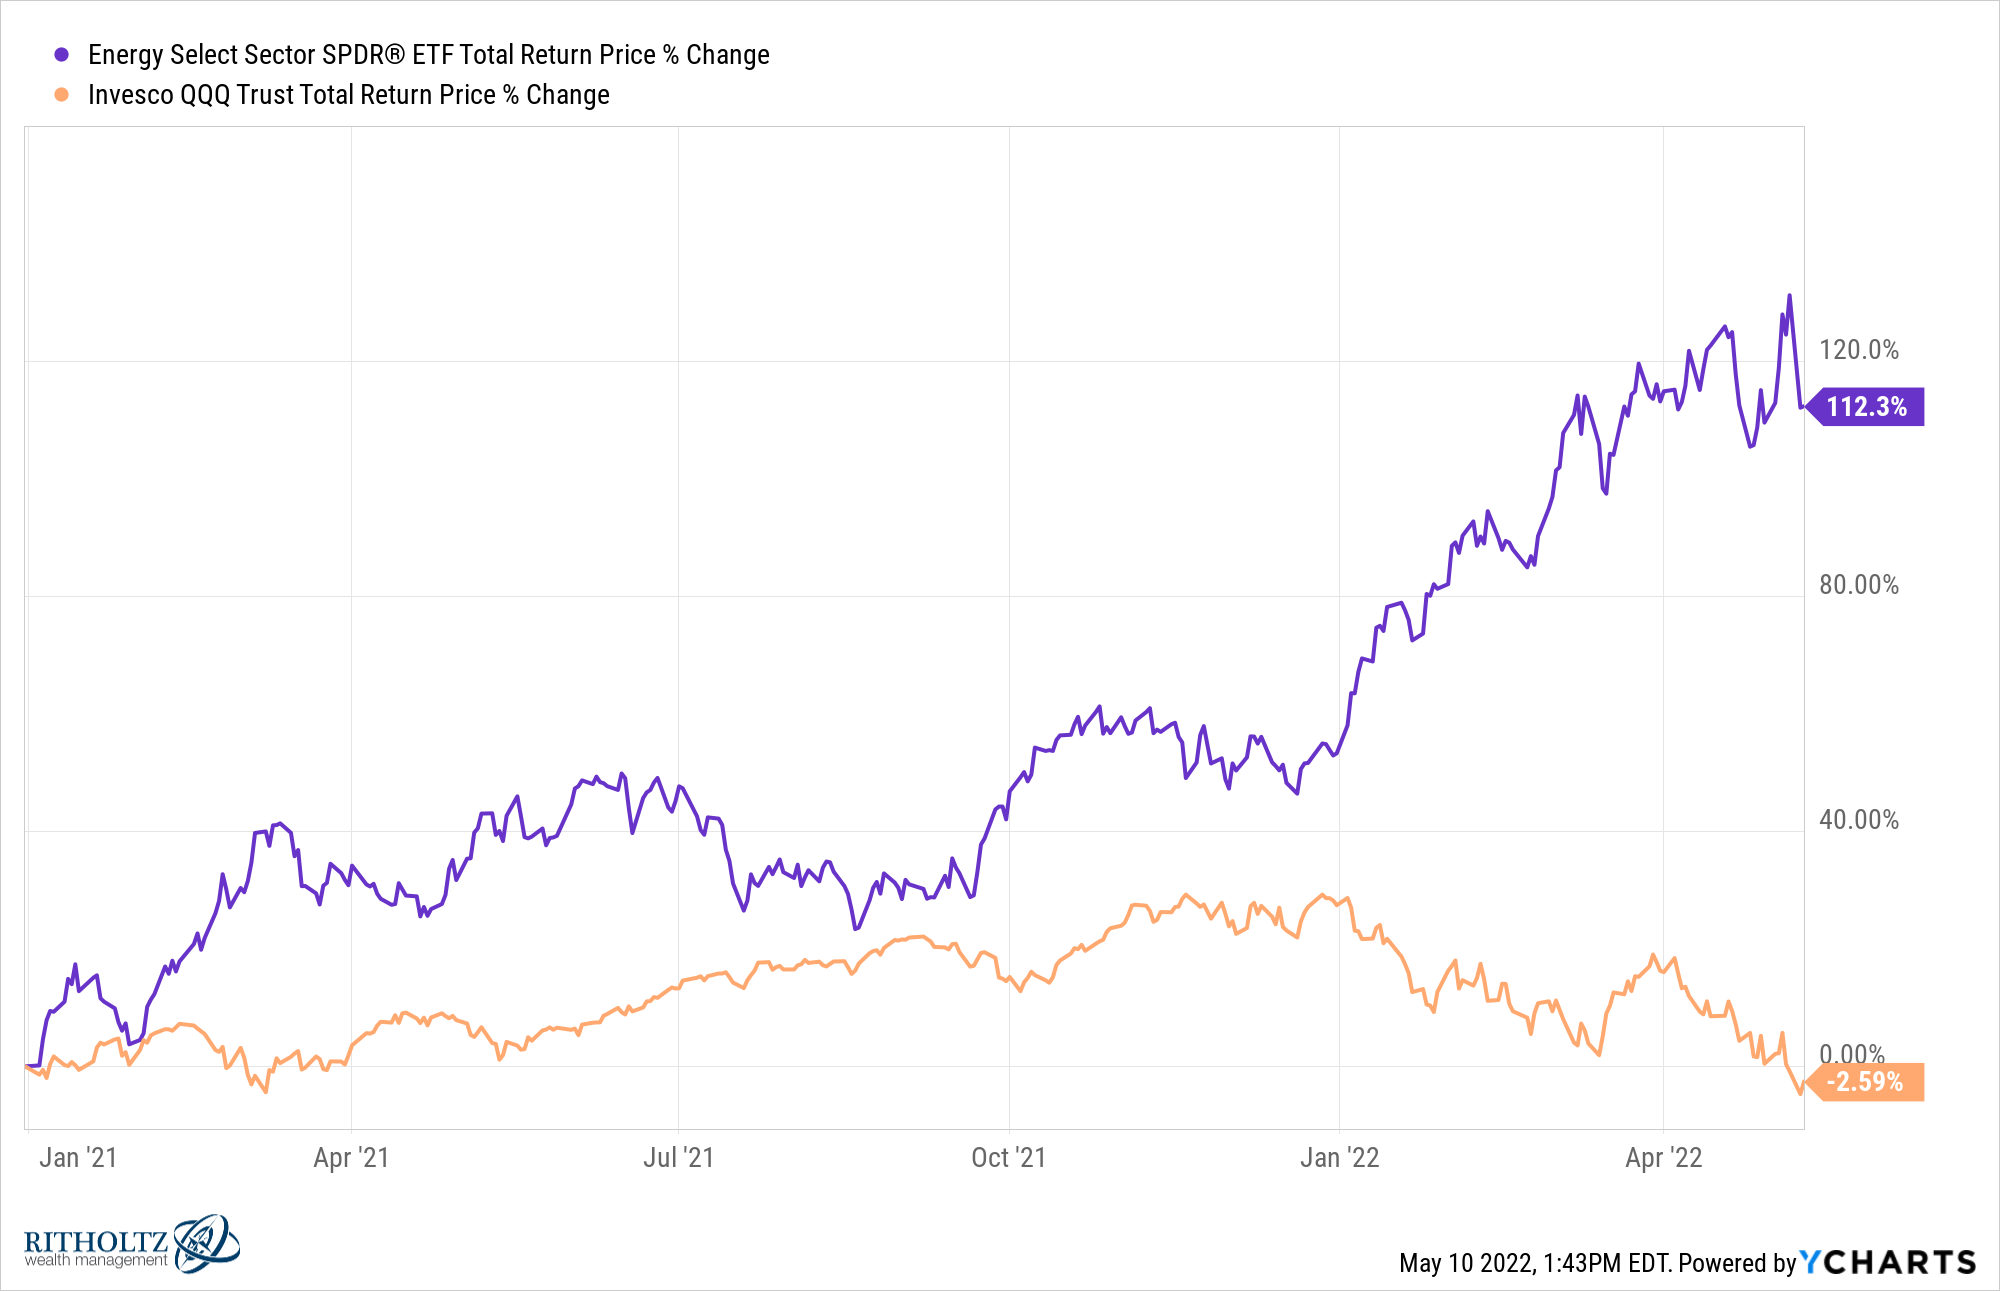
The Nasdaq 100 was up more than 27% last year but has given back all of the gains this year. Energy stocks continue to be one of the lone bright spots in a difficult market environment.
9. Fintech is getting routed. Coinbase, Robinhood and SoFi have collectively lost most than $125 billion in market cap since 2021:
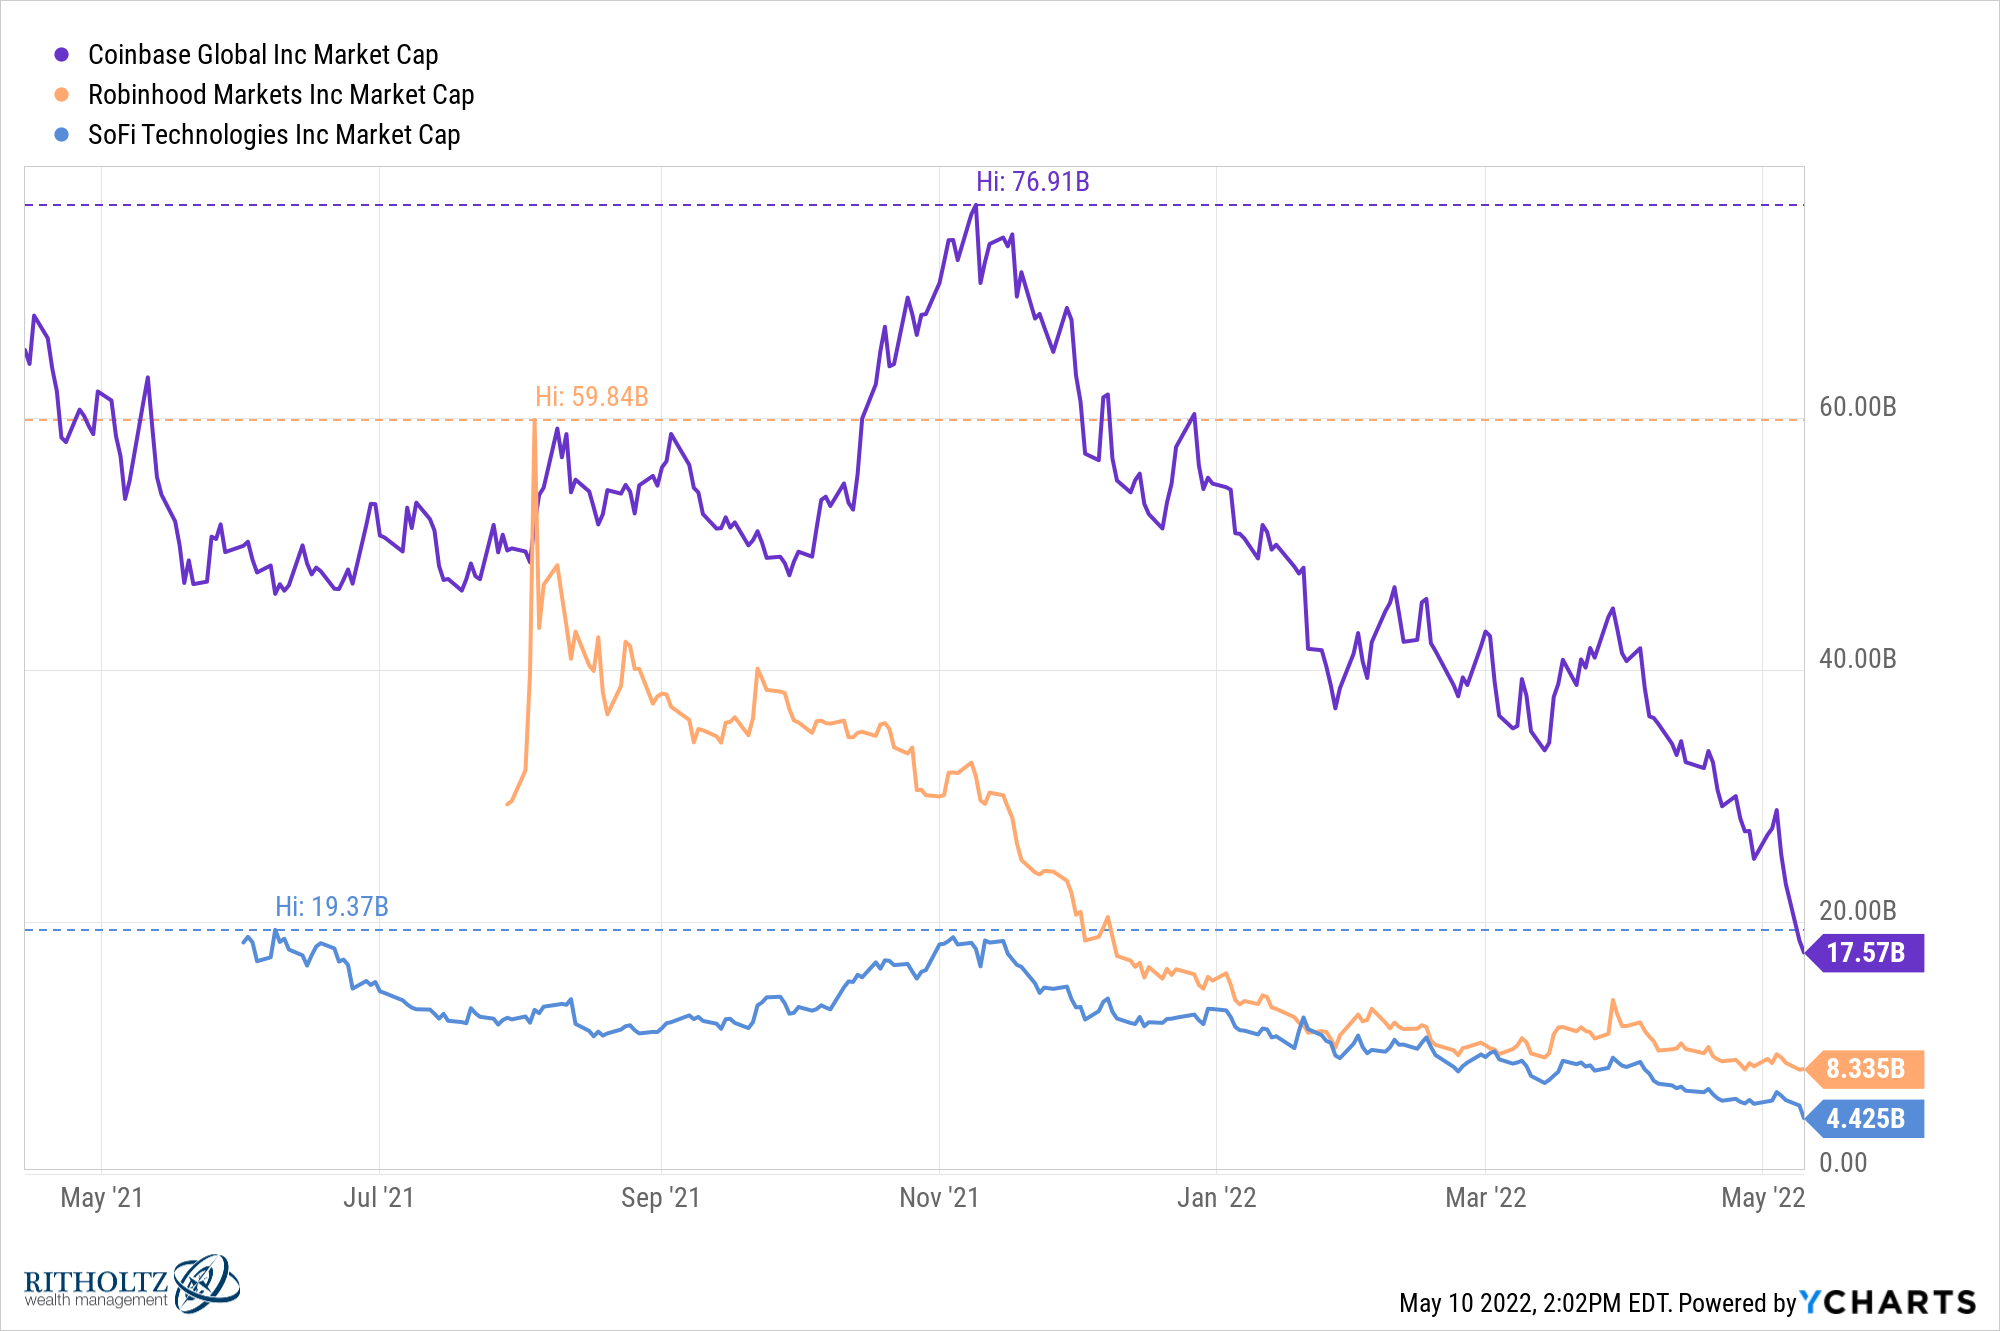
Meanwhile, Mastercard and Visa are still worth more than $720 billion combined. JP Morgan is still a $350 billion behemoth. Goldman Sachs and Morgan Stanley both sport market capitalizations over $100 billion.
I’m actually surprised how difficult it’s been for fintech companies to take market share from the legacy players.
10. Big tech joined the party. For while there it was mostly pandemic and hyper-growth stocks crashing. Now big tech is feeling the pain too:
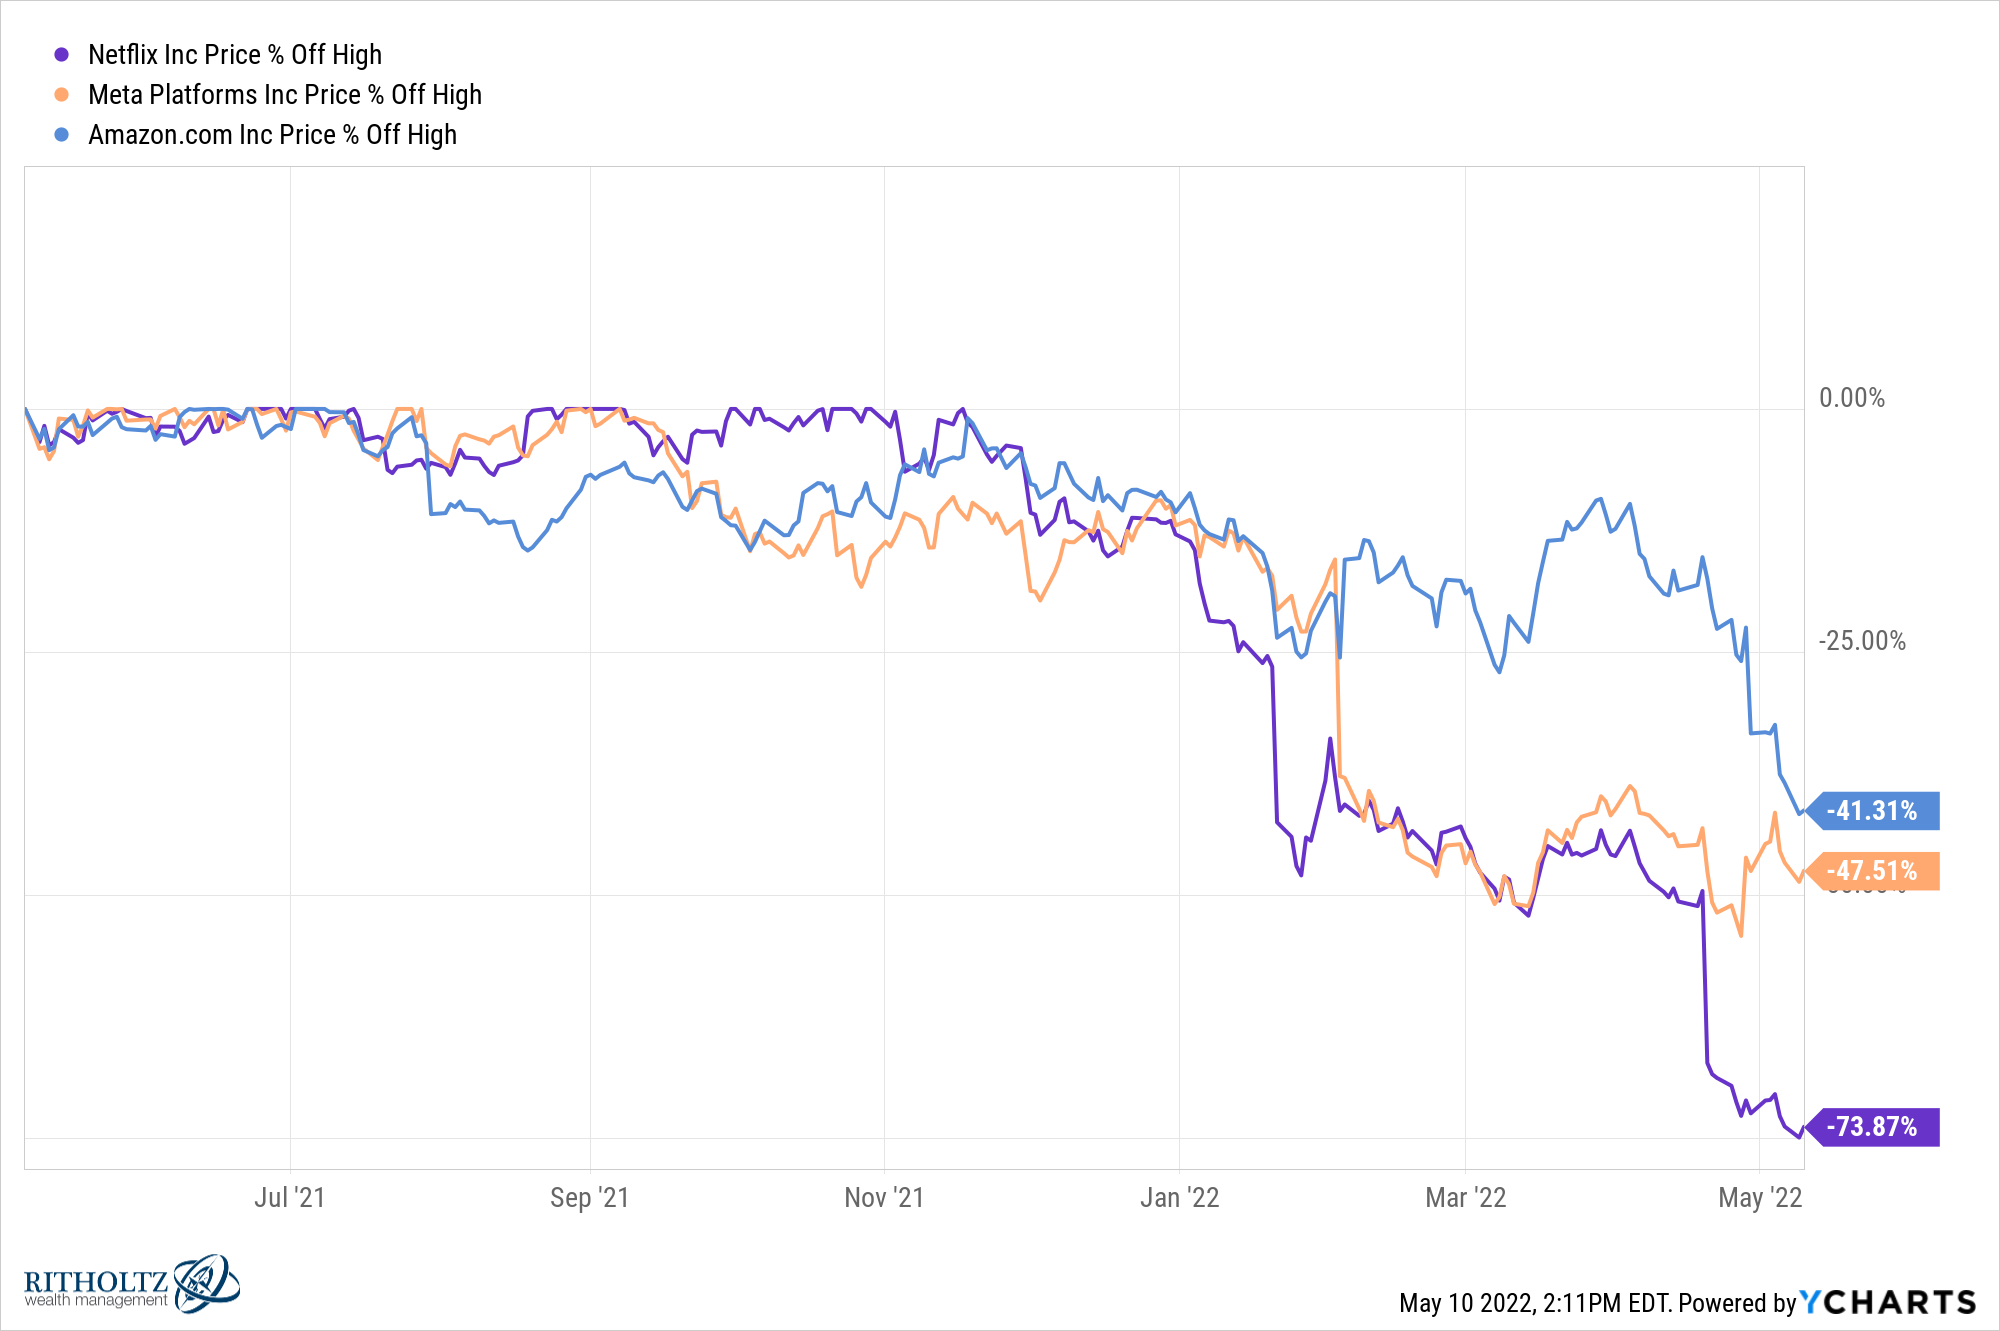
Netflix is the worst-performing stock in the S&P 500 this year. Amazon is in the midst of its biggest drawdown since the 2008 crash. Facebook hasn’t fallen this much since its first year as a public company.
It’s either scary or encouraging the overall market isn’t down more right now.
11. Everything is cyclical. Pundits spent a lot of time asking if Warren Buffett had lost his touch in 2020. It felt like the market had passed him by.
As usual, Buffett just had to wait:
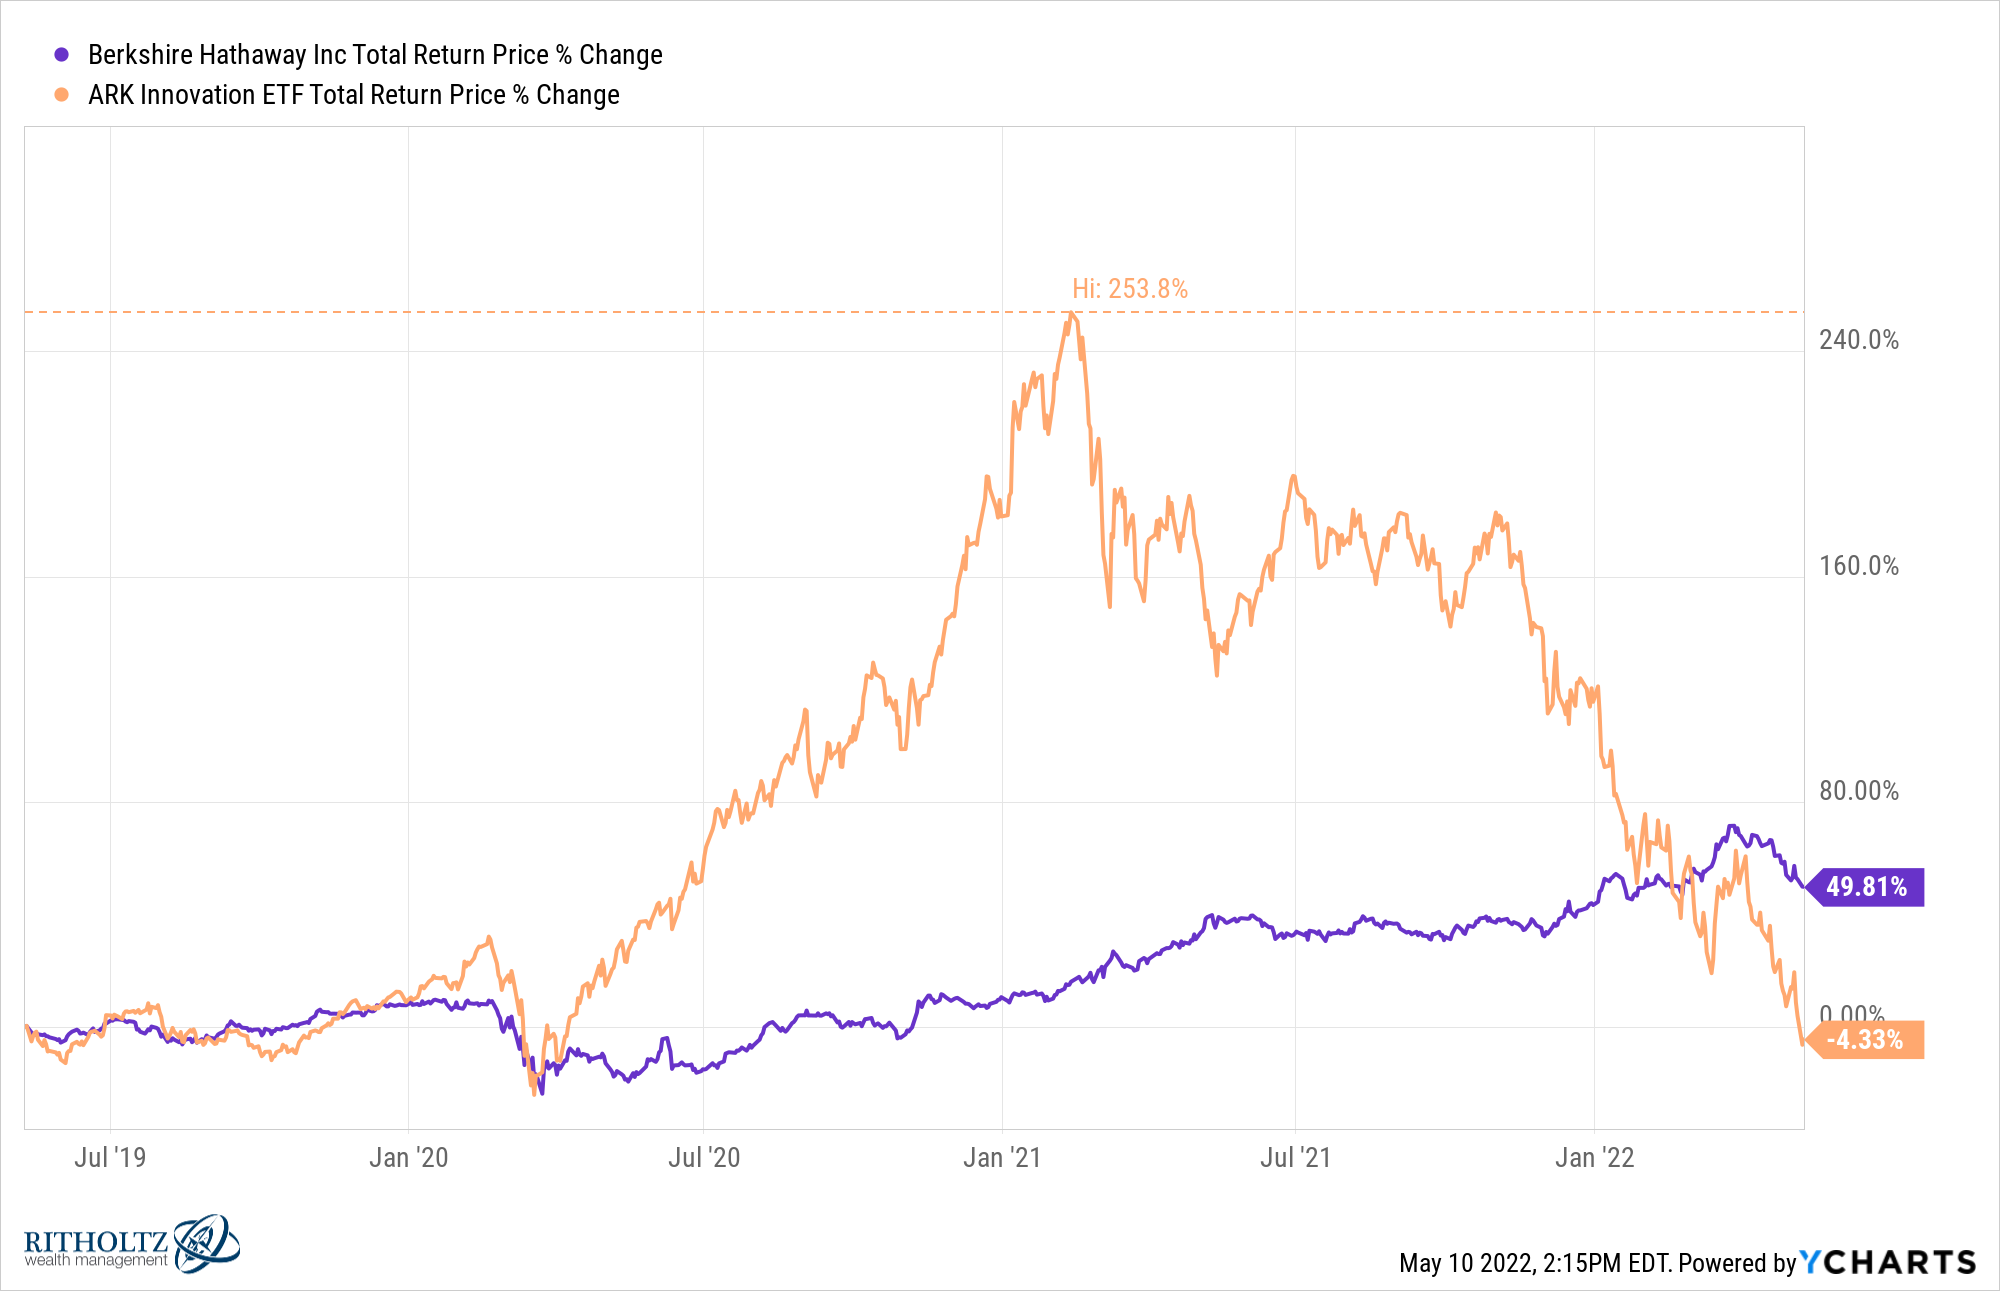
Berkshire Hathaway is one of the few large stocks that’s positive on the year.
12. This is a bizarre economy. The gap between job openings and the number of people who are unemployed is wild:
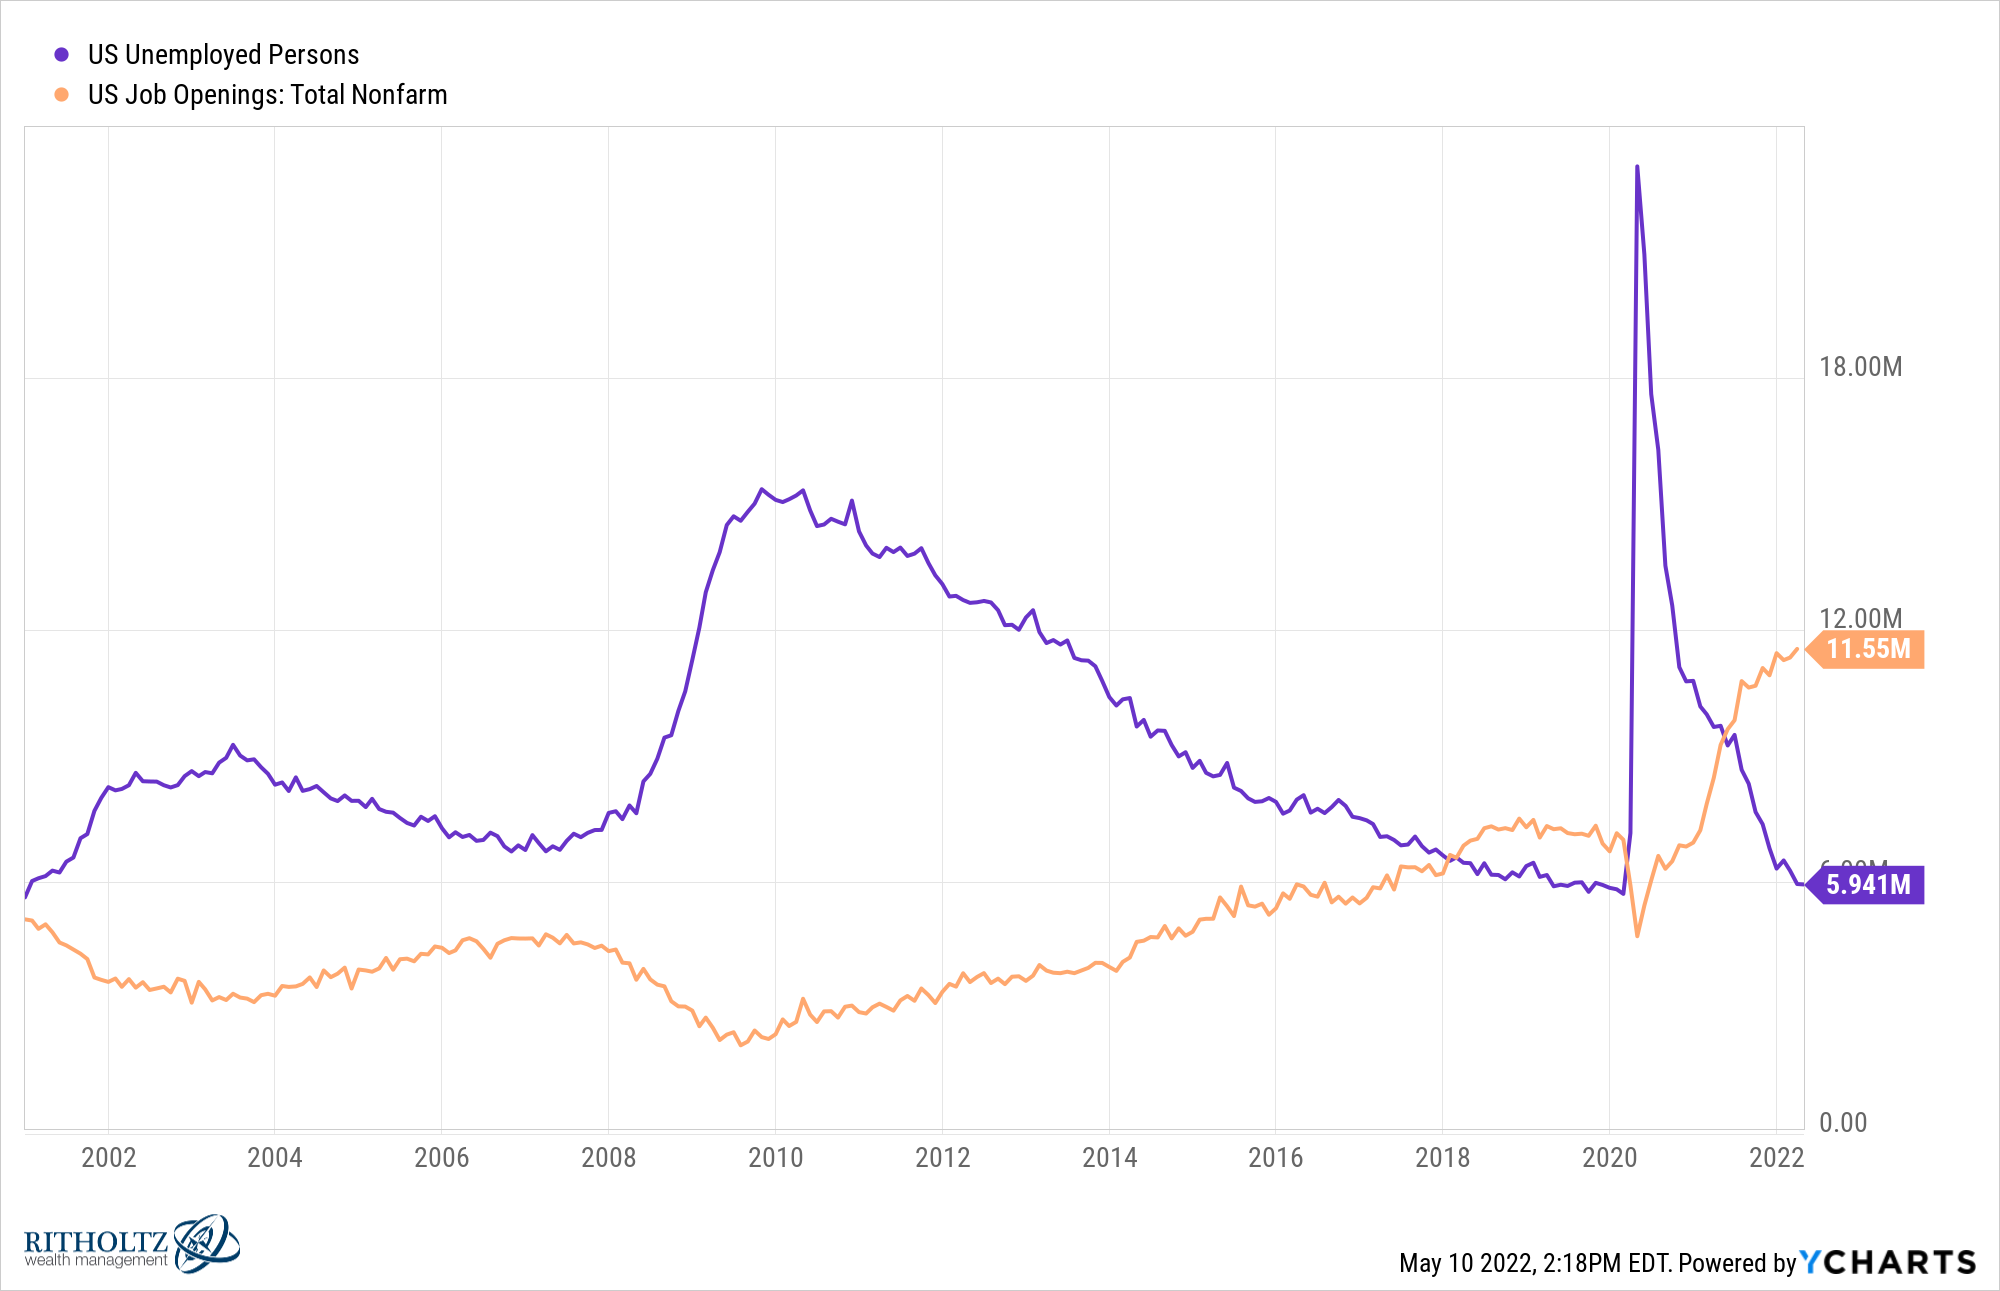
For the first 18 years or so of this century, there were more people who were unemployed than there were jobs available. Now we have a record number of job openings and not enough people to fill them.
Remember when people were worried about robots taking everyone’s jobs in the future?
13. We can’t finish houses. Here’s another gap that keeps getting wider:
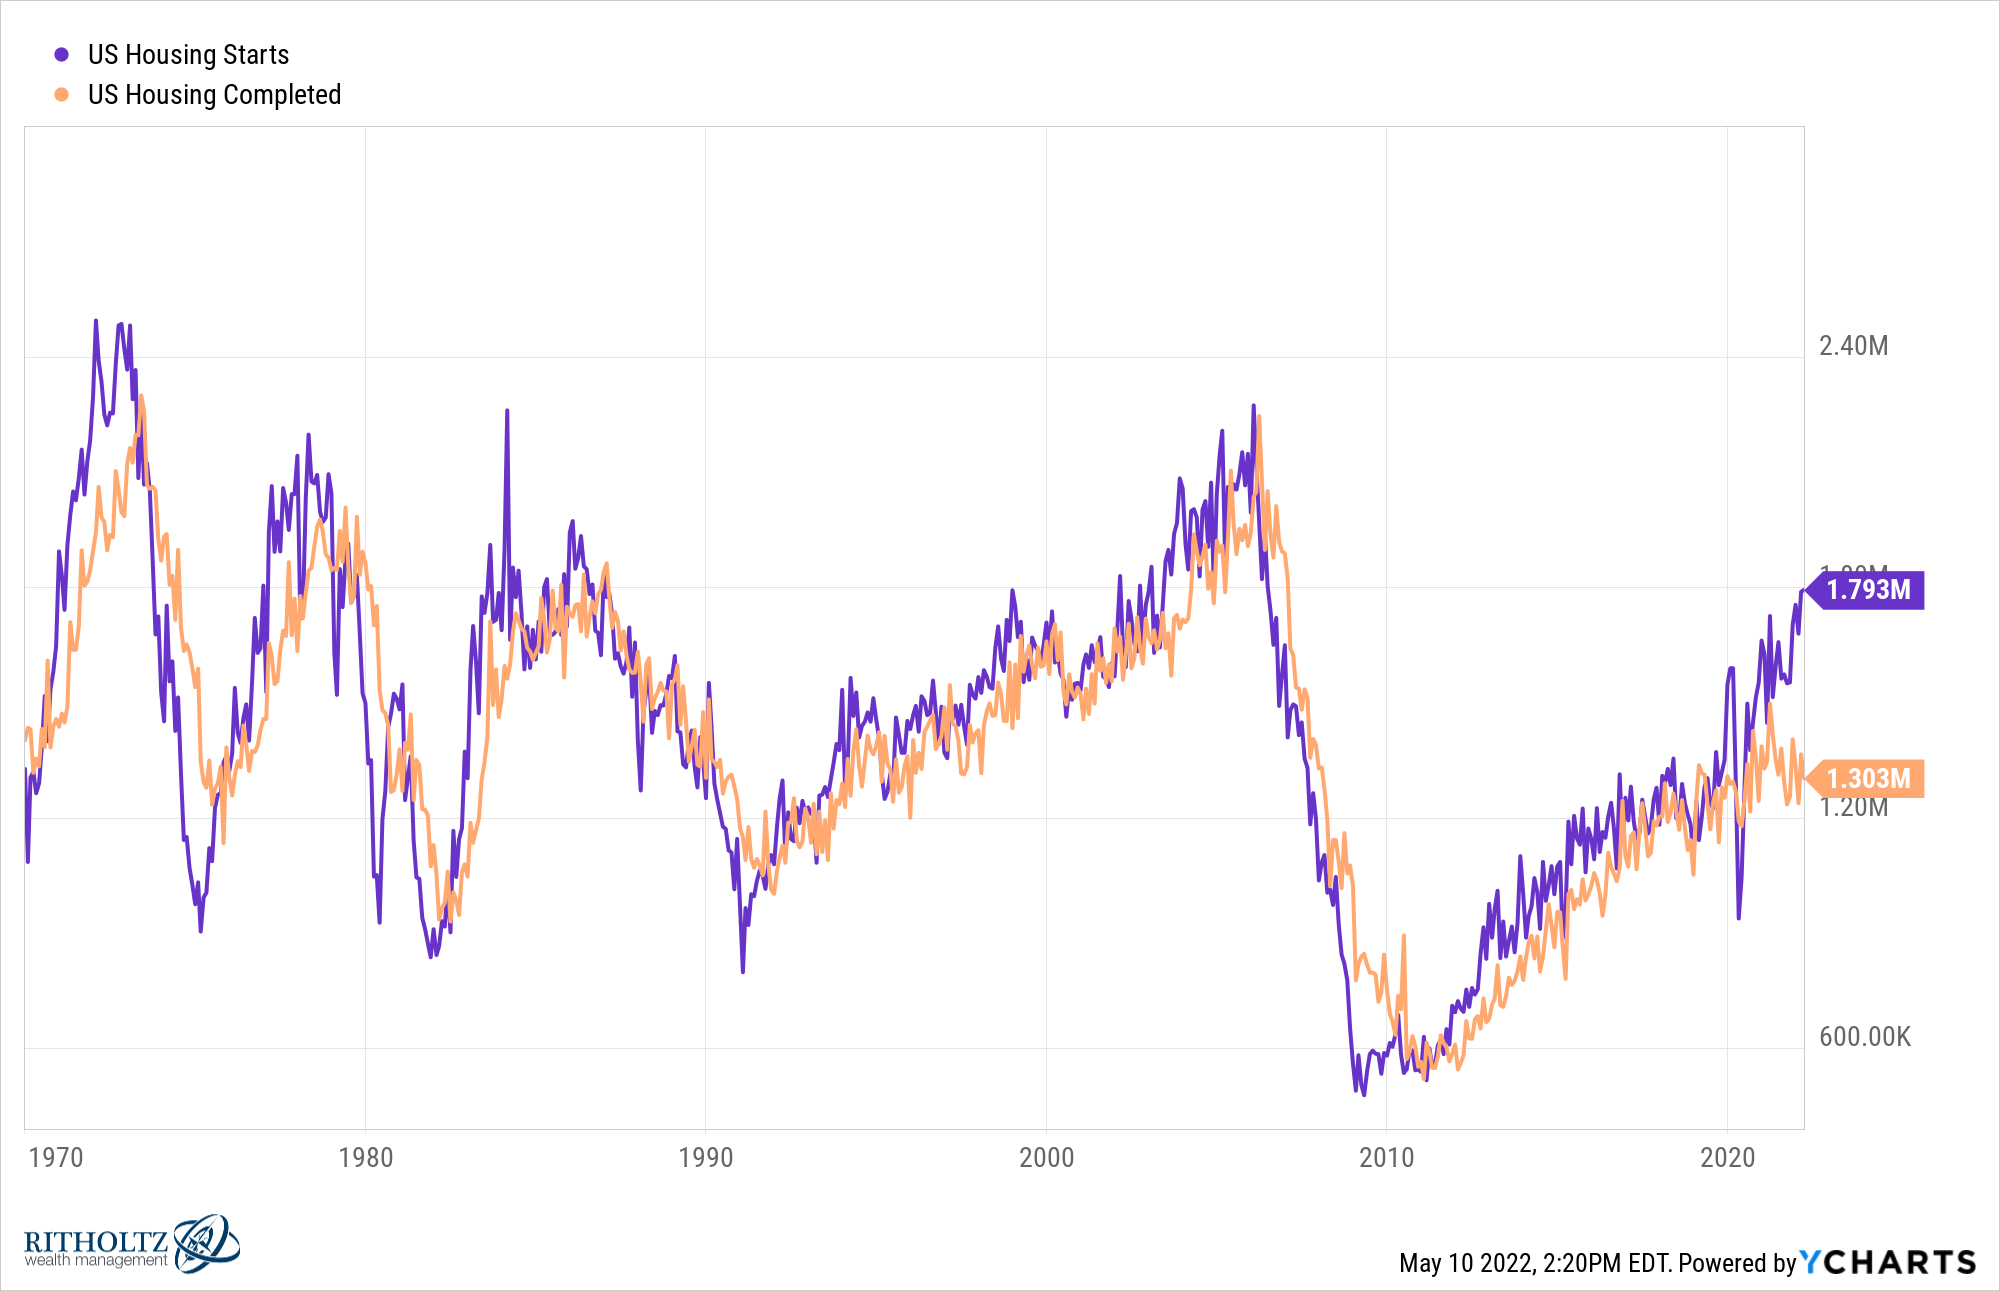
While it’s nice to see more houses are finally being built, homebuilders can’t finish the houses they started because of the labor shortage and supply crunch.
14. Mortgage rates are going nuts. This upward move in rates happened so fast:
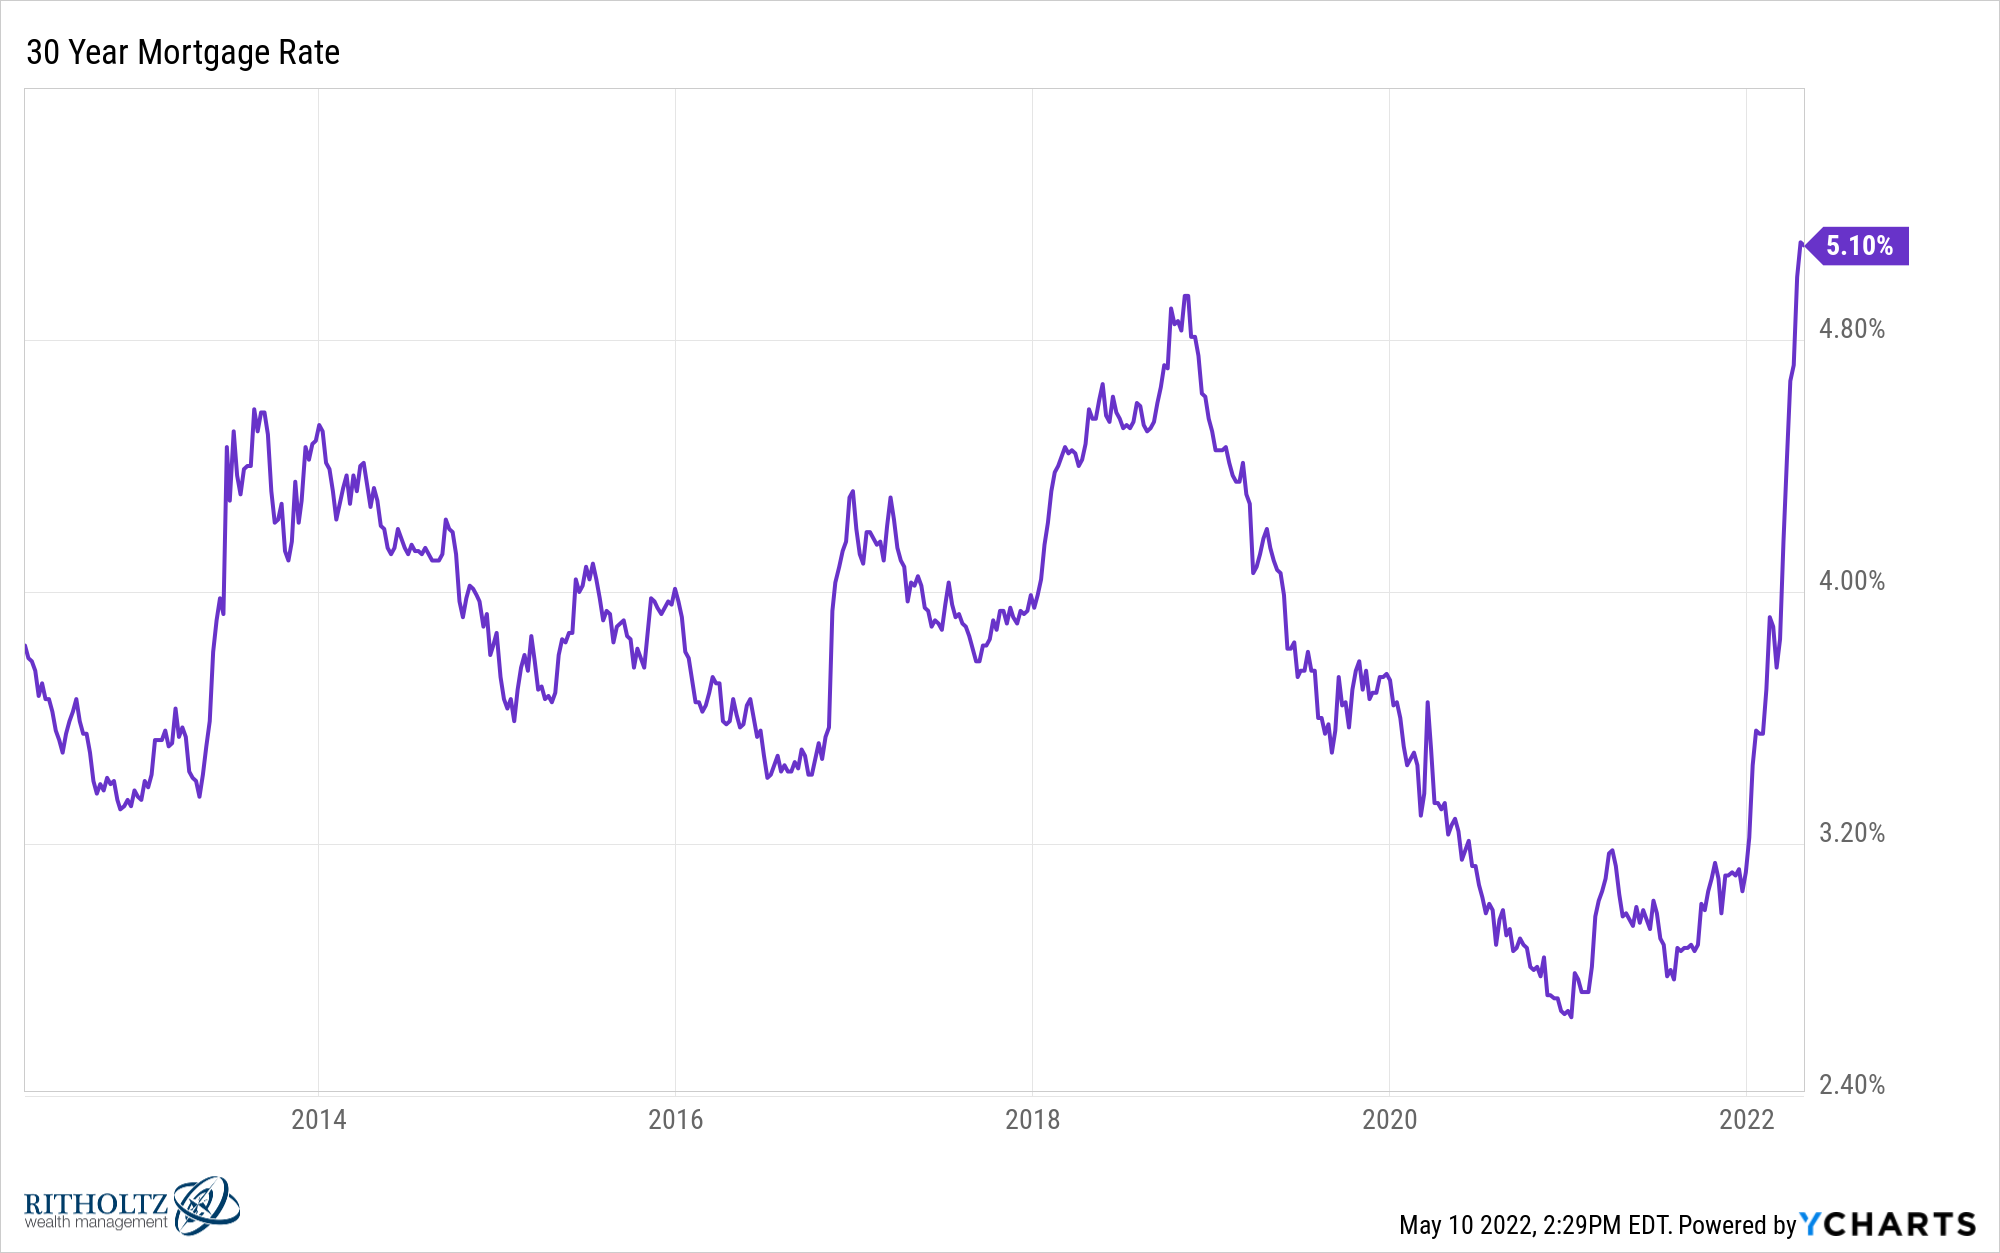
I feel like homebuyers haven’t even had enough time to consider the implications here and how this could impact prices, supply and demand for housing.
15. The dollar remains king. After every crisis, there are macro tourists who predict a collapse of the dollar or the coming end of the dollar as the global reserve currency.
Currencies tend to ebb and flow but the dollar is up more than 15% in the past year alone and shows no signs of going away anytime soon:
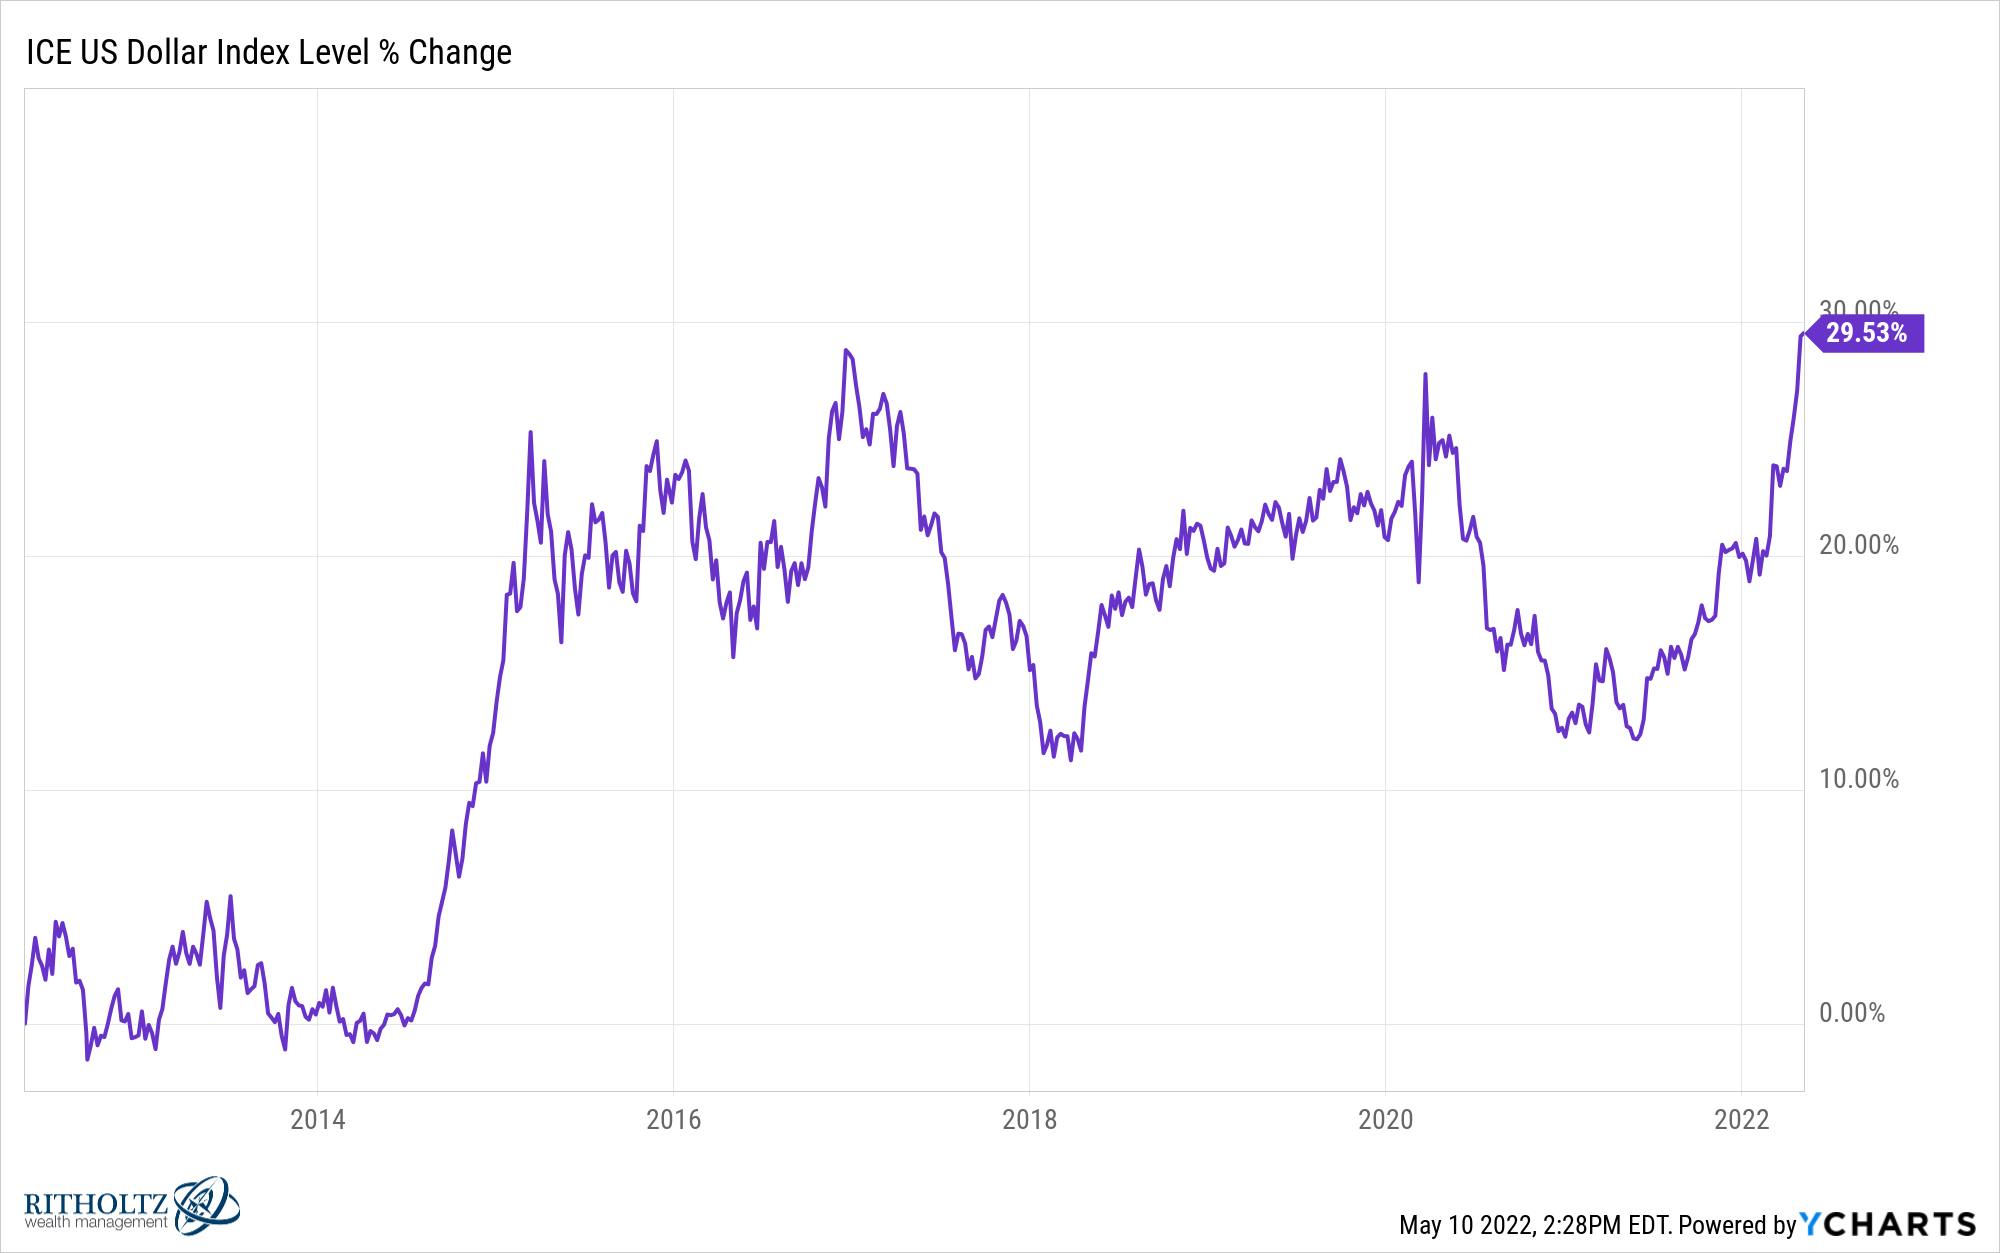
Maybe the dollar will lose its relevance someday but the anti-fiat currency crowd is currently taking an L on this one.
Further Reading:
Good News and Bad News About the Market
1It is worth noting this fund was up more than 40% from the start of 2020 through early March of that same year as rates fell off a cliff at the start of the pandemic.

