Interest rates are on the move.
Here’s a look at government bond yields moving up across the board:
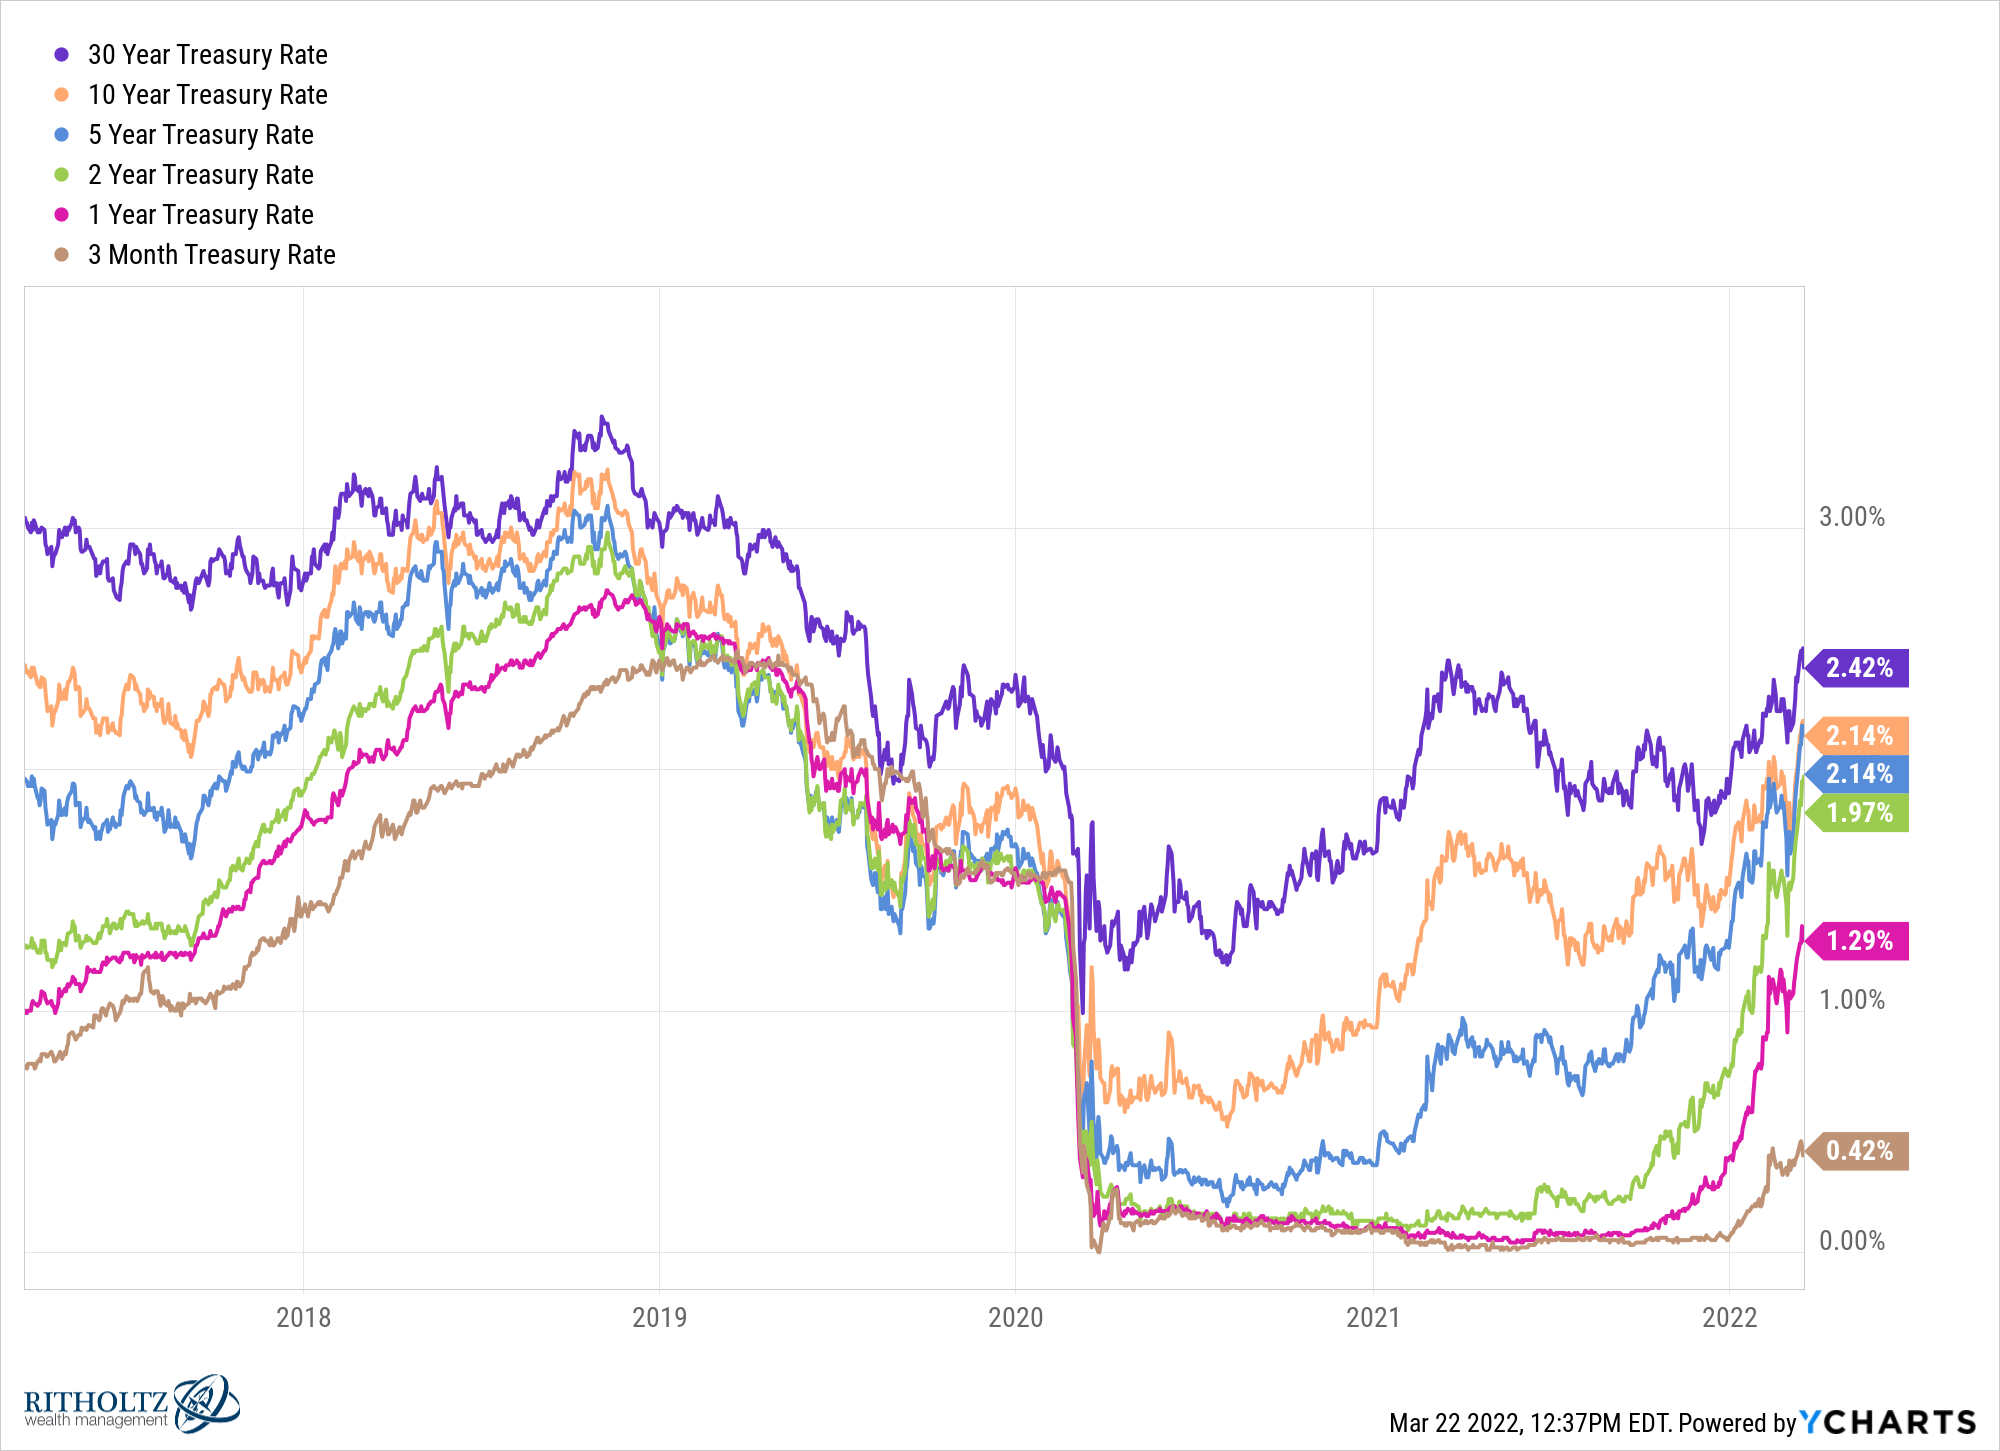
These yields still pale in comparison with the inflation rate but rates are now much higher than they were as recently as a few short months ago.
The biggest moves from a magnitude perspective have come at the 2 and 5 year maturities:
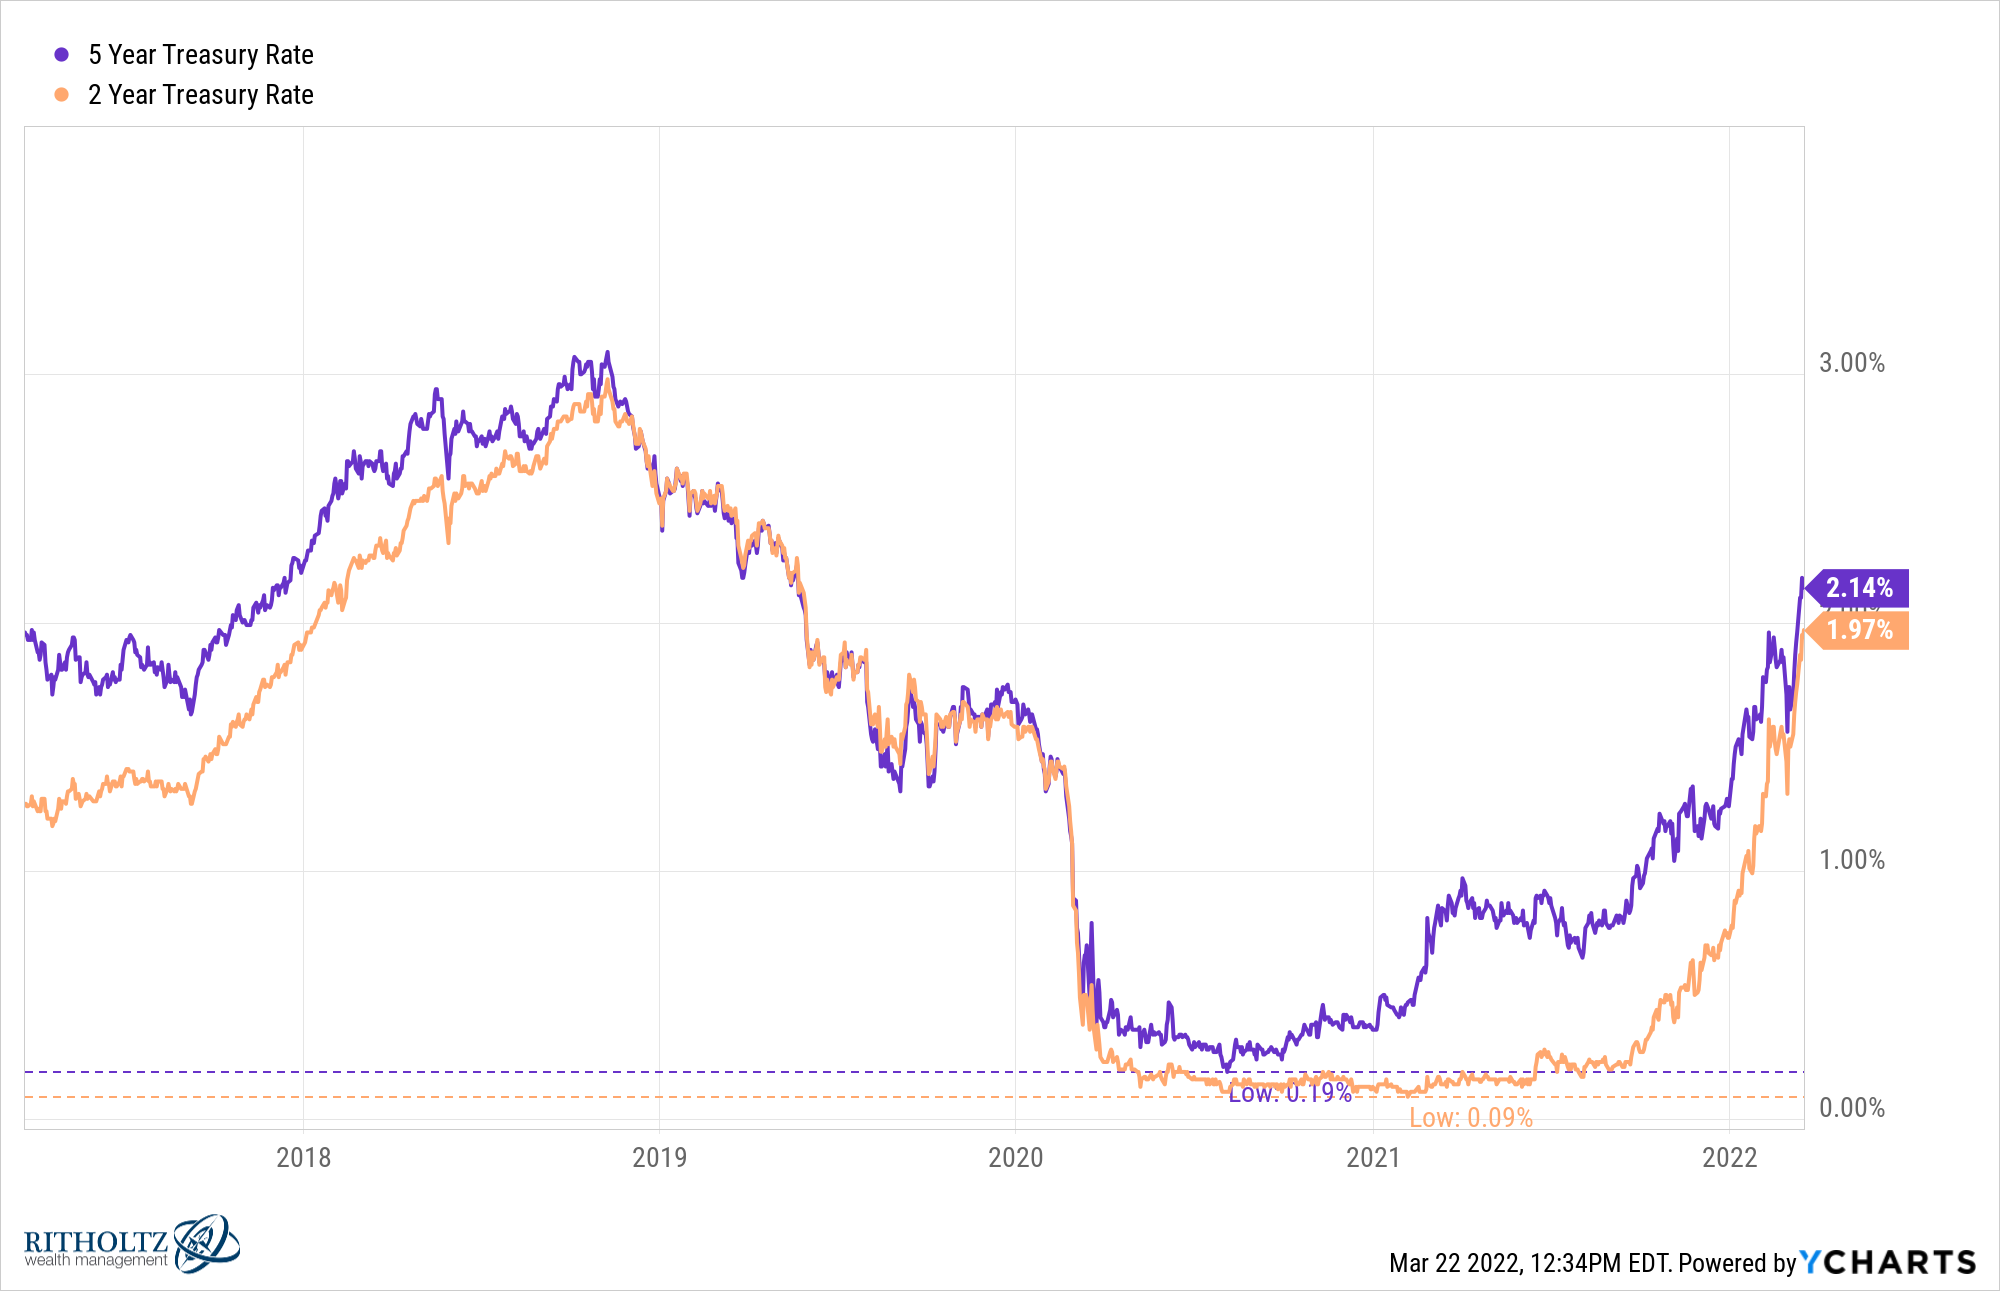
Both the swift decline and subsequent rise have created quite the U-shaped move here.
It’s also interesting to note the 5 year treasury has the same exact yield as the 10 year. The 2 year yield isn’t far behind.
According to the laws of risk and reward, it doesn’t make much sense that shorter-term debt has a similar yield to longer-term debt. This likely has more to do with the Fed’s rate hiking policy and/or the market’s view of the economy more than anything.
Wider spreads between long-term and short-term bonds lead to an upward sloping yield curve, which can indicate healthy economic prospects — most likely higher growth and inflation in the future. Narrower spreads lead to a flatter or even negatively sloped yield curve, which can indicate poor economic prospects — most likely lower growth and inflation.
Unfortunately, this relationship might be all out of whack because of the weird economic environment we reside in at the moment.
You can ruin pretty much any long-term yield chart by overlaying the inflation rate right now:
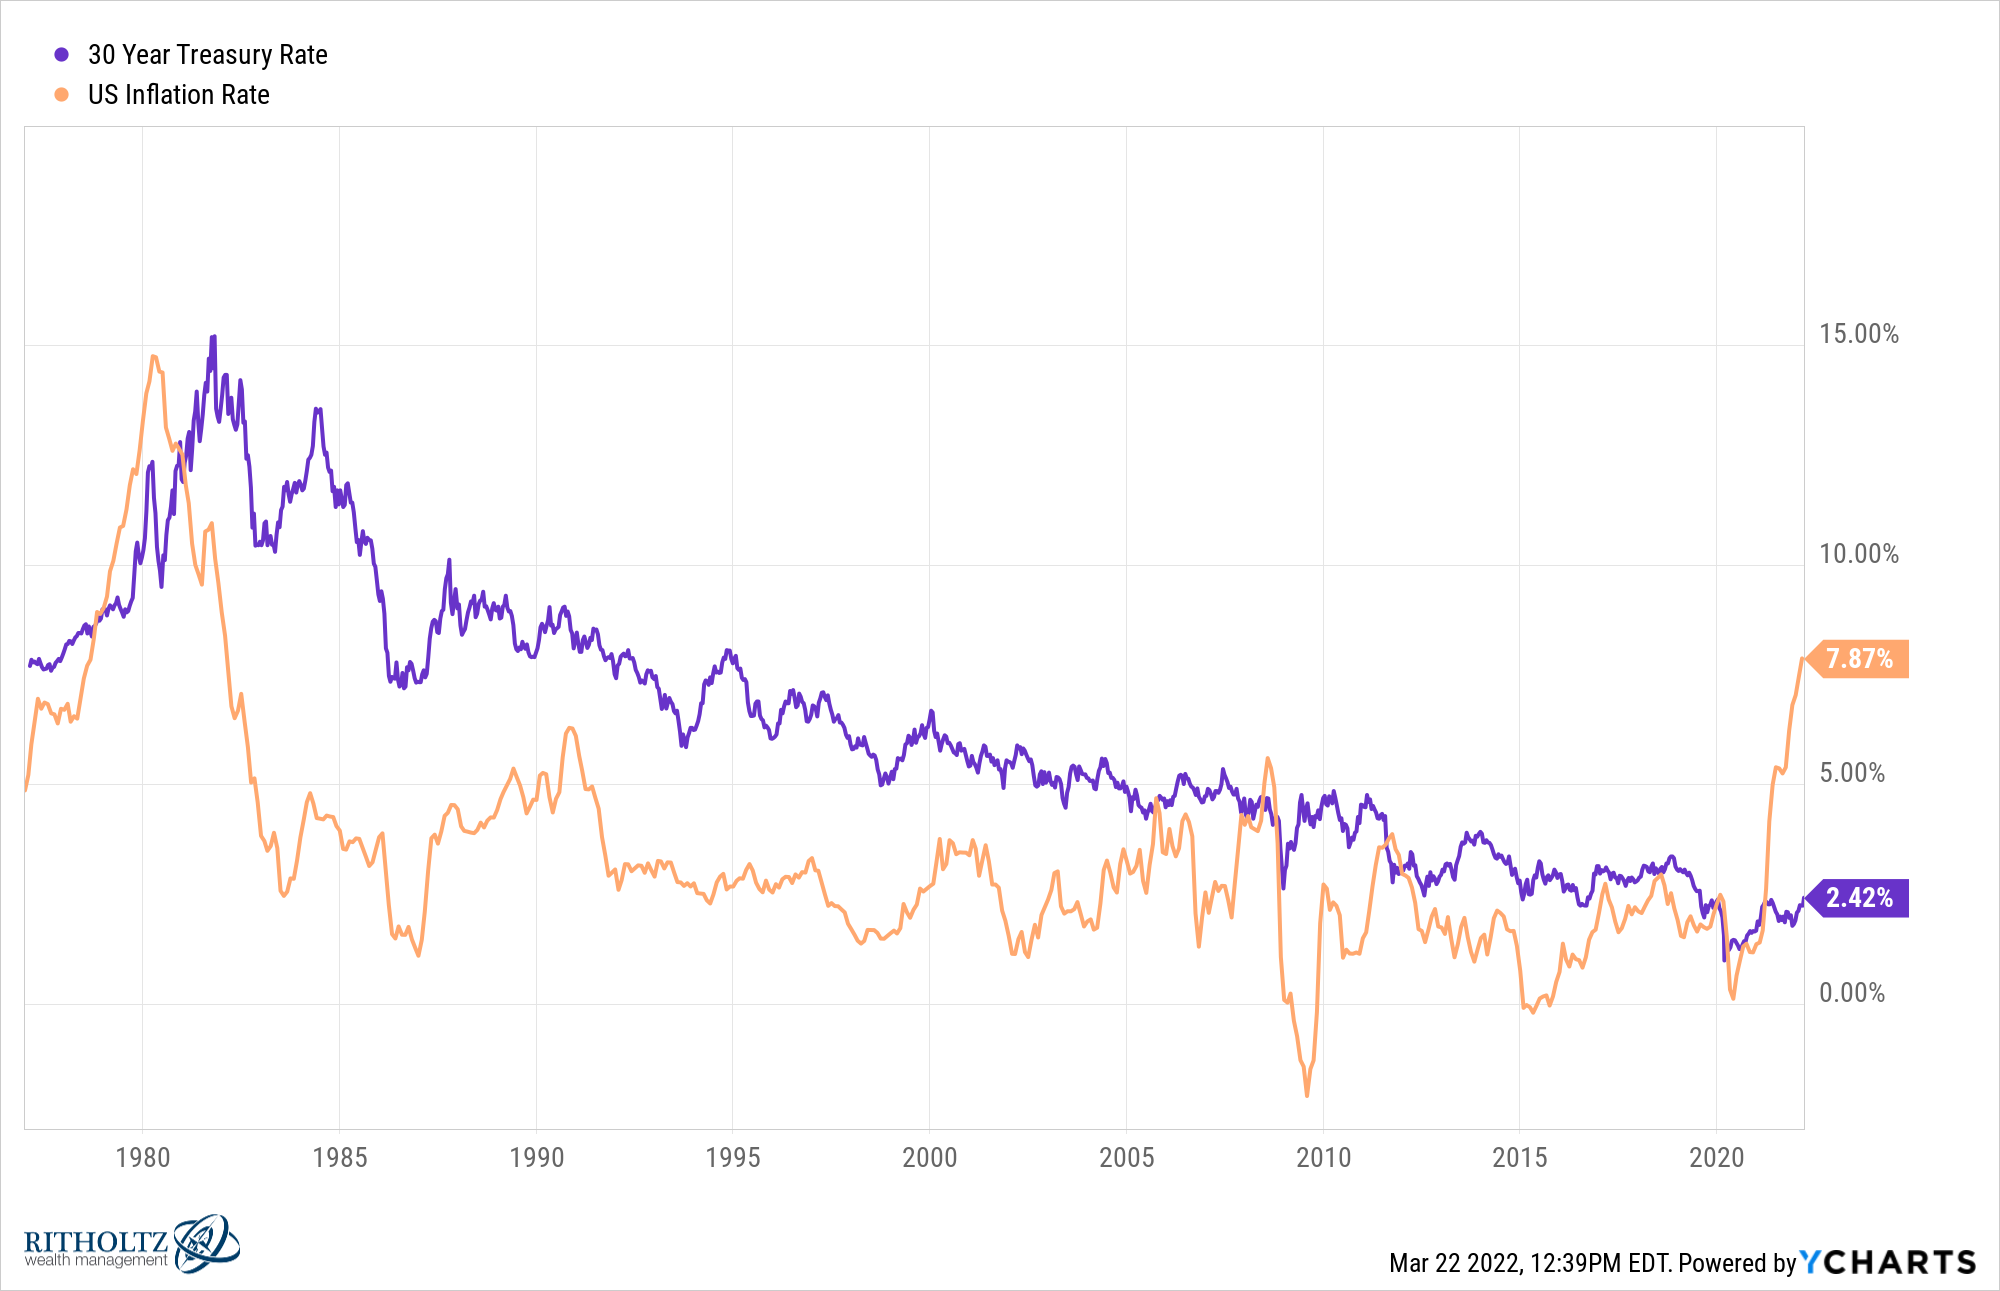
It’s rare for the inflation rate to be higher than the 30 year treasury rate.
Going back to the 1970s, the highest inflation has gone over the 30 year yield was the last time inflation was this high — in the early-1980s. In the spring of 1980, inflation was running at more than 4% higher than the 30 year treasury. Of course at that time inflation was almost 15% while long-term government bonds were yielding more than 10%.
Right now inflation is 5.5% higher than 30 year yields. You probably have to go back to the aftermath of World War II to see a spread this high. It’s certainly unlike anything investors have seen in many decades.
So what does this all mean for you as an investor?
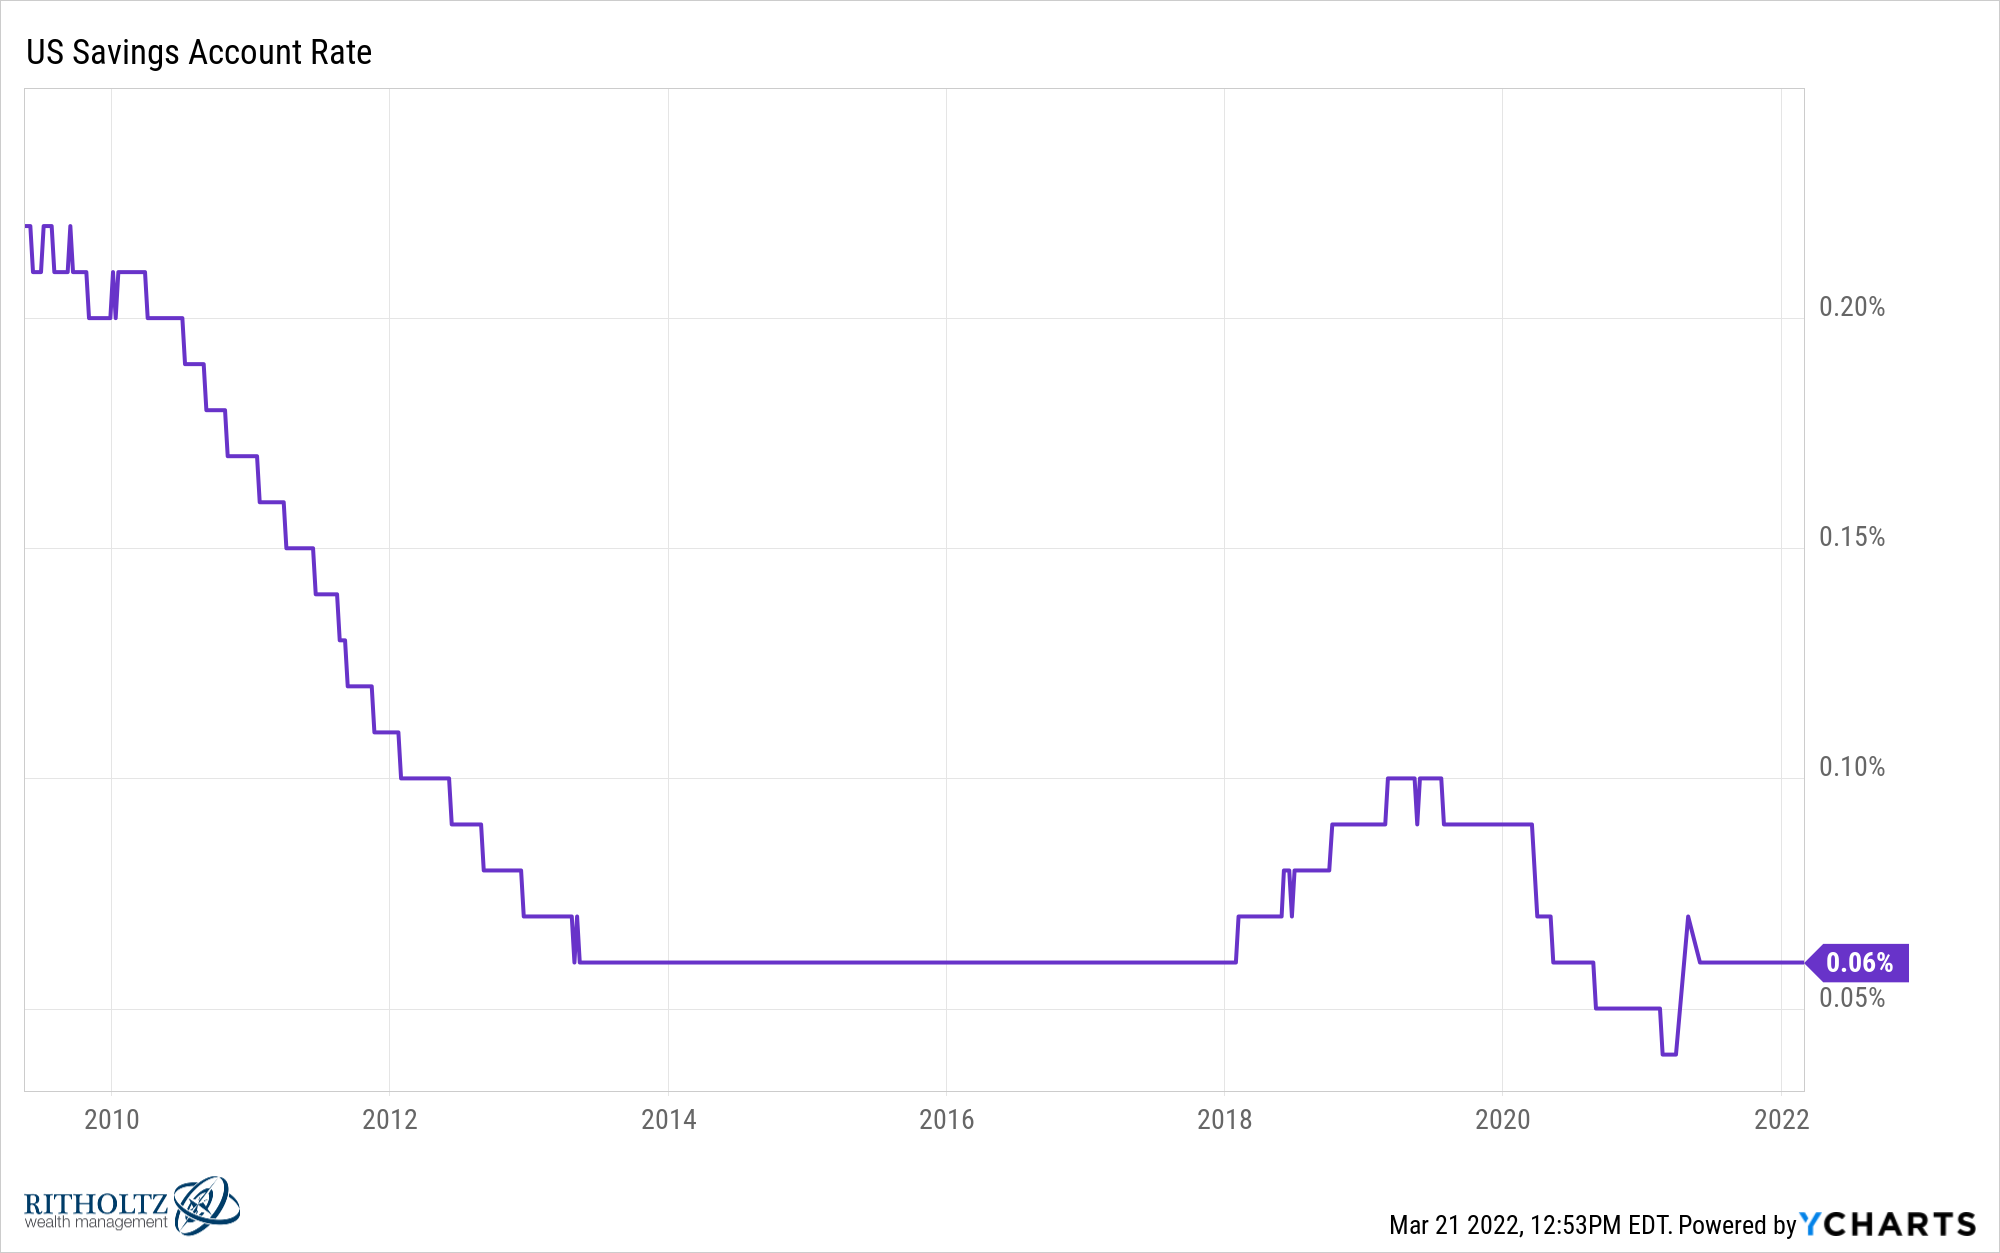
You’re probably still not going to see much of a bump in your savings account just yet. The Fed’s talking points have helped drive up yields but they have still only raised their benchmark rate a quarter of a percentage point:
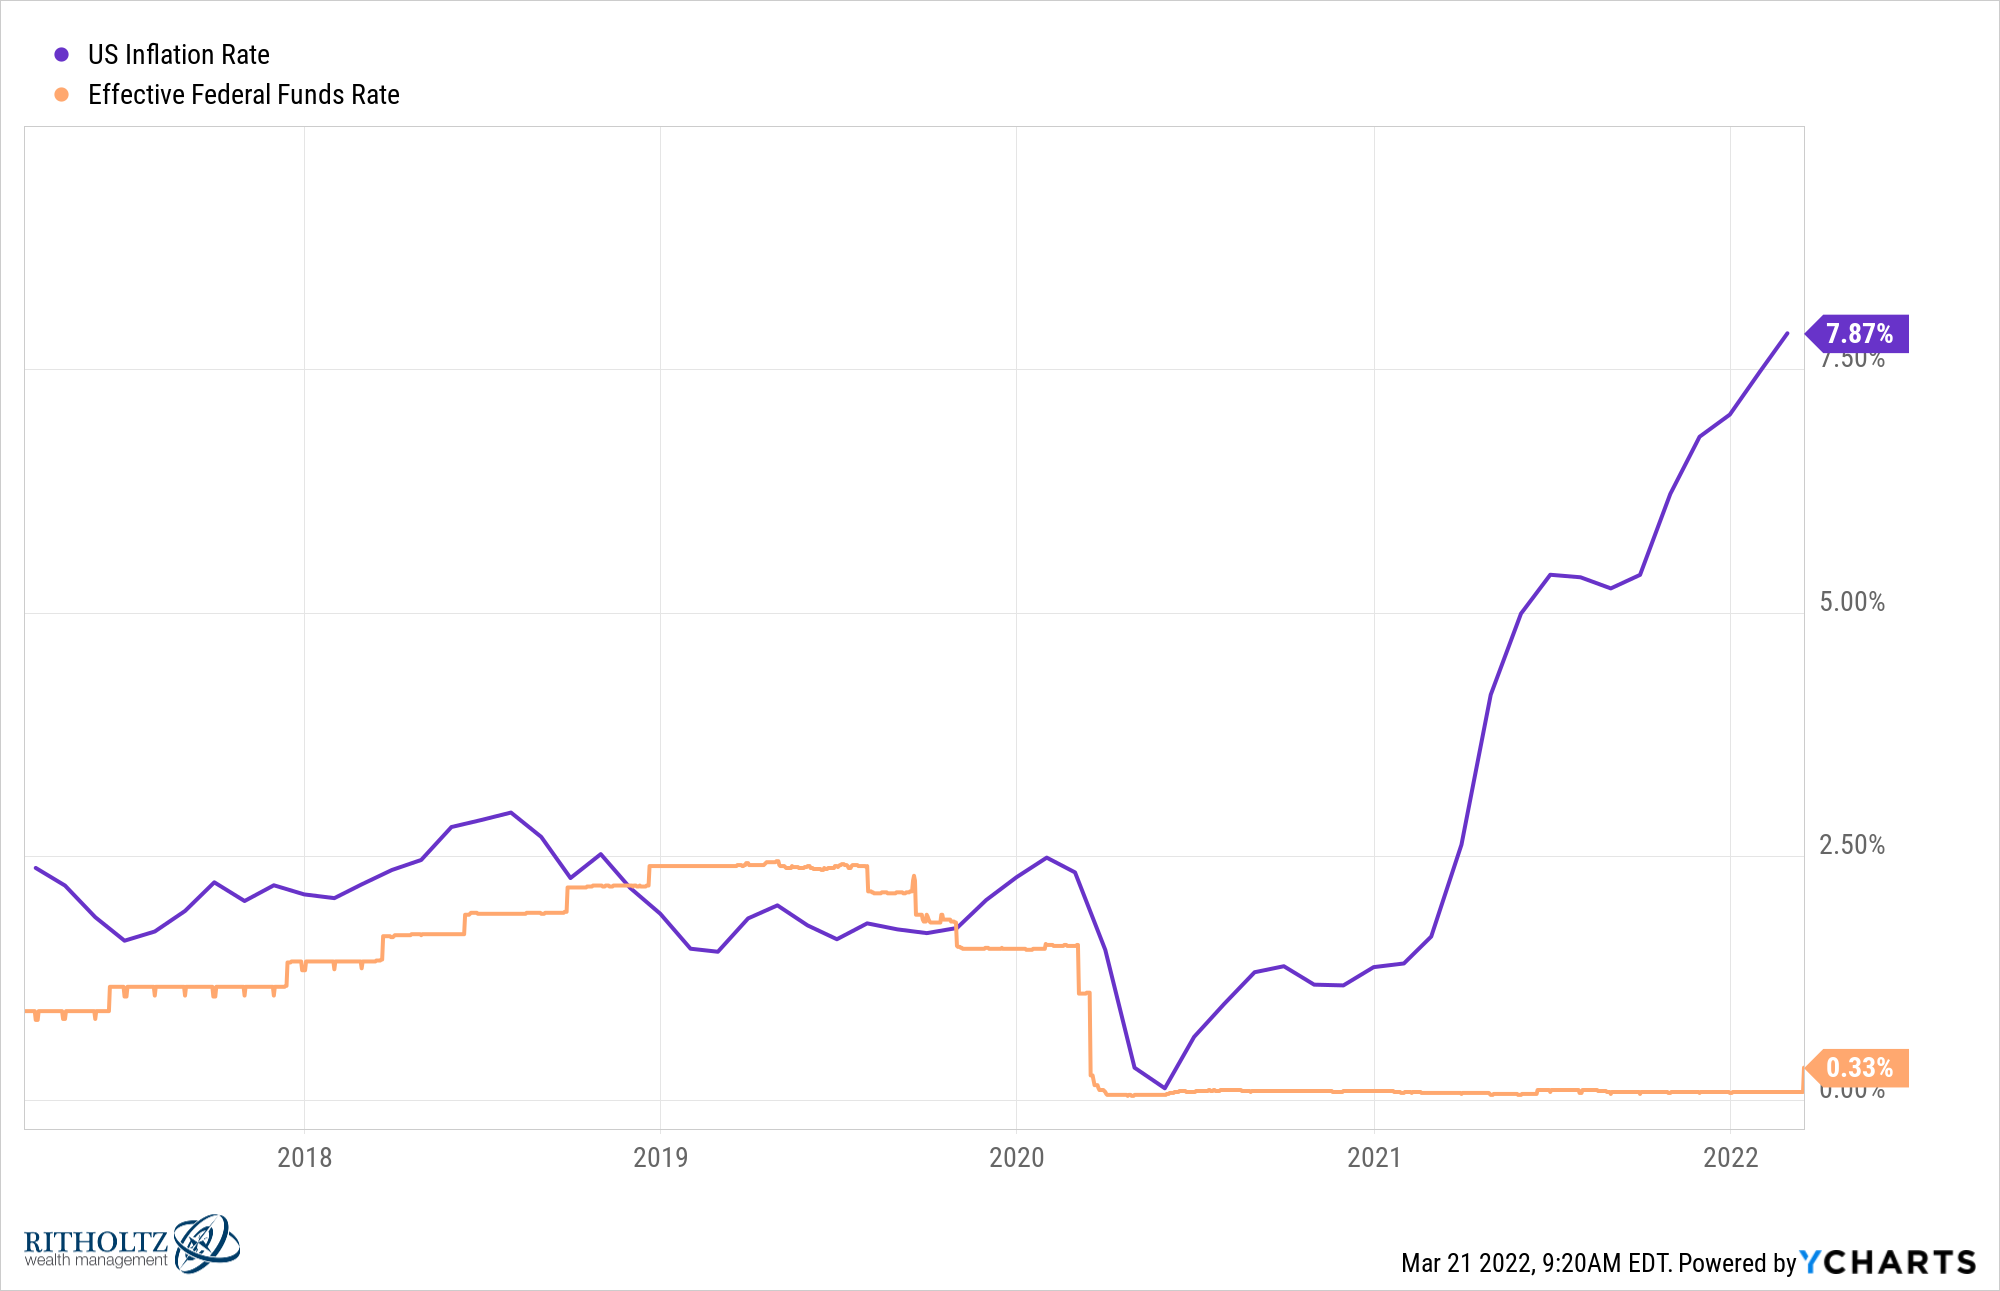
So don’t expect the savings account at your brick and mortar bank to go noticeably higher anytime soon:
Luckily, you can finally find some yield in the fixed income space. And interestingly enough, those higher yields are now in the lower risk portion of bonds based on the movements in the yield curve.
Take a look at the returns since the start of 2021 for different segments of the bond market:
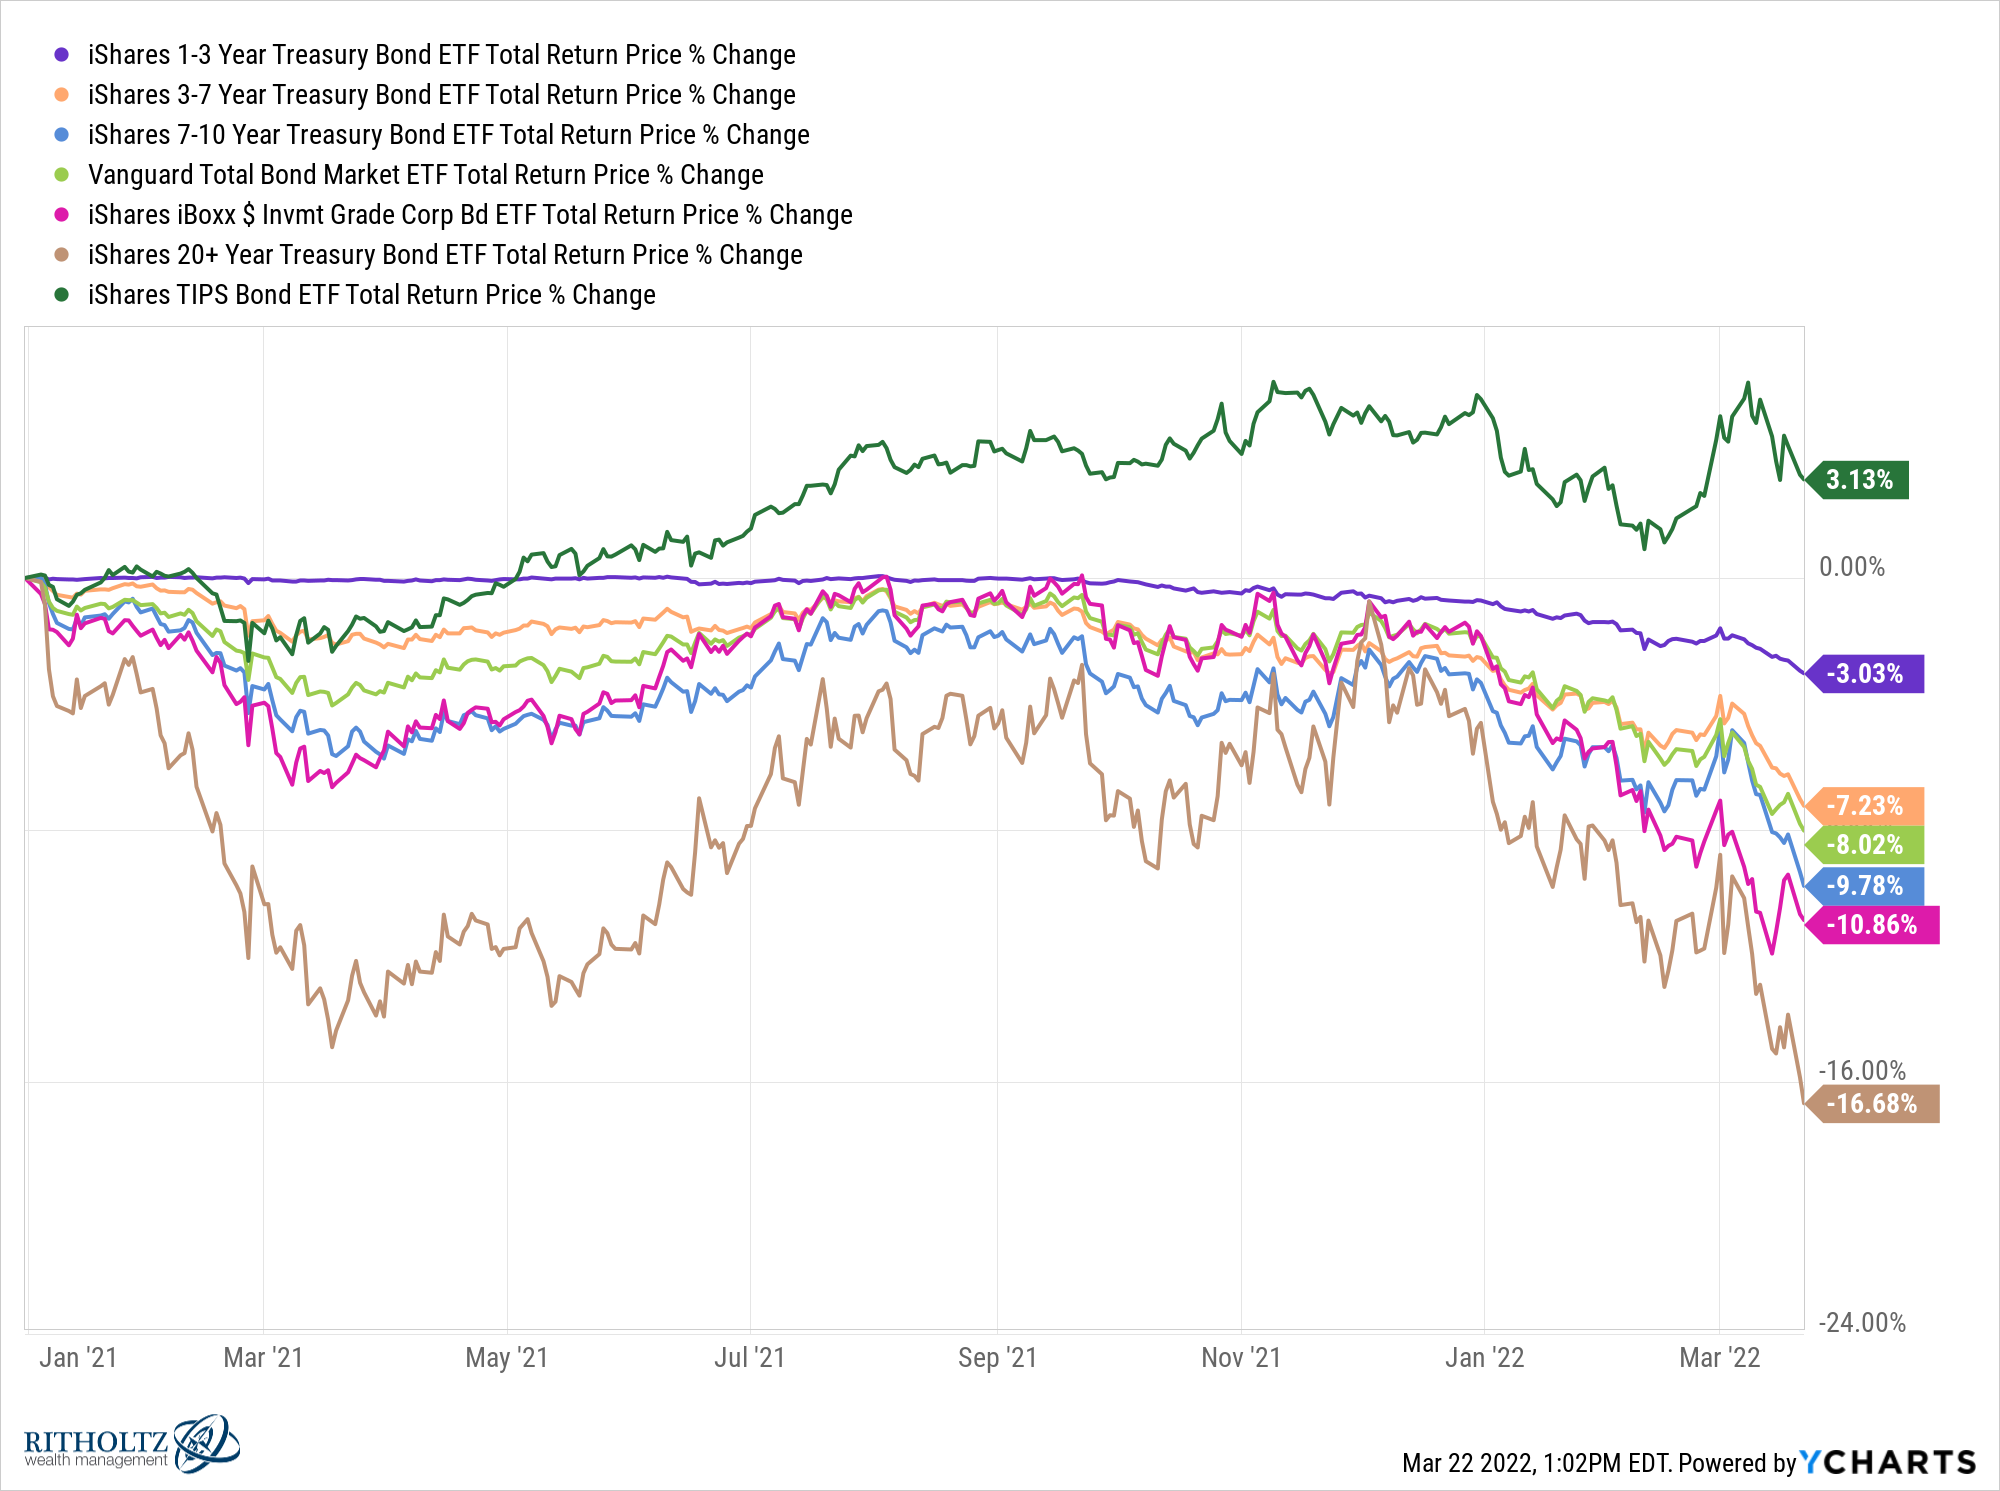
TIPS have held up relatively well because inflation came in higher than expectated but every other bond maturity is down.
This makes sense when you consider yields have an inverse relationship with bond prices.
For bond investors, this is short-term pain for long-term gain. Higher yields mean higher future returns.
Take a look at the current SEC yields for the various bond ETFs after this move higher in rates:
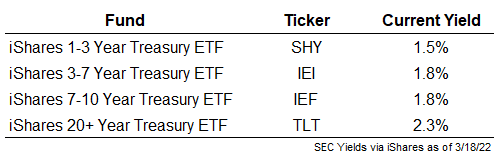
The general rule of thumb is the longer the maturity and the longer the duration, the more sensitive bonds are to interest rate movements. This means longer-term bonds tend to see their prices rise more when rates are down and fall more when rates go higher.
That’s exactly what we’ve seen.
You should also notice investors in shorter-term bonds are getting nearly the same yields as longer-term bonds. So if rates continue to rise, you’re not only going to experience bigger losses on the long end of the maturity spectrum, but you’re not really being compensated for that risk with higher yields.1
Bond yields at 2% are nothing to write home about, especially with inflation running at 8%. But it’s better than rates stuck on the floor at 0%. Assuming rates do continue to rise, short-term bonds remain a pretty decent hedge against interest rate risk.
There is another side of the coin when it comes to rising interest rates — borrowing rates are going up.
You can see a relatively strong relationship between the benchmark 10 year treasury yield and 30 year fixed rate mortgages over time:
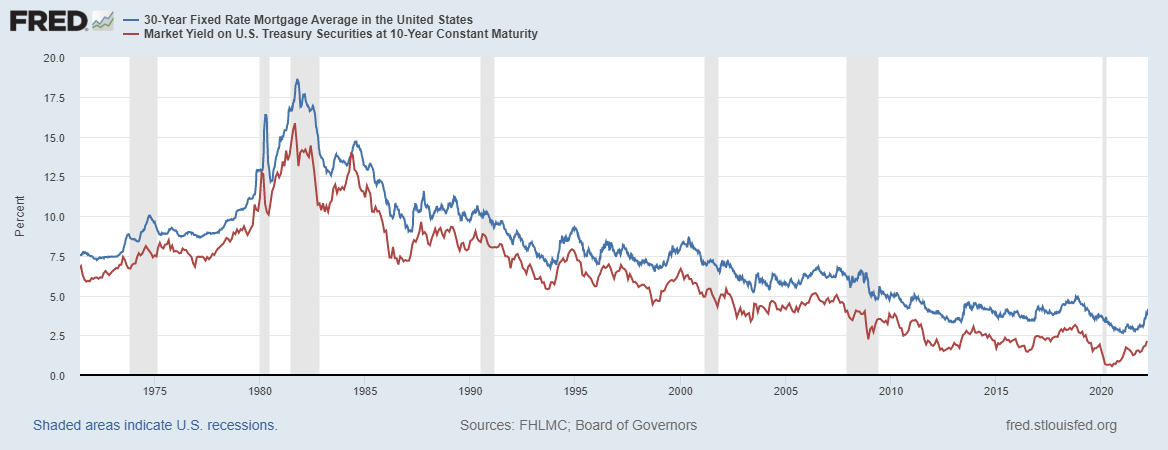
The average 30 year fixed rate mortgage bottomed at 2.7% in January of 2021. It was still 2.8% as recently as August of last year. Now it’s rocketing higher, hitting an average of 4.2% as of last week:
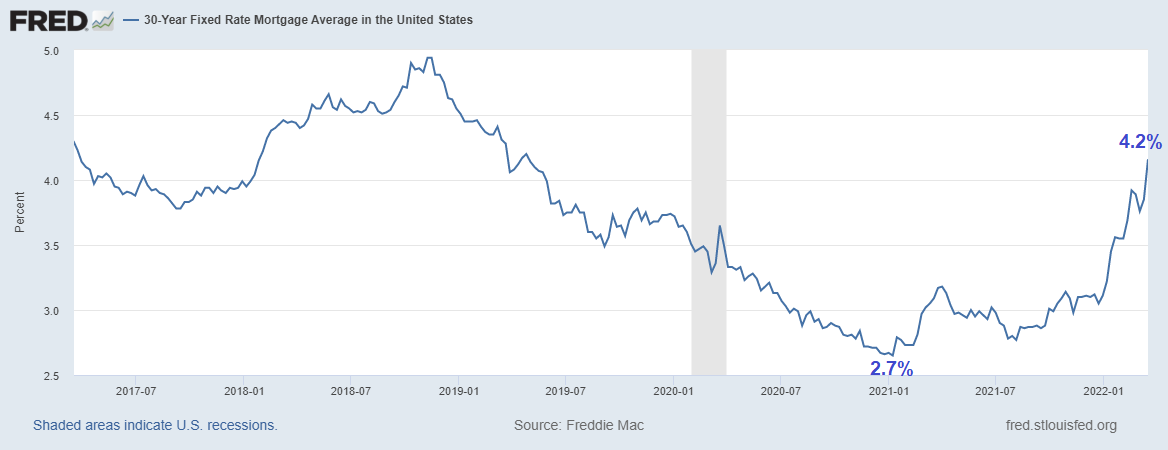
Last week’s numbers are probably already stale. The 30 year could be as high as 4.7% now.
The confluence of higher inflation, higher rates and higher borrowing costs is going to have an impact on investor actions at some point.
- Does this slow down the crazy housing market?
- Does it make the housing supply problem even worse if people don’t want to trade-up for a higher mortgage rate?
- Will investors put more money in bonds now that yields are higher?
- Or will investors pull money from bonds now that they’ve experienced some losses?
- Do stocks still rule the day since real bond yields remain firmly in negative territory?
These moves are happening so fast that it’s difficult to know what will happen.
All I know is things remain weird when it comes to both the economy and markets.
We’re all dealing with an environment we’ve never experienced before.
Further Reading:
Why Would Anyone Own Bonds Right Now?
1Obviously, if rates fall long-term bonds will still see higher returns from the price movements.

