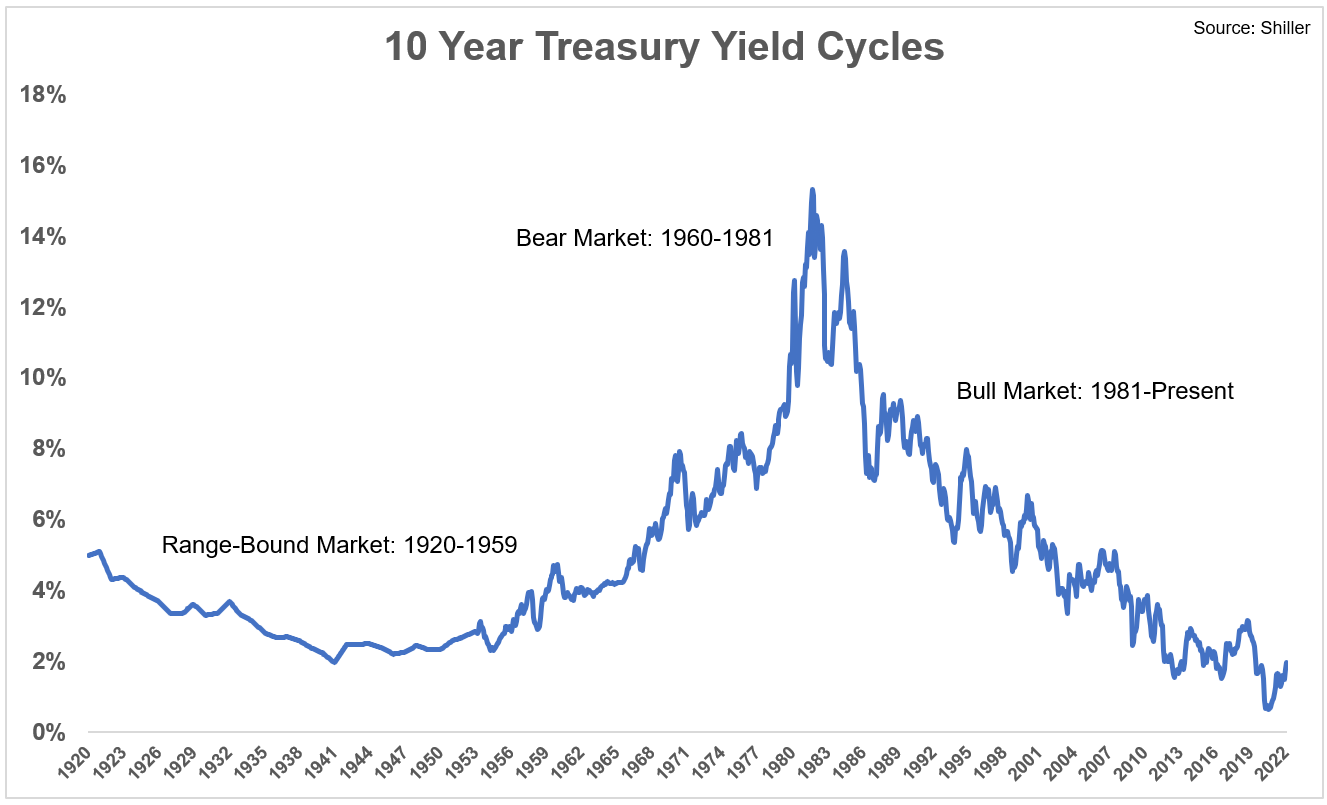
There have basically only been three long-term bond market cycles over the past 100 years or so for U.S. government bonds:

The first cycle from 1920-1959 was rangebound interest rates from around 2% to 4%. That happened from a combination of deflation following the Great Depression and a cap on rates to help fund World War II in the 1940s.
Inflation picked up in the 1960s and rates followed its lead. Prices spike even higher in the 1970s and inflation didn’t let up until the Fed raised rates to more than 20% by the early-1980s. That bear market lasted more than 20 years.
The disinflationary period that followed is likely the most impressive bond bull market of all-time and won’t be duplicated. There have been a number of spikes along the way but the trend in interest rates has been down for 40+ years.
They are now rising again with the 10 year going from a low of 0.5% in the summer of 2020 to 2.5% now.
Is this the end? Is the four-decade bond bull market over? Should investors prepare for a bear market in bonds?
I’m not smart enough to know these answers but I thought it would be helpful to look at what happened the last time bonds were in a sustained rising rate environment.
The first thing to understand is bear markets in bonds are nothing like bear markets in stocks. This is because bond returns are generally guided by math while stock market returns are guided by emotions.
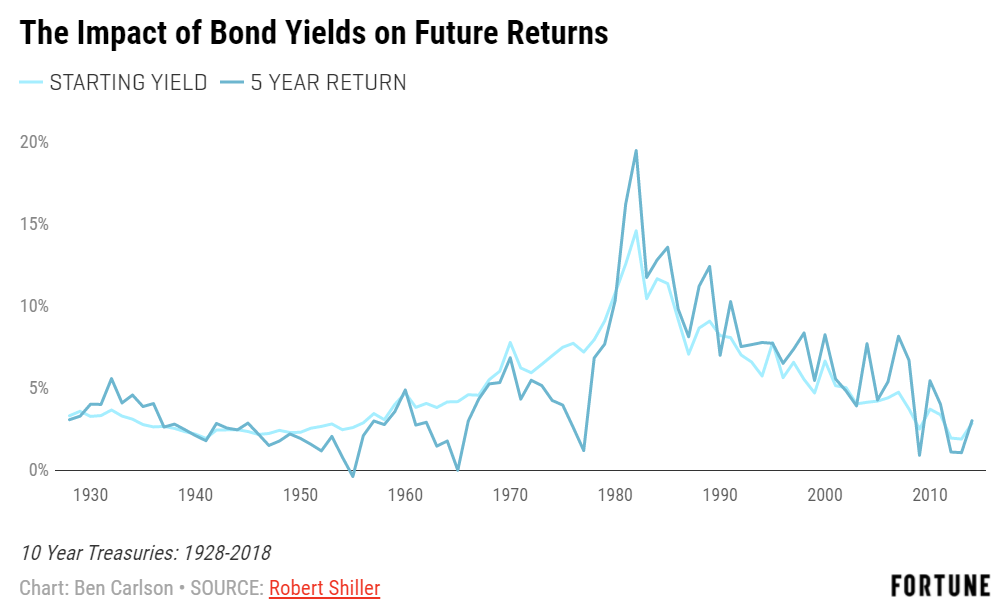
The best way to predict future returns in the bond market is to start with the current interest rate. This chart from a Fortune piece I wrote is a few years old but the relationship still holds:

Movements in interest rates can cause short-term volatility in bonds but over the long haul starting interest rate levels win out.
The 5 year U.S. Treasury is currently yielding 2.5%. If you invest in intermediate bonds your returns are likely going to be pretty close to 2.5% annually over the next 5 years.
But what about rising rates, Ben?!
Let’s take a stroll down yield lane and look at what happened during the last bond bear market.
These were the annual returns from 1960-1981 for long-term and intermediate-term bonds:
- Long-term government bonds +3.0%
- 5 year government bonds +5.4%
Those returns look pretty darn good for a period in which the 5 year treasury yield went from roughly 3% to more than 16%.
The reason for these decent nominal returns is it took more than 20 years for yields to climb from 3% to 16%. And eventually, those rising yields helped offset some of the short-term price losses.
There were, of course, some drawdowns in the short-term from the massive move higher in yields. These were the worst 1, 3, and 5 year total returns from 1960-1981:

The losses here don’t look so bad when you consider the gigantic rise in rates in this time frame but long-term bonds certainly took it on the chin.
Unfortunately, inflation was 5.3% per year over this 22 year period. So intermediate-term government bonds had positive returns by the skin of their teeth while long-term government bonds got shellacked by inflation.
It is worth noting, yields were much higher heading into 1960 than they were from the bottom in rates this time around. We have never seen yields as low as they were at the height of the pandemic market upheaval.
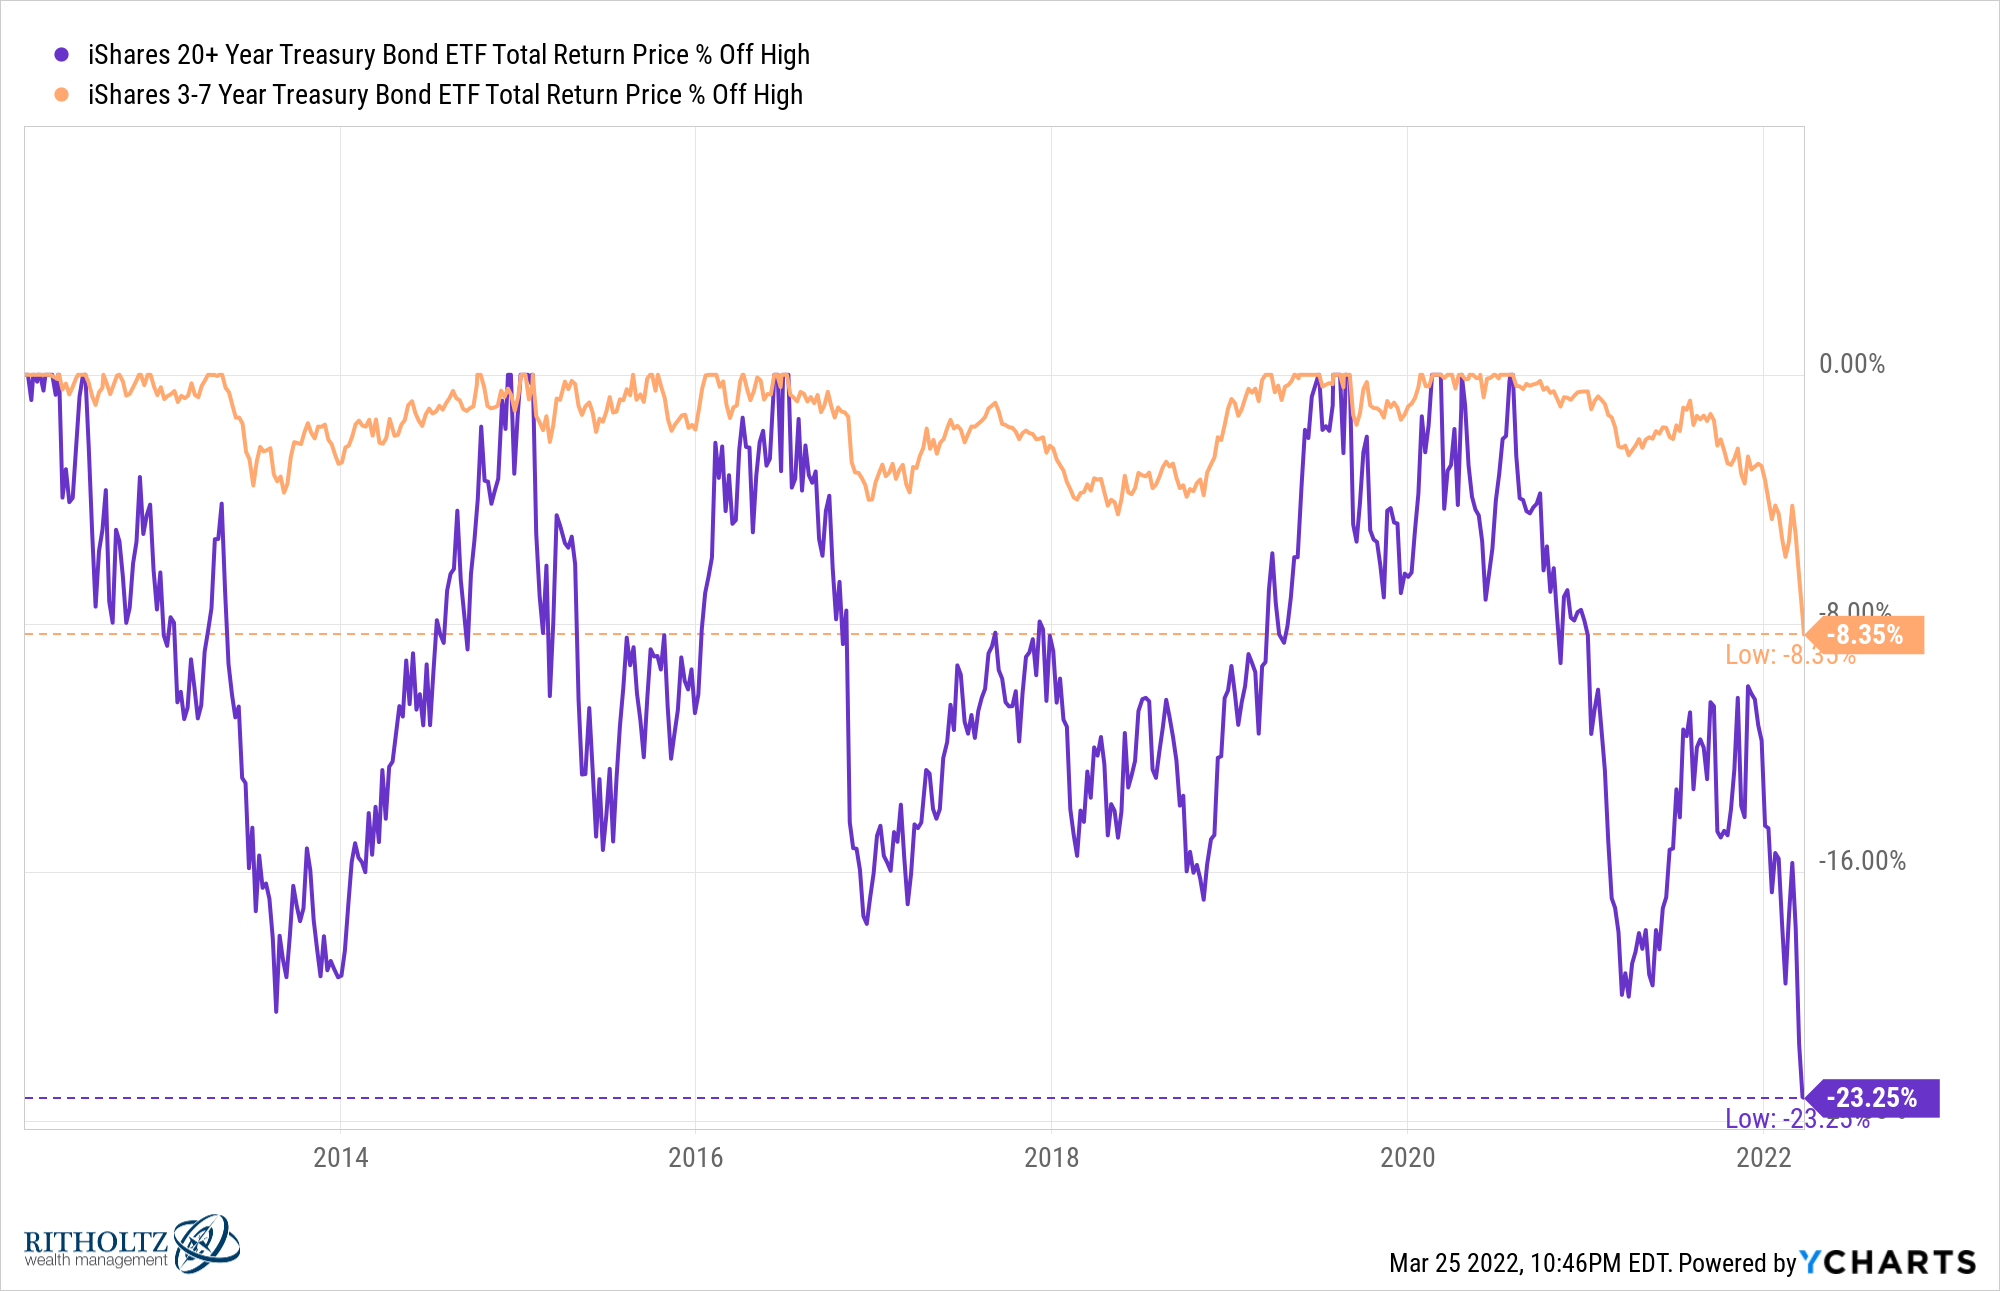
In fact, if we look at the current drawdown in long-term bonds, it’s much worse than anything we saw during the bond bear market of the 1960s and 1970s:

Intermediate bonds are in the midst of their own drawdown as well.
It doesn’t feel like it now but, eventually, higher yields are a good thing.
Going into 1977, the 10 year treasury was yielding roughly 7%. By the end of 1981, yields were just shy of 14%. Since there is a converse relationship between yields and prices, bonds must have gotten crushed right?
Well it wasn’t a great run for bonds but returns were better than you would think from a doubling of interest rates to a ridiculously high level.
Interest rates rose more than 7% in 5 years but 10 year treasuries were actually up more than 6% in total (a little over 1% per year) in this time.
Of course, inflation was running at nearly 10% per year over the same timeframe so real returns were seriously in the negative.
This is the most important point to understand about bonds — inflation is a far greater bigger risk than rising rates.
Rising rates can sting over the short-term but lead to higher returns in the long run.
The biggest risk to a fixed income investor is higher inflation because it eats into your periodic cash payments over time.
I’m not suggesting we’re heading for another 1960-1981-like bond bear market. It’s always possible but predicting the path of interest rates is exceedingly difficult.
You could talk me into rates going much, much higher in this cycle or yields staying rangebound for years to come.
However, it is important to understand the dynamics at play in a bond bear market since there isn’t much precedent for one.
U.S. government bonds don’t necessarily crash like the stock market since the starting yield is the best approximation of your long-term returns in fixed income.
If you’re a long-term investor who utilizes bonds in their portfolio you should want rates to rise. It’s a good thing in the long run.
You just need some patience in the short run to get there.
Further Reading:
Interest Rates Are Getting Weird
