How many hedge fund managers would kill for the following performance characteristics over a 40 year time frame?
Annual Returns: 7.7%
Volatility: 6.9%
Number of Up Years: 37
Number of Down Years: 3
Annual Win %: 93%
Worst Annual Loss: -2.9%
Average Annual Loss: -1.9%
Max Drawdown: -12.4%
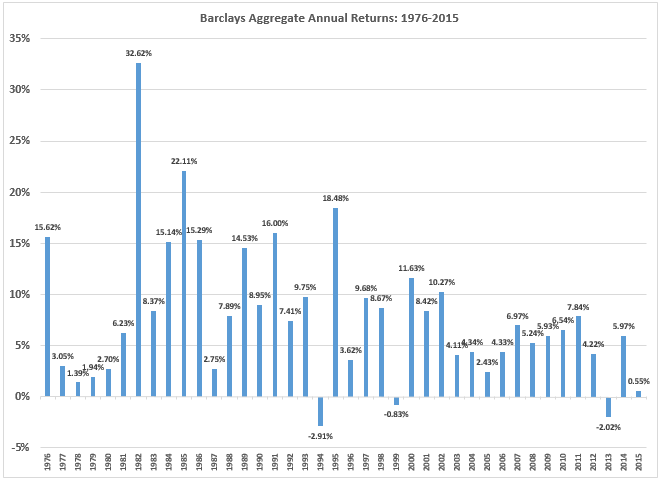
On an absolute and risk-adjusted basis these numbers are ridiculous. Steady returns with about one-third of the historical volatility seen in stocks. Very few — and shallow — drawdowns. It was up nine out of every ten years.
Here’s the kicker — these results were earned in only investment grade fixed income securities. This is the historical track record of the Barclays Aggregate Bond Index since it’s inception in 1976 through 2015. The BC Aggregate is a good proxy for the overall U.S. investment grade bond market. Just look at how impressive this section of the bond market has been over time:

The bond bull market has been about as good as it gets for almost four decades now. It’s hard to imagine a better run for such a prolonged period of time. I’m sure you could make a case for the Japanese stock market in the 70s and 80s or U.S. stocks in the 80s and 90s, but nothing compares to the longevity of outstanding performance that bonds have enjoyed in the falling interest rate environment we’ve seen since the early 1980s.
While not a perfect comparison, 10 Year Treasuries are a close match to the BC Aggregate in terms of duration and credit quality. Here are the same performance numbers from above prior to 1976 (1936-1975):
Annual Returns: 2.7%
Volatility: 3.9%
Number of Up Years: 32
Number of Down Years: 8
Annual Win %: 80%
Worst Annual Loss: -5.0%
Average Annual Loss: -2.1%
Max Drawdown: -12.2%
Returns were far lower and there were more down years (although the size of the drawdowns were still fairly similar). Volatility was actually lower, but that’s because the majority of volatility in the past 40 years was to the upside.
The bull market in bonds may not be completely over, but it’s definitely on its last legs. A few thoughts on some of the implications:
I probably sound like a broken record here, but it’s important for investors to reduce their expectations for future fixed income returns. The next 40 years aren’t going to look at all like the last 40.
Expect plenty of bond substitute products out of the fund industry in an attempt to add yield to portfolios. Wall Street will be bombarding the coming wave of retiring boomers with income-based products with promises of higher yields.
Starting yields will get you very close to long-term returns over time in bonds, but my guess is we’ll see more volatility than in the past. Central bank intervention, investors with shorter time horizons using longer-term securities, high frequency traders, information overload and the ease and low cost of trading almost guarantees it.
The biggest risk to bond fund returns that very few people think about these days is higher inflation in the future. Higher inflation would present a far higher risk to bonds over the long-term than rising interest rates in my mind (although both would likely occur together).
Even with lower returns, high quality bonds can still serve a purpose as a hedge against stock market turmoil. For a simple 50/50 portfolio made up of stocks and bonds, a few percentage points in bond returns isn’t going to make a huge difference during a stock market crash. If stocks fall 40%, a 50/50 portfolio that sees an 8% return in bonds will fall 16% while a portfolio that sees a 3% return in bonds will fall 19%.
Fixed income can still act as a portfolio stabilizer.

[…] The Greatest Bull Market of All-Time (A Wealth of Common Sense) […]
[…] Fixed income can still act as a portfolio stabilizer. (awealthofcommonsense) […]
[…] Carlson of the “Wealth of Common Sense” blog recently made the case that fixed income — yes, that boring but reliable hedge in your […]
[…] Carlson of the “Wealth of Common Sense” blog recently made the case that fixed income — yes, that boring but reliable hedge in your […]
[…] Good morning. Superior returns at low volatility have been made in this asset class… https://awealthofcommonsense.com/2016/02/the-greatest-bull-market-of-all-time/ […]
[…] https://awealthofcommonsense.com/2016/02/the-greatest-bull-market-of-all-time/ […]
[…] 1) The Greatest Bull Market Of All Time by Ben Carlson via Wealth Of Common Sense […]
[…] Don’t expect bonds to do as well over the next 40 years as they have over the last 40 (awealthofcommonsense) […]
[…] Superior returns at low volatility have been made in this asset class… https://awealthofcommonsense.com/2016/02/the-greatest-bull-market-of-all-time/ […]
[…] 1) The Greatest Bull Market Of All Time by Ben Carlson via Wealth Of Common Sense […]
[…] 1) The Greatest Bull Market Of All Time by Ben Carlson via Wealth Of Common Sense […]
[…] 1) The Greatest Bull Market Of All Time by Ben Carlson via Wealth Of Common Sense […]
[…] 1) The Greatest Bull Market Of All Time by Ben Carlson via Wealth Of Common Sense […]
[…] Wealth of Common Sense: The Greatest Bull Market of All-Time? […]