In 2018, from late-September through Christmas Eve, the S&P 500 was down 19.8%.
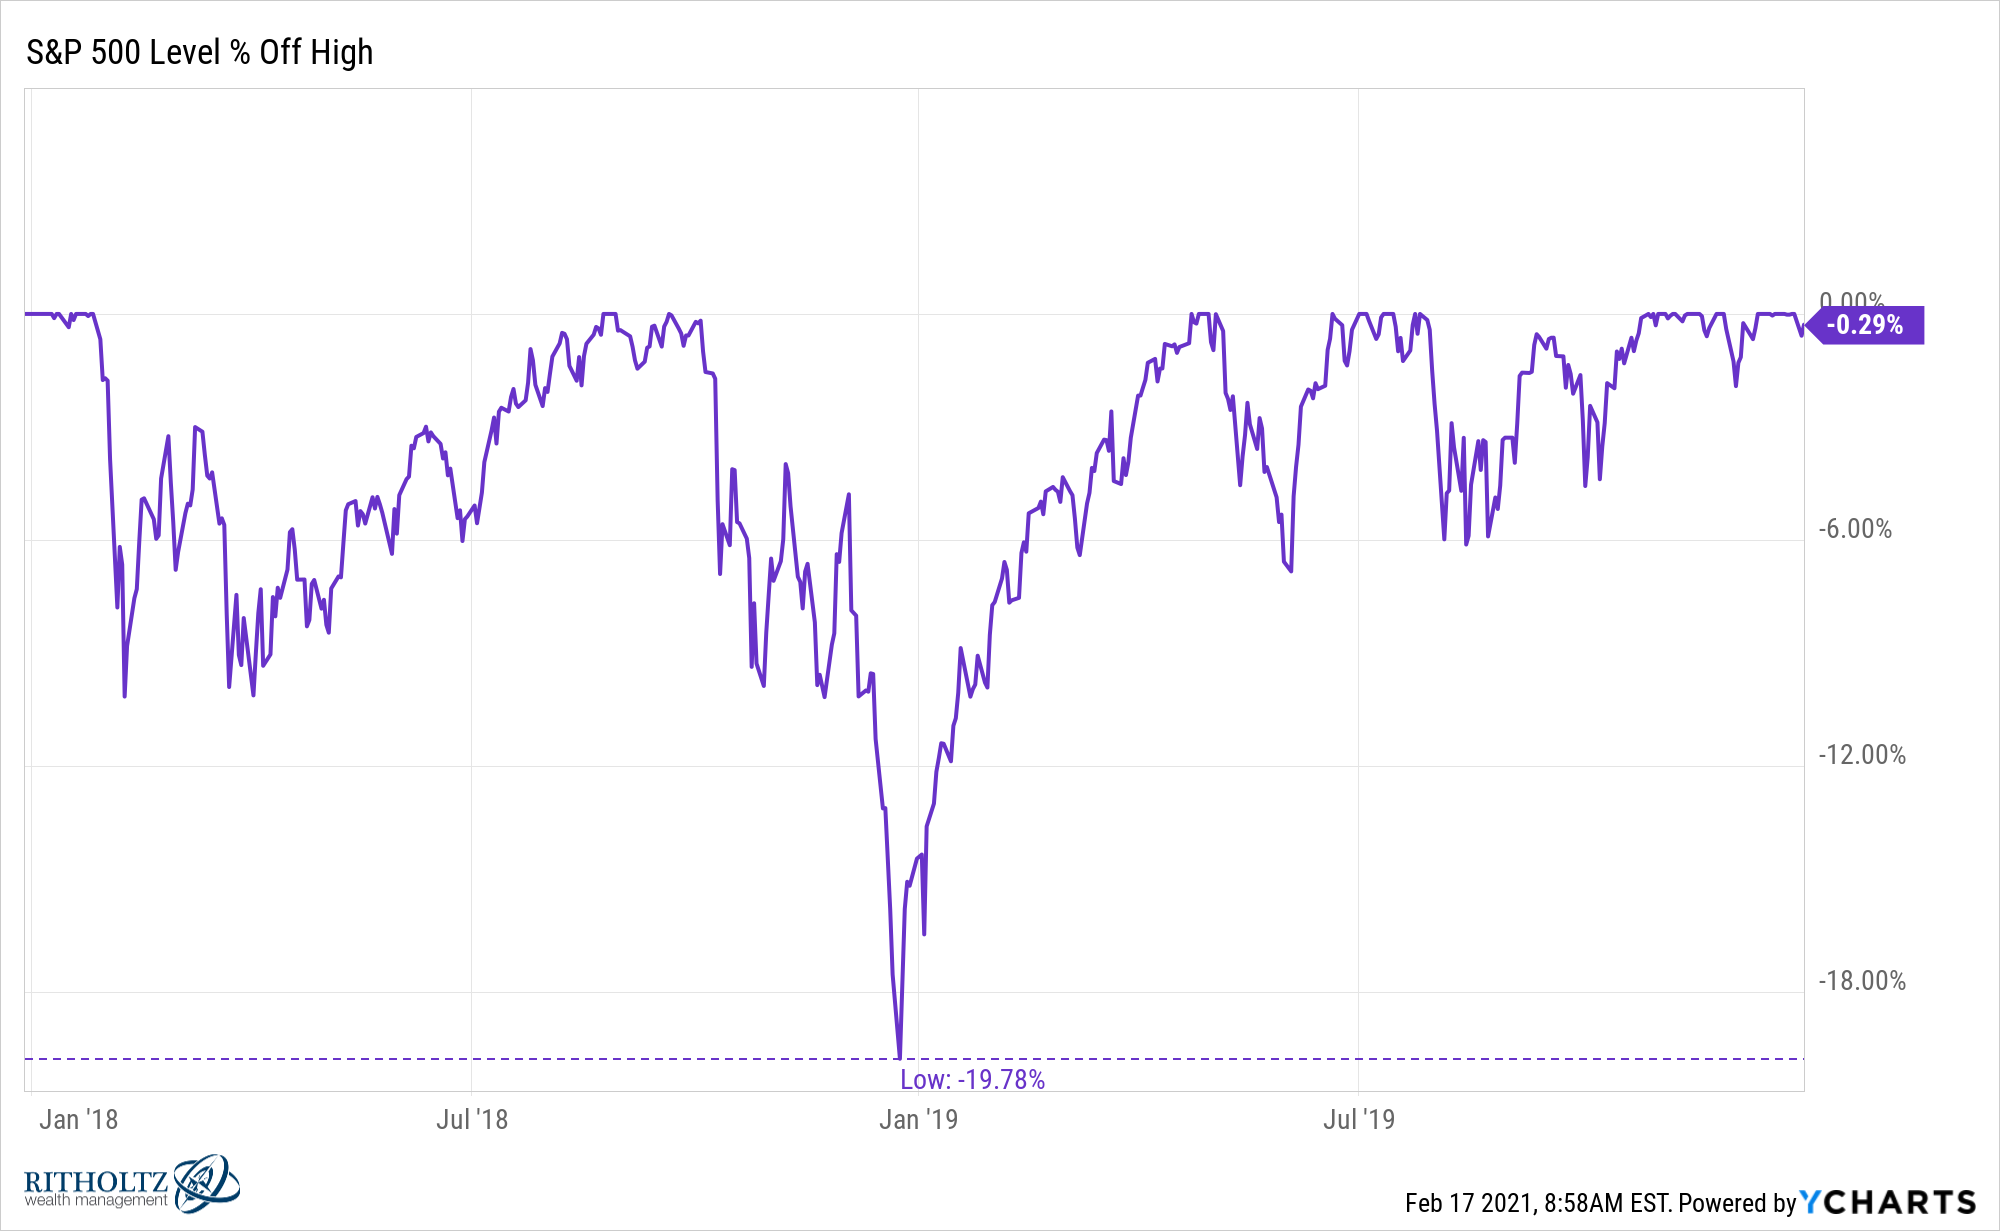
This move seemingly came out of nowhere. There was no black swan event to blame. Fundamentals in the market were fine. No economic shock.
There was really no reason for this near-bear market.
Our brains don’t do well with randomness so investors are constantly in search of a narrative to fill the void when there is no clear explanation for certain market moves. It makes us feel more in control if we can attach a ‘why’ even if sometimes there is no true explanation.
After this one was over, many people decided the culprit must have been the Federal Reserve raising interest rates. You can see the effective Fed Funds rate peaked right around the same time stocks rolled over:
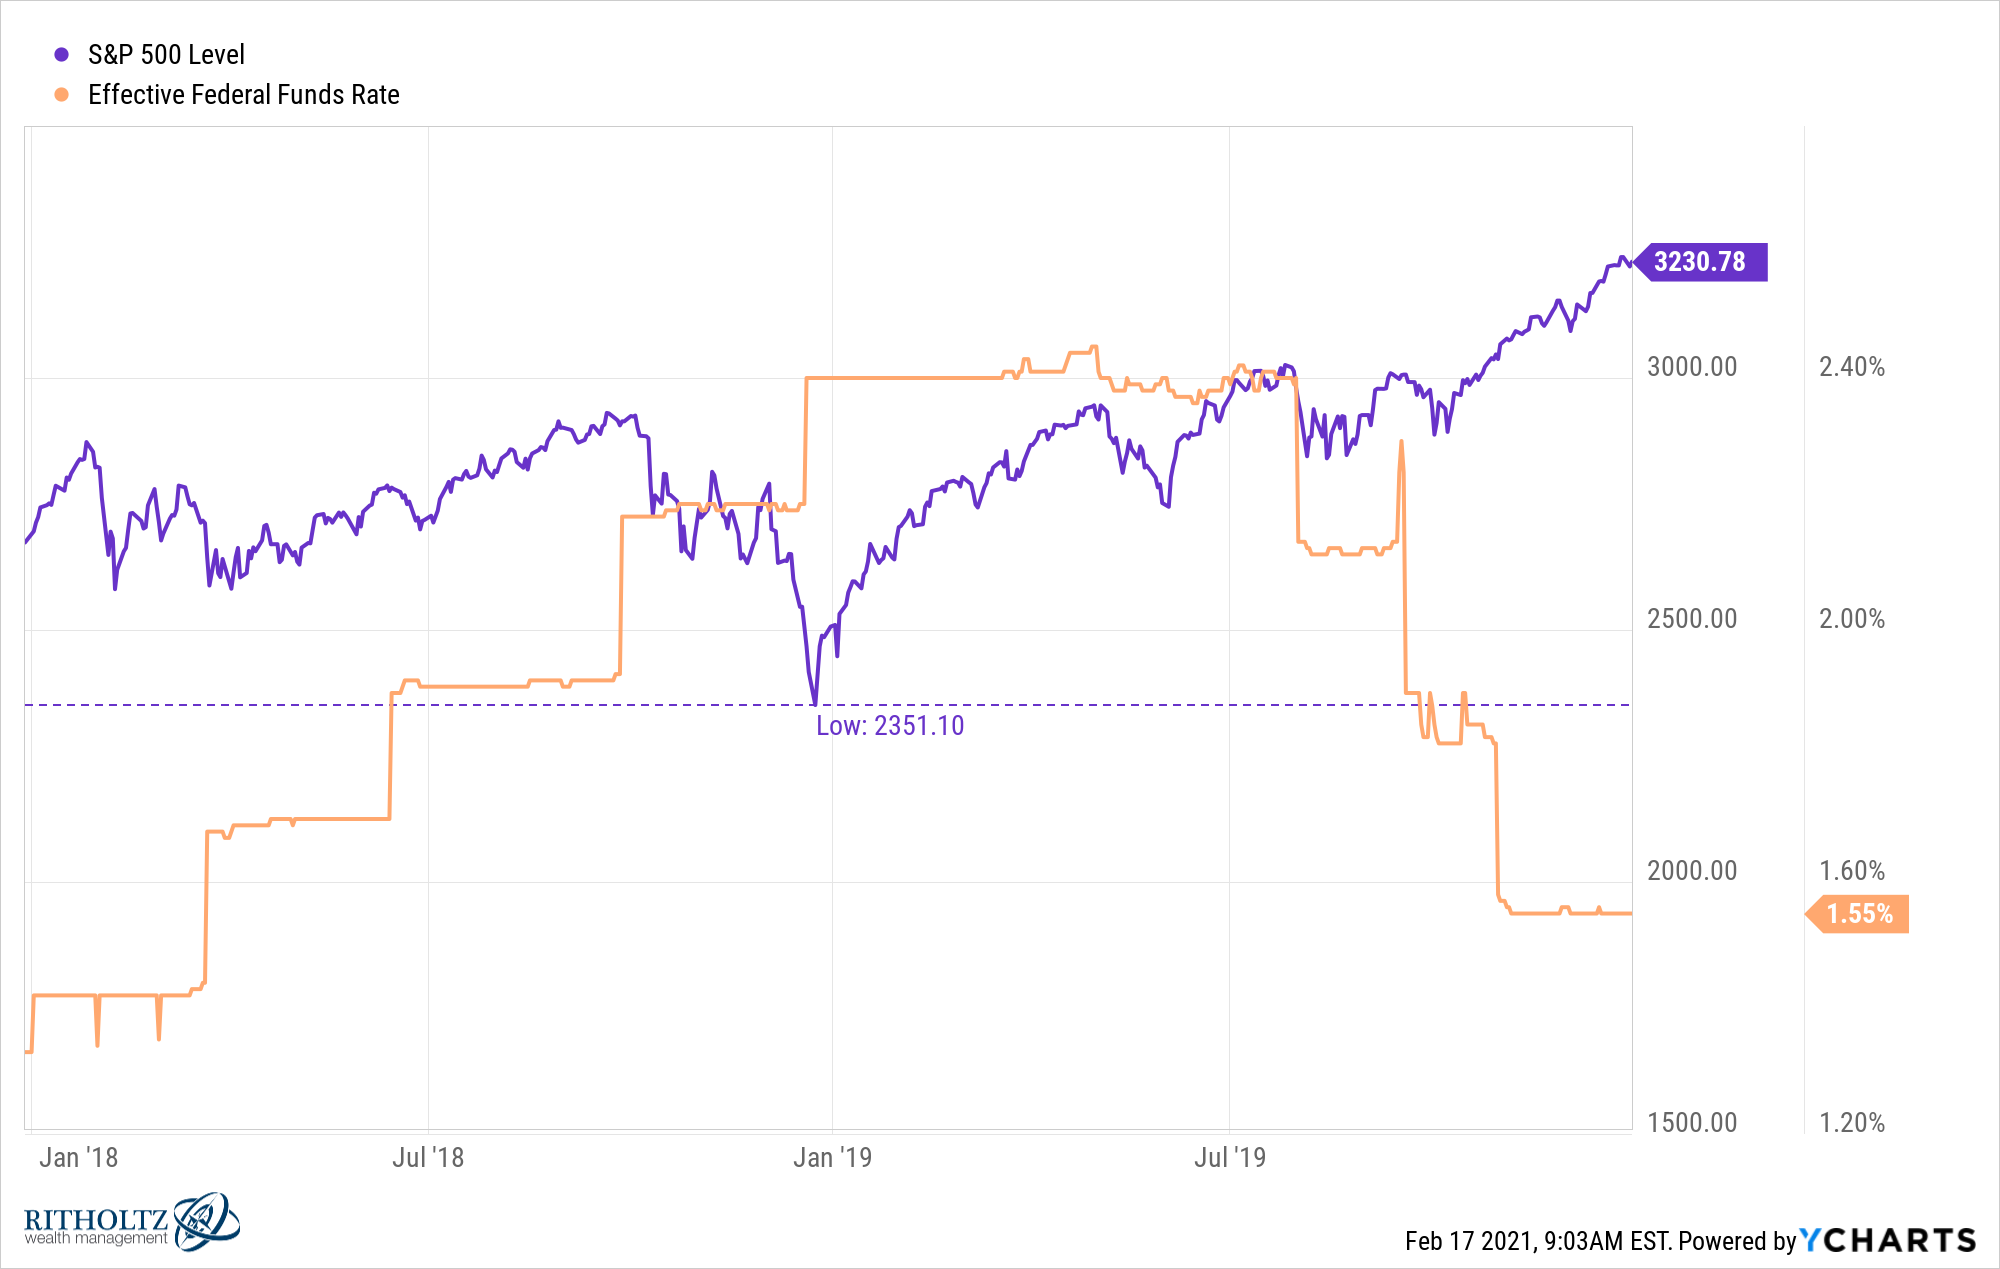
There was worry the Fed was ending the party too early. That’s certainly possible. Rates were still under 3%, which is low by historical standards but maybe investors have become addicted to low rates and it’s all relative.
Perhaps the best way to show this relationship is to see what happened to big tech stocks in this time. Here are the drawdowns in that time for Apple, Amazon, Microsoft, Facebook, Google, Netflix and Tesla:
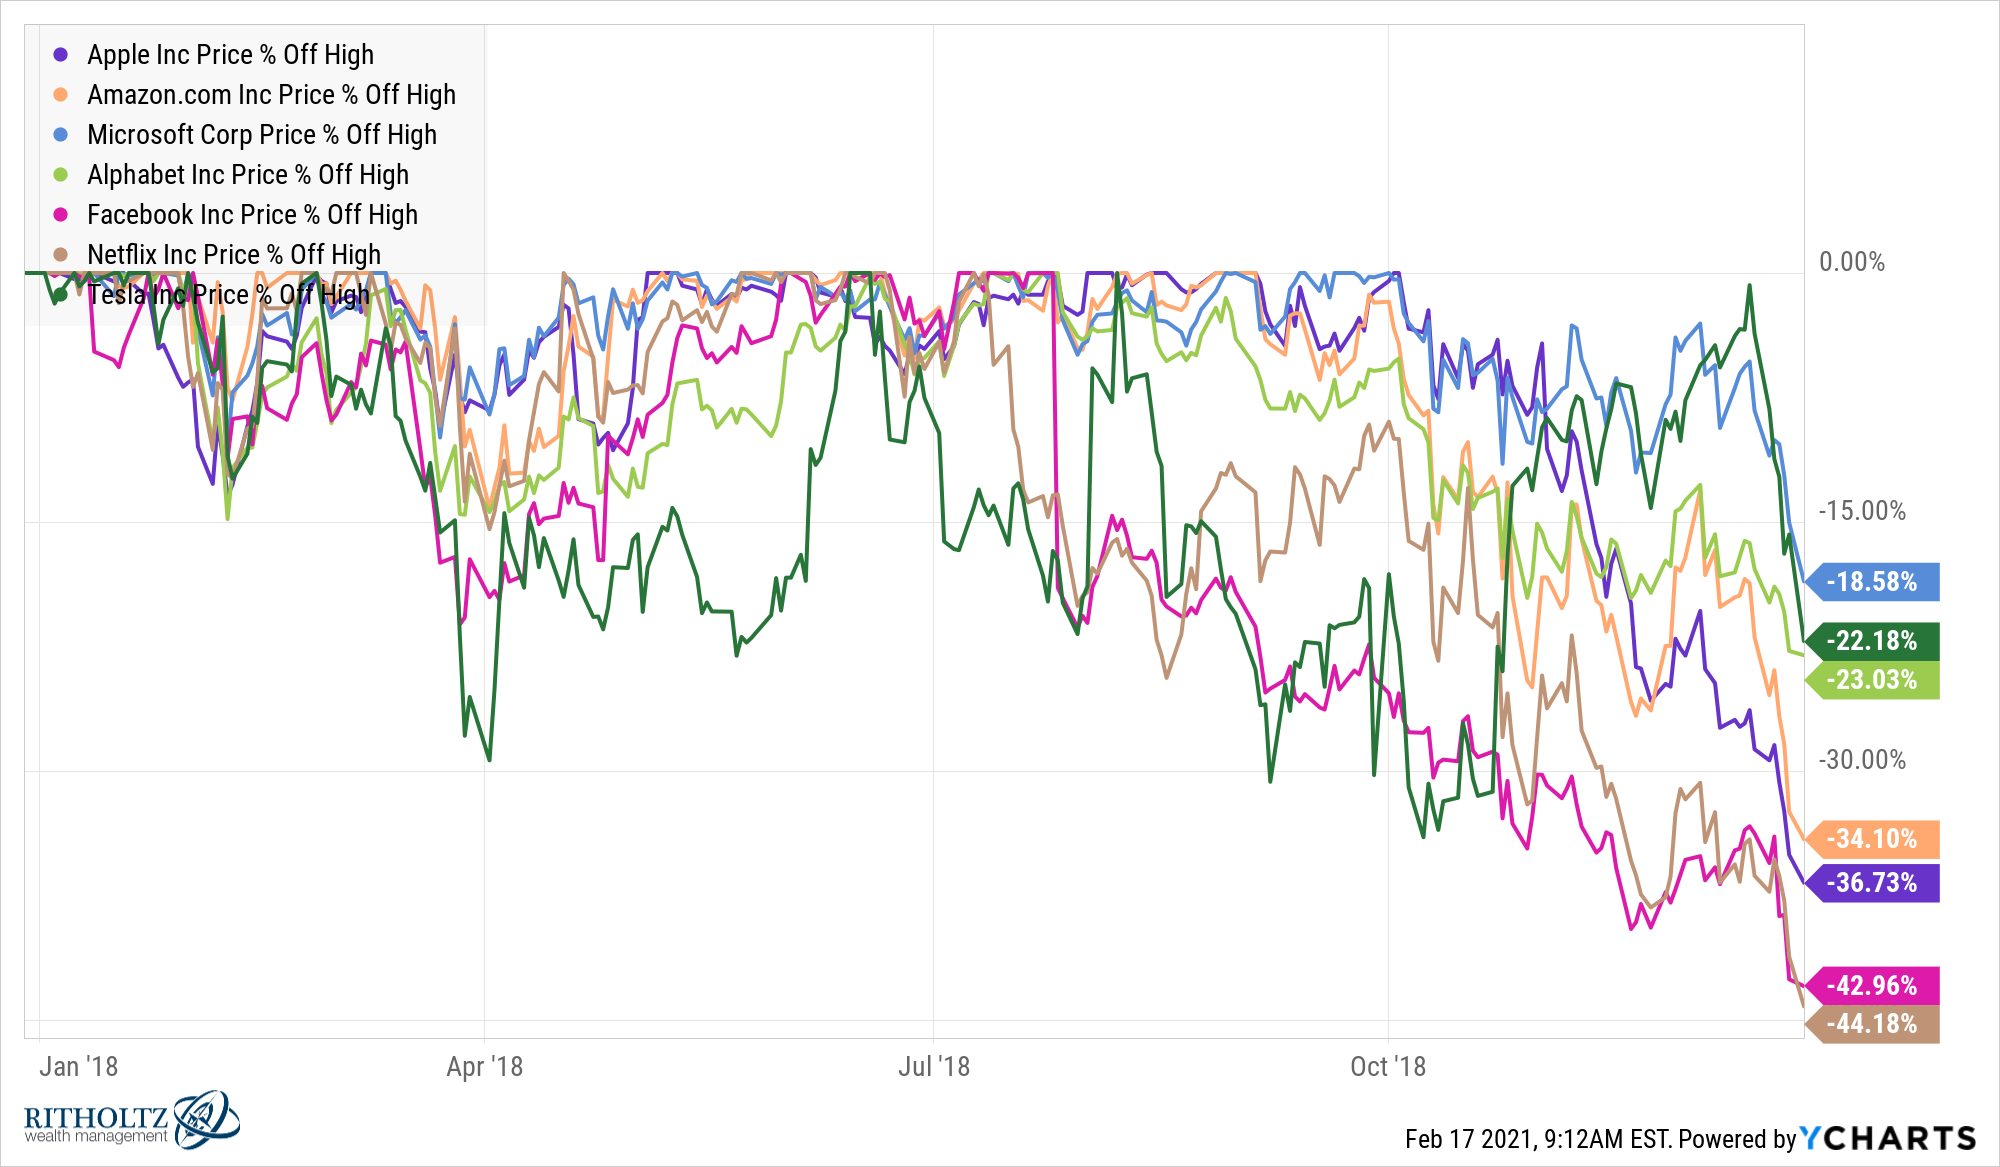
Microsoft is the only one of these stocks to outperform the market in the downturn. Apple, Amazon, Facebook and Netflix all got crushed. This is the exact opposite situation that occurred during the Corona Crash when most tech stocks outperformed.
And the most striking thing about the 2018 mini-bear market is how much it impacted the valuations of these companies. Take Apple as an example, which saw its PE ratio nearly chopped in half:
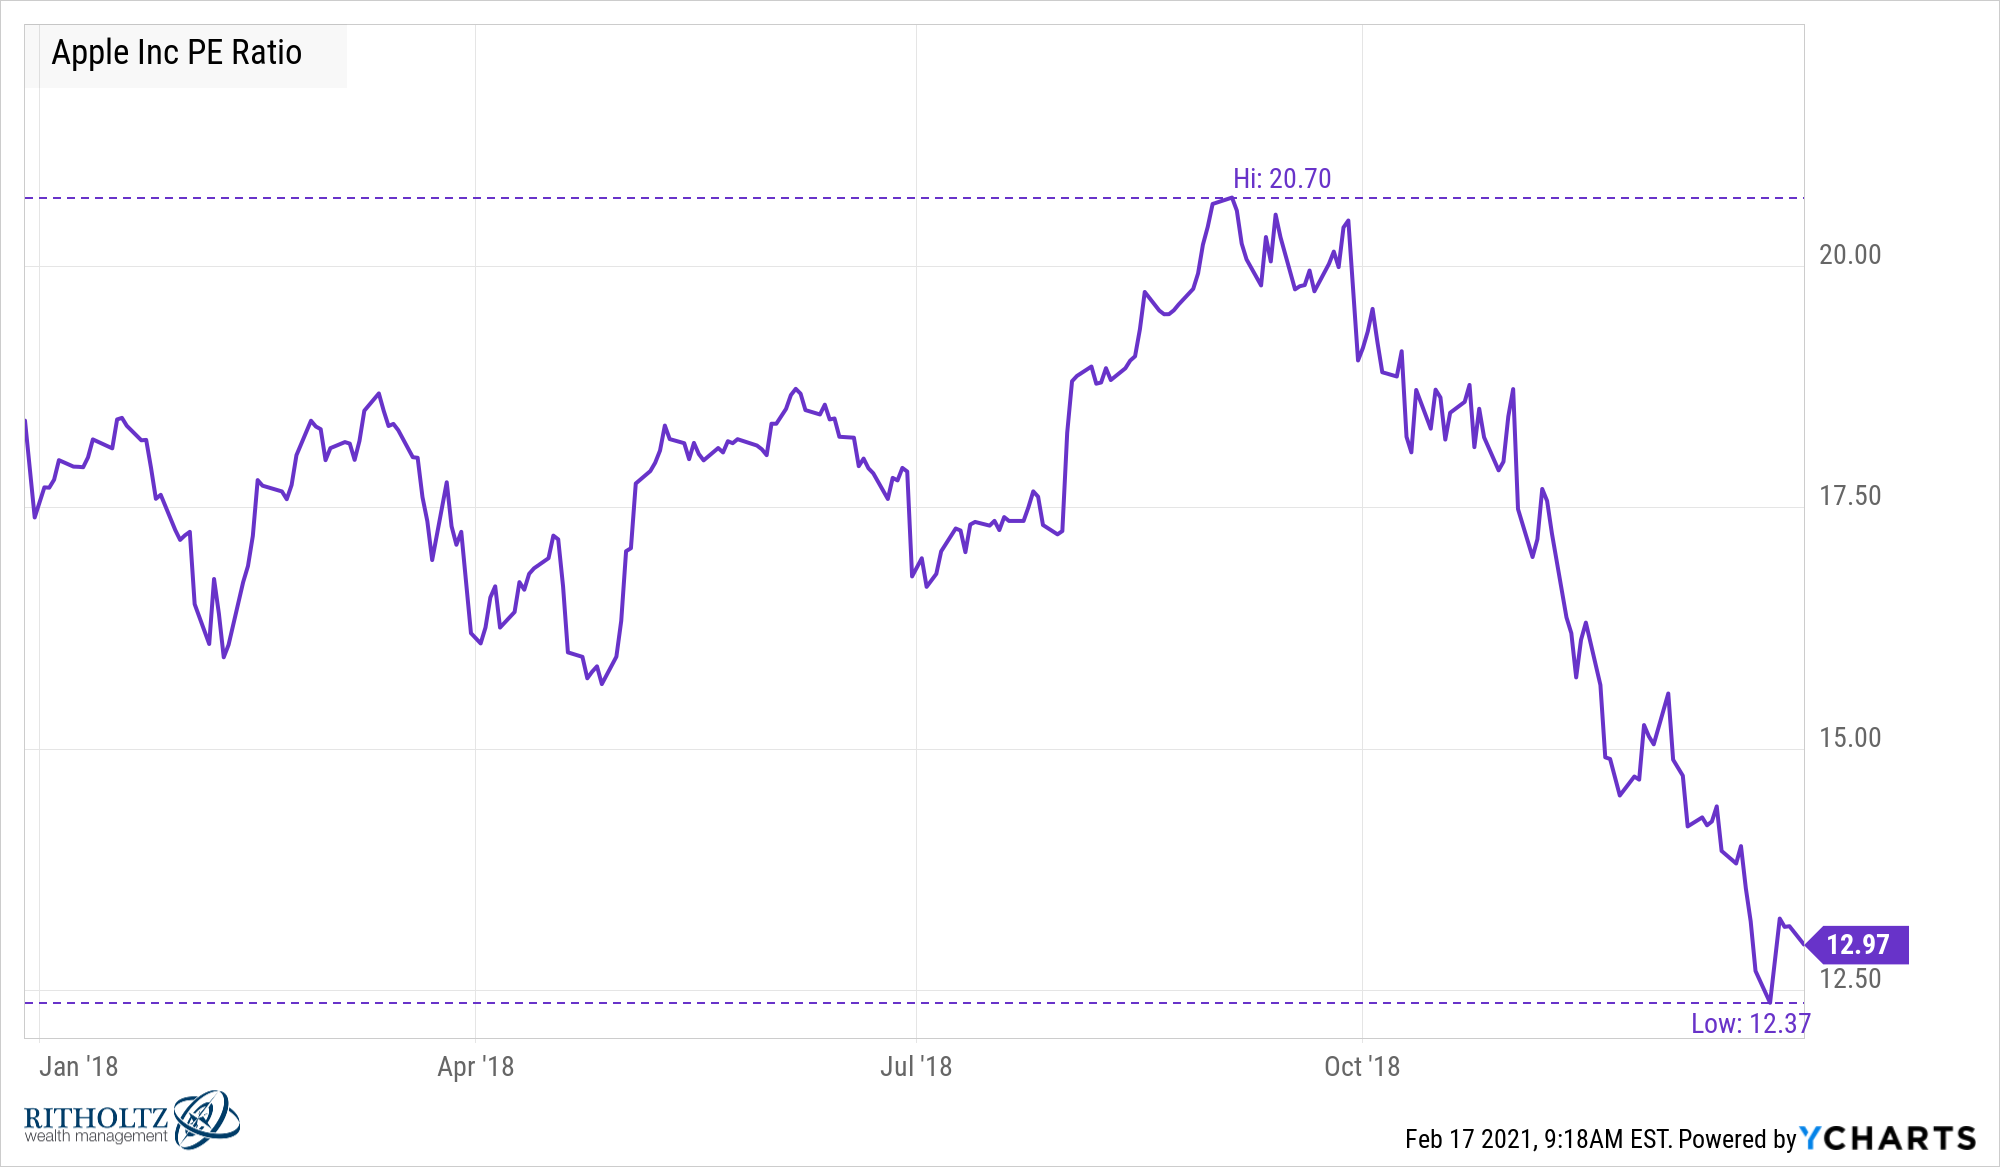
You could have purchased Apple shares for 13x earnings in 2018. The stock now trades for 35x earnings and got as high as 41x in recent months.
It may seem odd to worry about rising rates when looking at the long-term chart of the 10 year treasury yield:
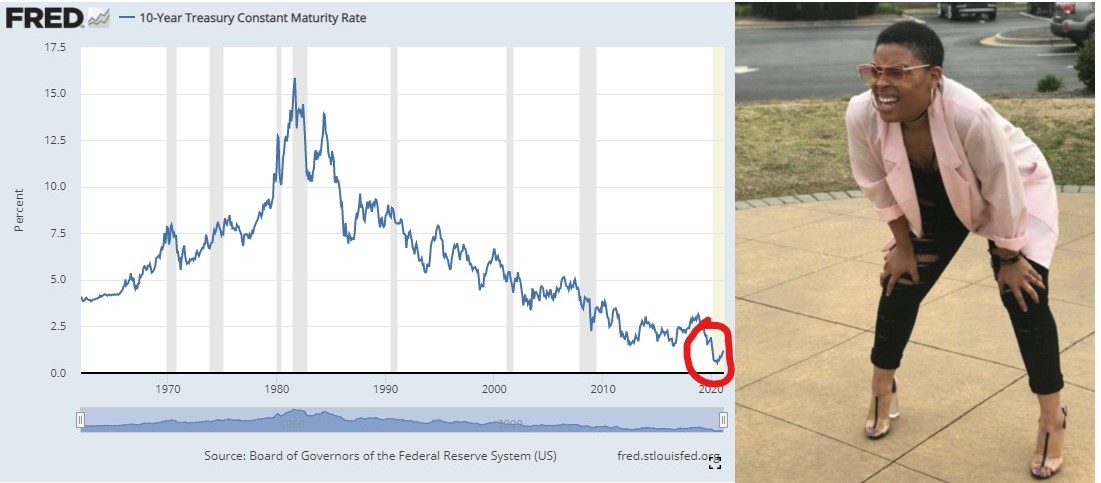
I guess the argument from those who worry about such things is you have to look at the relative change, not the absolute level of rates. And with the 10 year treasury yield now up to 1.3%, that’s more than double the low of 0.5% in August.
There are, of course, some differences between now and the 2018 rate scare.
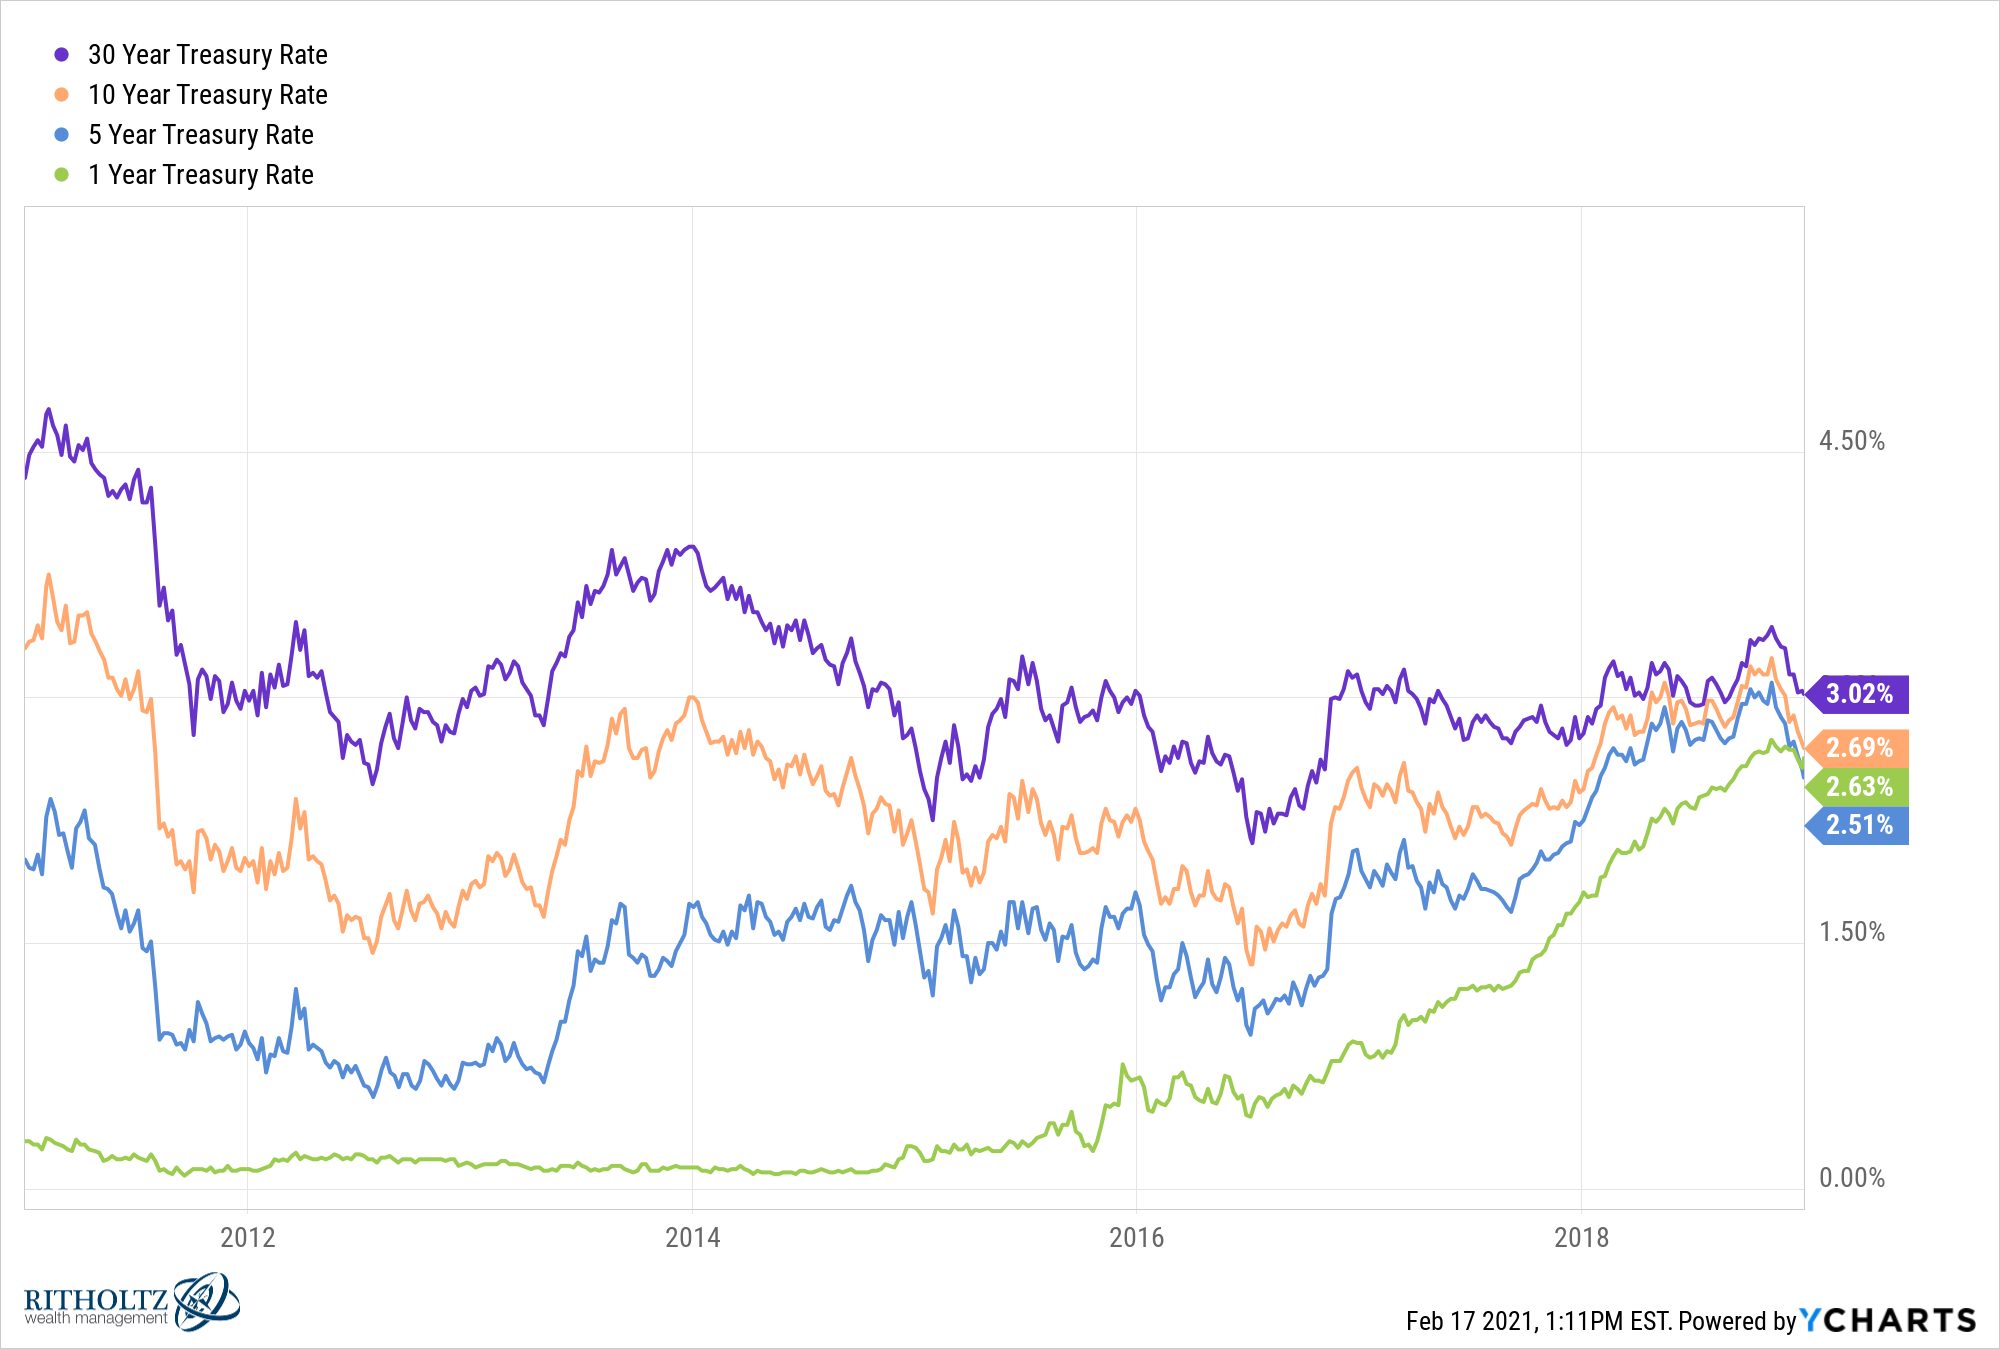
Interest rates of various maturities rarely move in tandem with one another. Back in 2018, the Fed’s short-term rate was the only one making a substantial move high. The yield curve then was pricing in slower growth as it was slowly inverting (short-term rates approaching long-term rates):
The yield curve now is pricing in higher growth as it is steepening (long-term rates well above short-term rates):
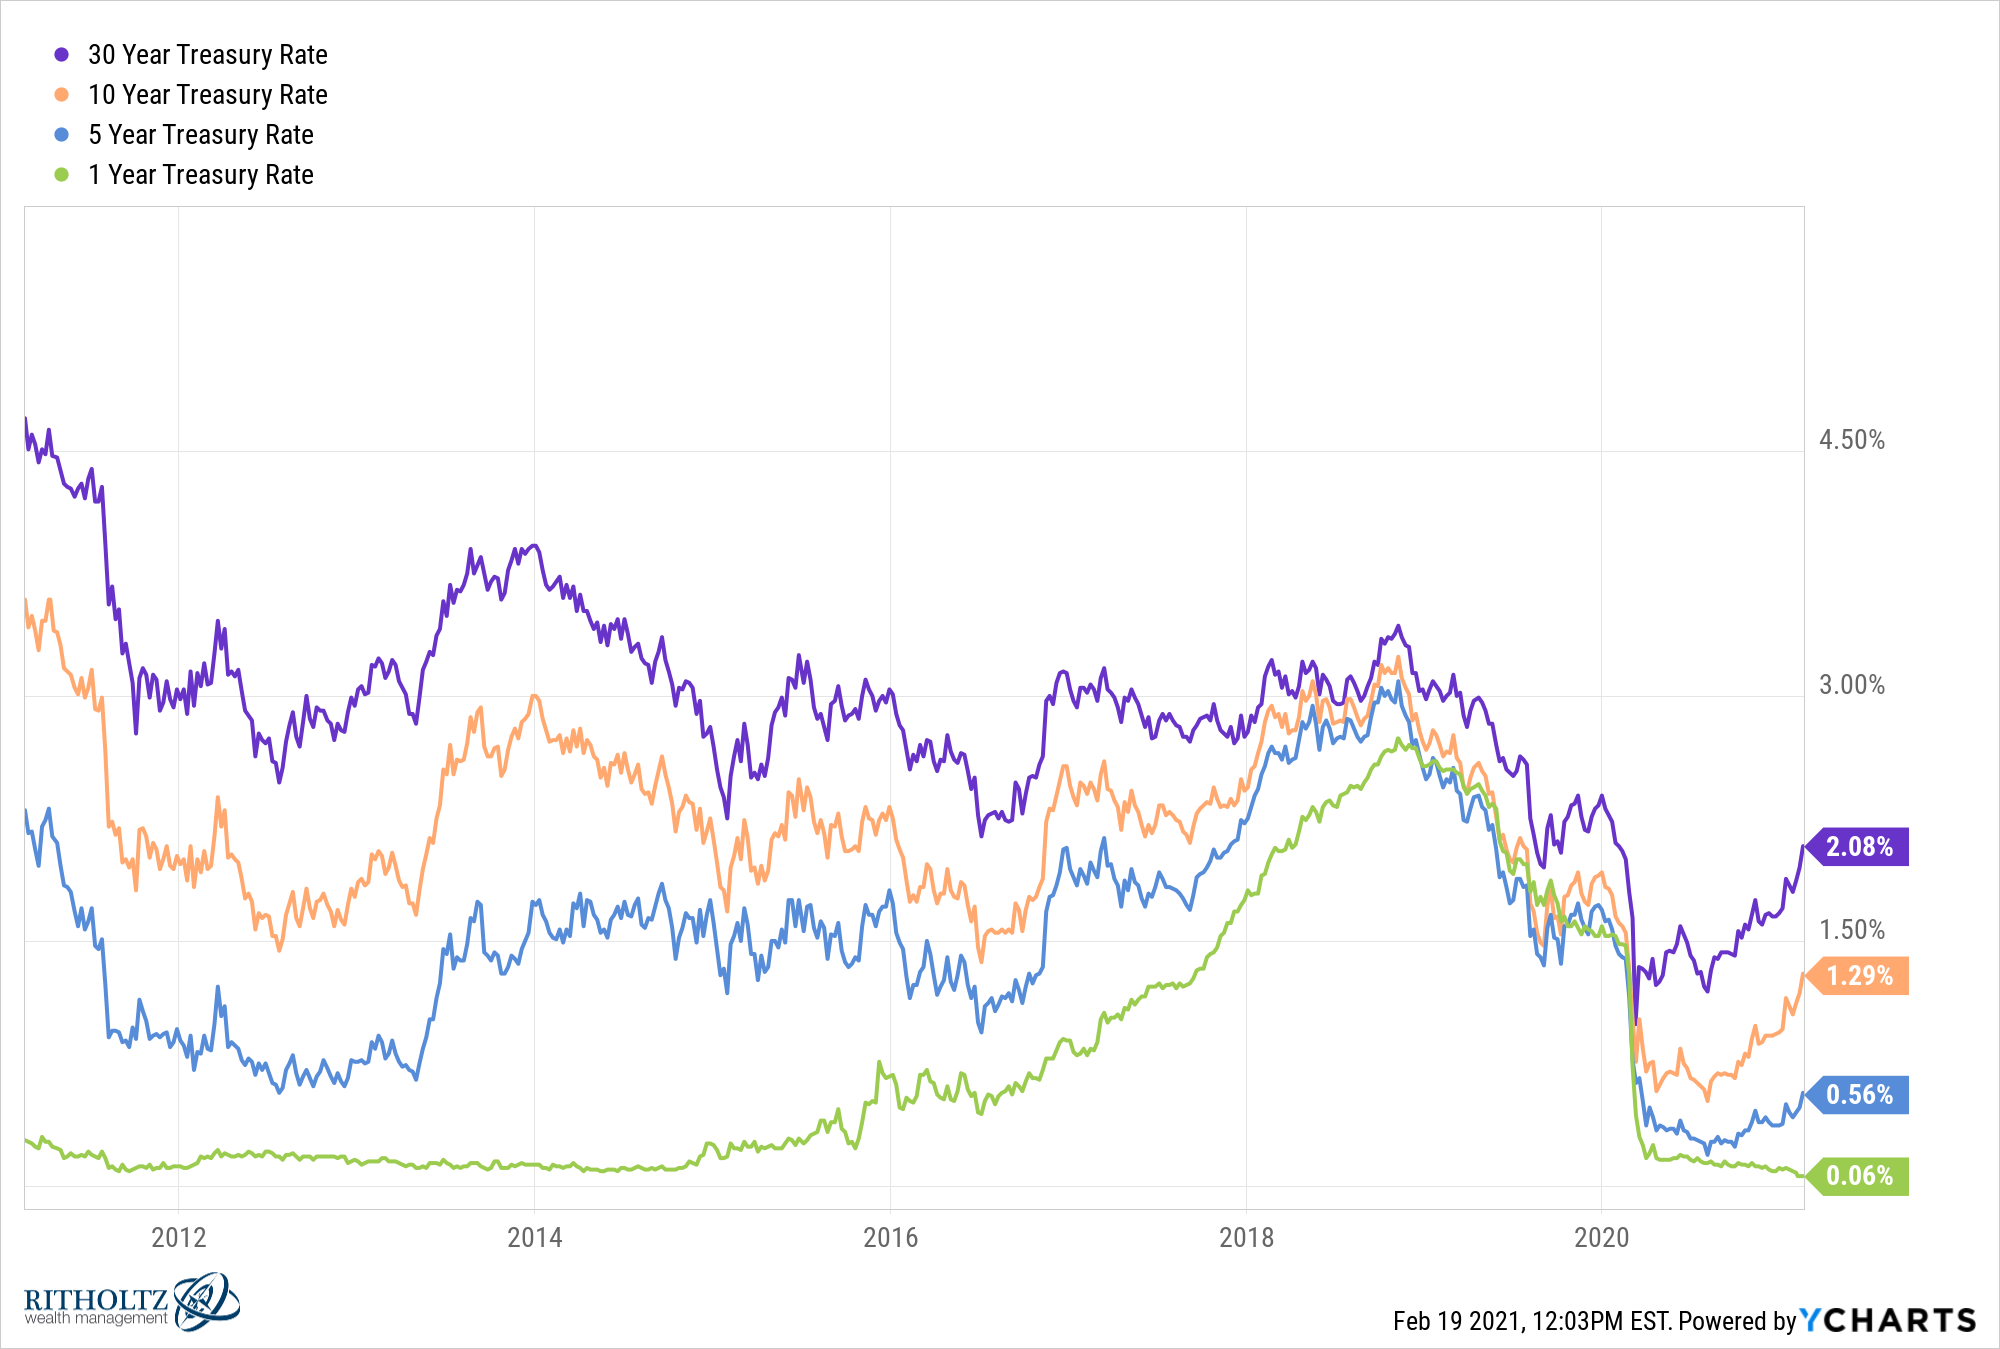
So in 2018 you have short-term rates rising while longer-term rates more or less held steady. Now we have a situation where short-term rates have held tight while longer-term rates are moving higher.
This distinction is important because the reason for the current rise in rates is likely due to the bond market pricing in higher economic growth prospects. The bond market is not all-knowing but that’s what it’s telling us. Feel free to listen to it or not.
Maybe tech stocks are more spooked by the Fed taking away the punch bowl than better economic growth? Time will tell.
Growth stocks do tend to do better when rates are low.
But it’s also worth remembering the stock market generally holds up well when rates are rising. Jake at EconomPic ran the numbers on what happens to various segments of the U.S. stock market historically when rates rise 1% or more:
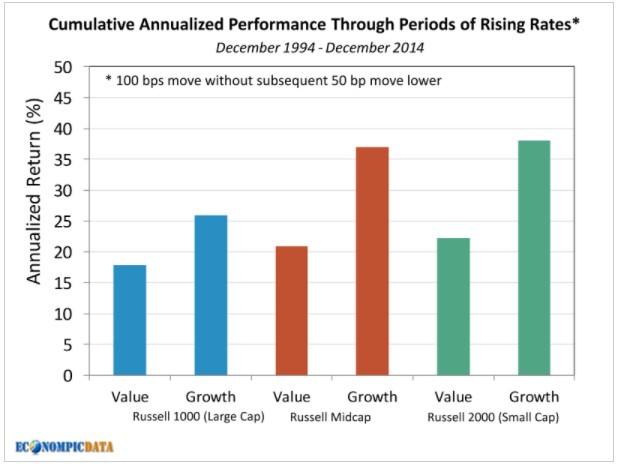
Surprisingly, growth has performed even better than value in large, mid and small cap stocks when rates have risen in the past.
It may also be instructive to look at some historical examples of rising rate environments.
From 1954-1960, the 10 year treasury yield went from 2.3% to 4.7%. In that time, the S&P 500 was up 207% in total (17.4% annualized).
Then from 1971-1981, rates went vertical, rising from 6.2% to 13.7%. This period included sky-high inflation and the brutal 1973-1974 crash, but nominal returns were still pretty decent, at 113% in total (7.1% annual).
From 1993-1994, rates shot up from 6.6% to 8.0%. The S&P 500 was still up nearly 12% in total despite some carnage in the bond market.
At the tail-end of the dot-com bubble, rates rose from 5.5% in 1998 to 6.5% in 1999. Didn’t matter. Stocks were up more than 55% (although that was followed by a 50% crash beginning in early-2000).
From 2003 through 2007, rates went from 3.3% to 5.1%. The S&P rose nearly 83% (12.8% annualized) before the onset of the 2008 crash.
And the latest rising rate environment saw the 10 year go from 1.5% in 2012 to 3% by 2018. Even with the mini-bear market at the end of 2018, stocks were still up 131% in total.
Could rising rates lead to a stock market crash? Yes, that is possible.
Do we know what level of rates will potentially cause a crash? Nope.
Should the stock market care if interest rates are rising for the right reason? Time will tell.
Are tech stocks being propped up by extremely low interest rates? We’ll see.
The problem with the current rate environment is we’ve never experienced interest rates this low before. Maybe investors will become spooked at lower rates than they have in the past. Maybe markets will be given the benefit of the doubt if the economy is chugging along.
The truth is there is no rule of thumb with these things.
But rising rates, in and of themselves, don’t always spell doom for the stock market.
Further Reading:
Could the Bond Market Derail the Stock Market?

