The short-term ups and downs in the stock market garner all of our attention but true investors know long-term returns are the only ones that matter.
The biggest worry for many long-term investors is a Japan-style decades-long malaise that sees the stock market give you nothing for 30+ years. From the beginning of 1990 through the end of September 2020, the MSCI Japan Index is up a grand total of 26%, good enough for annual returns of just 0.8% per year.
The stock market is inherently risky so this isn’t out of the realm of possibilities in the United States. But it’s important to remember how insane things got in the 1980s in Japan to produce such awful forward returns in the aftermath of perhaps the greatest financial asset bubble in history.
The intro from this research piece from the early-1990s describes how crazy things were in Japan by the end of the 1980s:
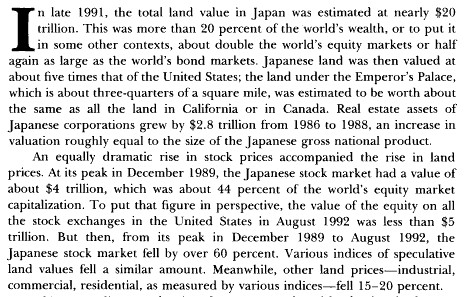
The CAPE ratio on the Japanese stock market was over 100 by 1989. Call me when the United States develops a bubble of this size and scale and we can talk.
Even taking this worst-case scenario off the table, investors aren’t guaranteed anything when it comes to long-term returns in the market.
Here’s a look at the historical rolling 30 year returns of the S&P 500 going back to 1926:
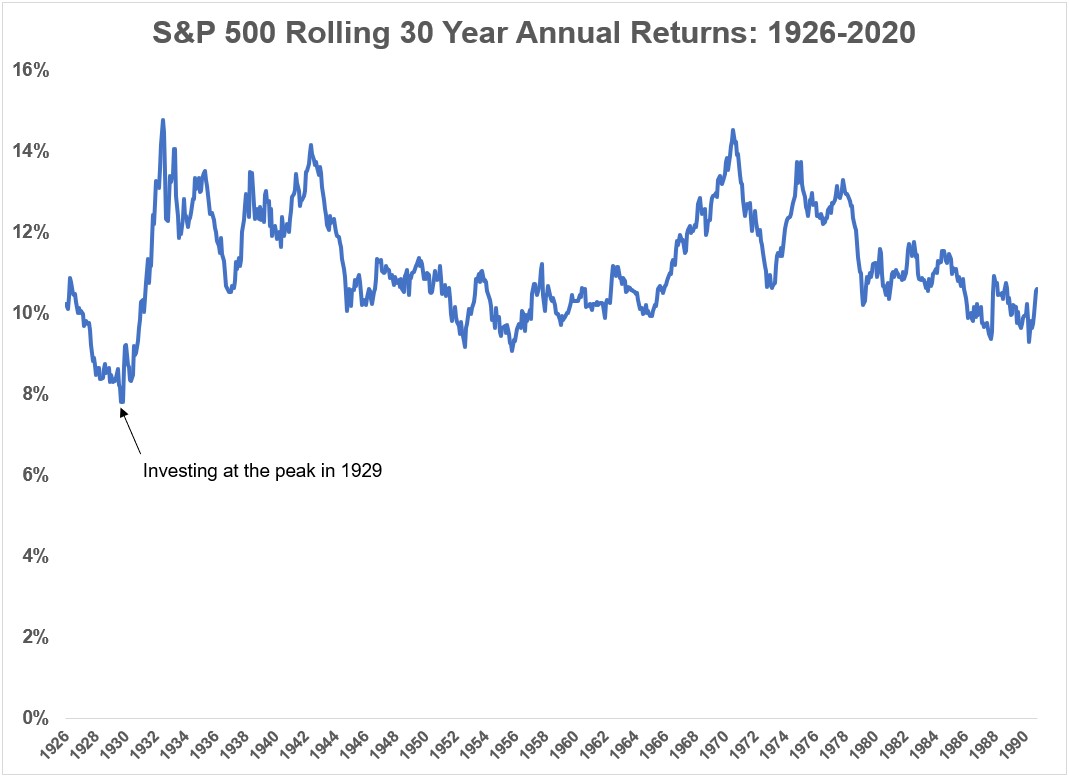
You can see the worst entry point in history came at the peak in 1929 just before the onset of the Great Depression. Shockingly, the 30 year performance of the stock market from that point forward was a gain of 7.8% per year. That’s a pretty good worst-case scenario.
There are some caveats involved when looking at this type of long-term data, the biggest one being there are only three non-overlapping 30 year periods here so the same size is fairly small:
- 1926-1955 +10.2%
- 1956-1985 +9.5%
- 1986-2015 +10.4%
Those numbers are all still pretty great and I’m sure the majority of investors today would sign up for those long-term returns in a heartbeat.
It’s also worth mentioning that worst 30 year starting point in 1929 is likely going to get overtaken by the peak of the market in 2000 by the end of this decade. The total returns from January 2000 through September 2020 were 242%. That’s 6.1% annualized.
Stocks would have to rise 175% in total or more than 10% a year from now until the end of 2029 just to hit the 7.8% annual return number in the 30 years following the 1929 peak.
Even if future long-term returns are lower going forward than they’ve been in the past (and there’s a good case to be made for this), it’s worth remembering even lower than average returns over a long time horizon can produce spectacular results.
For instance, that 7.8% annual return from the peak in 1929 constituted a total return of more than 850%. So the worst 30 year return over the past 100 years or so would have turned $10k into more than $95k. Not bad.
And let’s say markets do produce lower long-term returns going forward. Here are the total returns over 30 years with their corresponding annual return levels:
- 4% – 224%
- 5% – 332%
- 6% – 474%
- 7% – 661%
Even below-average returns in the 5-6% range would produce long-term total returns of 300% to nearly 500% over 30 years.
This is the beauty of a long-term stance in the markets. It doesn’t take much to see fantastic results, assuming you can stay the course for long enough.
Japan is the outlier historically but chances are there is going to be some asset class, region or investment strategy over your lifetime that produces lower than expected returns. This is the nature of risk.
This is how I think about protecting against these types of long-term portfolio risks:
Diversify across geographies, asset classes and strategies. Japanese stocks have been an enormous drag on a globally diversified portfolio since the bubble burst. But even though Japan made up almost half of the world stock market by 1989, the MSCI World Index is up nearly 750% since 1990 or 7.2% per year.
When Japan lagged, other countries, including the United States, picked up the slack.
And while those investors who kept a home country bias in Japan would still be hurting from the stock market, Japanese bonds have held up considerably better in this period.
Diversify across time. I made my first investment in the stock market in my mid-20s. I’ve been buying basically every week or so ever since. Some of those purchases have been better timed than others but dollar-cost averaging into the market over time helps shield you from making a single point-in-time purchase you might later regret.
Avoid extreme stances in the markets. I’m sure there were plenty of people who went all in on Japan after the fantastic performance in that country’s financial assets in the 1970s and 1980s. Taking extreme, concentrated positions is a great way to make a ton of money but also an easy way to go broke.
Save more money. This isn’t the advice most investors would like to hear but saving more money is one of the best ways to hedge a large number of risks in both the markets and life.
Further Reading:
Nothing Fails Quite Like Success in the Stock Market

