2019 was a good year for risk assets. Basically everything worked this past year:
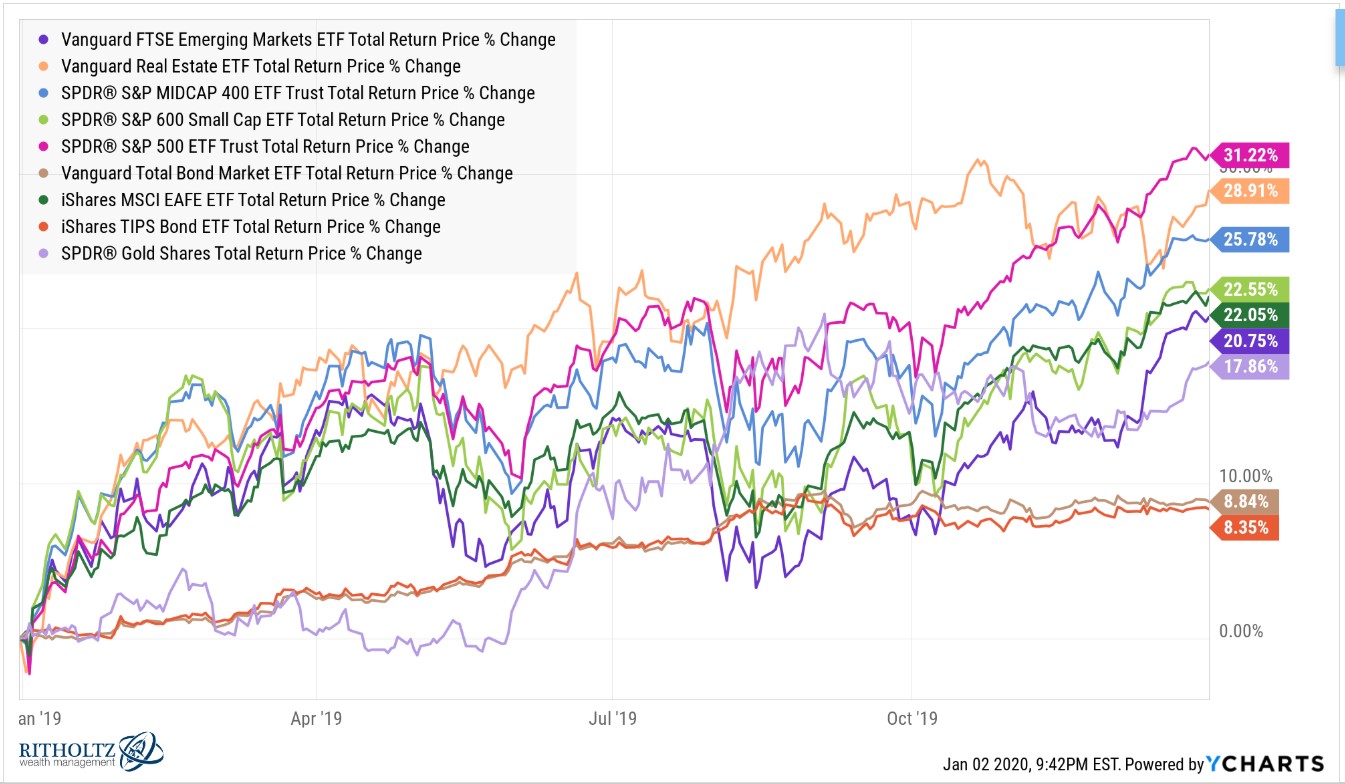
Large caps, mid caps, small caps, foreign stocks, emerging markets, REITs, bonds, TIPS, and gold were all much higher in 2019. If you couldn’t make money last year you were extremely unlucky, concentrated in the wrong securities or betting against the markets.
Interest rates were down which explains the strong returns in the bond market. Some would say the strong performance across the globe in stocks came about from easing by central banks, a prolonged economic recovery, animal spirits, or maybe a new Taylor Swift album.
No one really knows why stocks rise or fall in the short-term but maybe the easiest explanation stems from the fact that nothing worked in 2018:
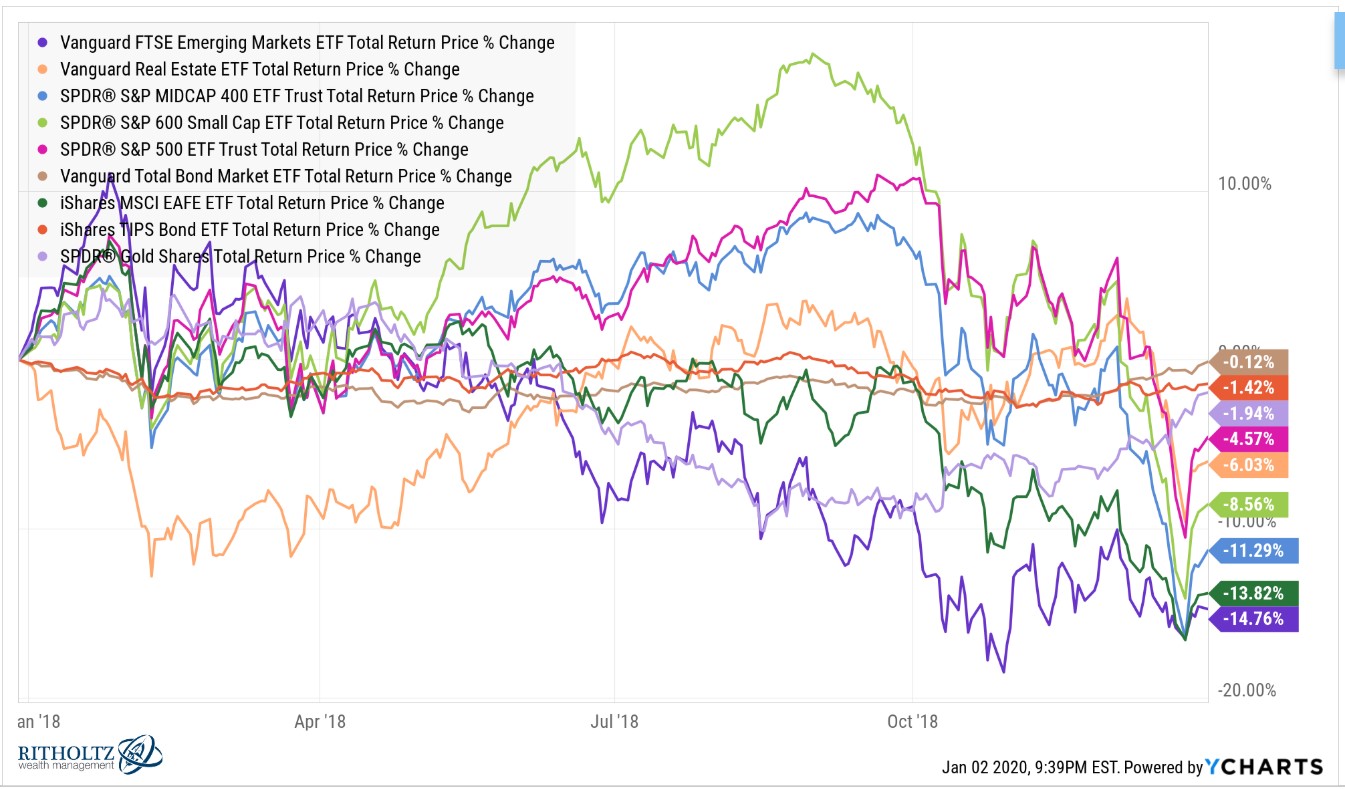
While everything was up in 2019, everything was down in 2018. Maybe the explanation is that simple.
Over the long haul, risk assets tend to rise, so it would make sense that they would rise and fall at the same time on occasion. But asset classes don’t always line up this perfectly.
For example, U.S. stocks (S&P 500) and bonds (5 year treasuries) have risen during the same calendar year 65% of the time since 1926. Roughly one-third of the time one of these asset classes has risen while the other has fallen in a given calendar year. And just two times over the past 94 years have both been down in the same year (1931 and 1969).1
Or how about foreign developed stocks (MSCI EAFE) and U.S. REITs (Dow Jones REIT Index)? Roughly one-third of all years since 1978 have seen these two asset classes alternate between gains or losses. This includes a 5 year stretch from 1998-2002 where they alternated gains and losses, providing valuable diversification benefits during a ridiculous stretch in the markets.
If we add more asset classes to this analysis the diversification benefits become even more apparent.
Since 1988, emerging markets (MSCI EM), U.S. large caps (S&P 500) and U.S. small caps (Russell 2000) have all risen during the same year in 17 of the past 32 years, or 53% of the time. That means at least one of these asset classes was down in a given year.
But they’ve only been down during the same year 5 out of 32 years (16% of the time). Looked at another way, 84% of the time at least one of these asset classes saw a positive gain in a given year while at least two were in the black nearly 70% of the time.
So situations like 2018, where everything was down, or 2019, where everything was up, can and will happen. But these scenarios are rare, especially when looking across a number of different asset classes and investment strategies.
It just so happens that these rare events occurred in back-to-back years which makes them feel more prevalent because they’re easily available.
Further Reading:
When Cash Outperforms Everything
Now here’s what I’ve been reading lately:
- The keys to financial success are incredibly mundane (Morningstar)
- Who’s in your headset? (Ryan Kruger)
- My semester with snowflakes (Gen)
- The long suffering (Irrelevant Investor)
- 11 ways to improve your life (Humble Dollar)
- Fascinating things learned in 2019 (Devin Sami)
- No asterisks (Reformed Broker)
- How things go viral (Big Picture)
15 year treasuries were barely in the black in 2018, rising a little more than 1%.
