In 2010, Exxon Mobil was the largest company in the S&P 500 with a market cap north of $350 billion.
By 2015 it was still the 5th largest company in the S&P with a market cap as high as $380 billion.
Since then the energy industry has fallen on rough times and Exxon now has a market cap of roughly $180 billion. It’s still one of the largest companies in the country but now ranks only in the top 30 by market cap.
Last Friday Apple was up more than 10% after beating earnings expectations. The increase in their market cap that day was an Exxon, rising by around $180 billion…in a single day!
The numbers for the biggest tech stocks are getting silly.
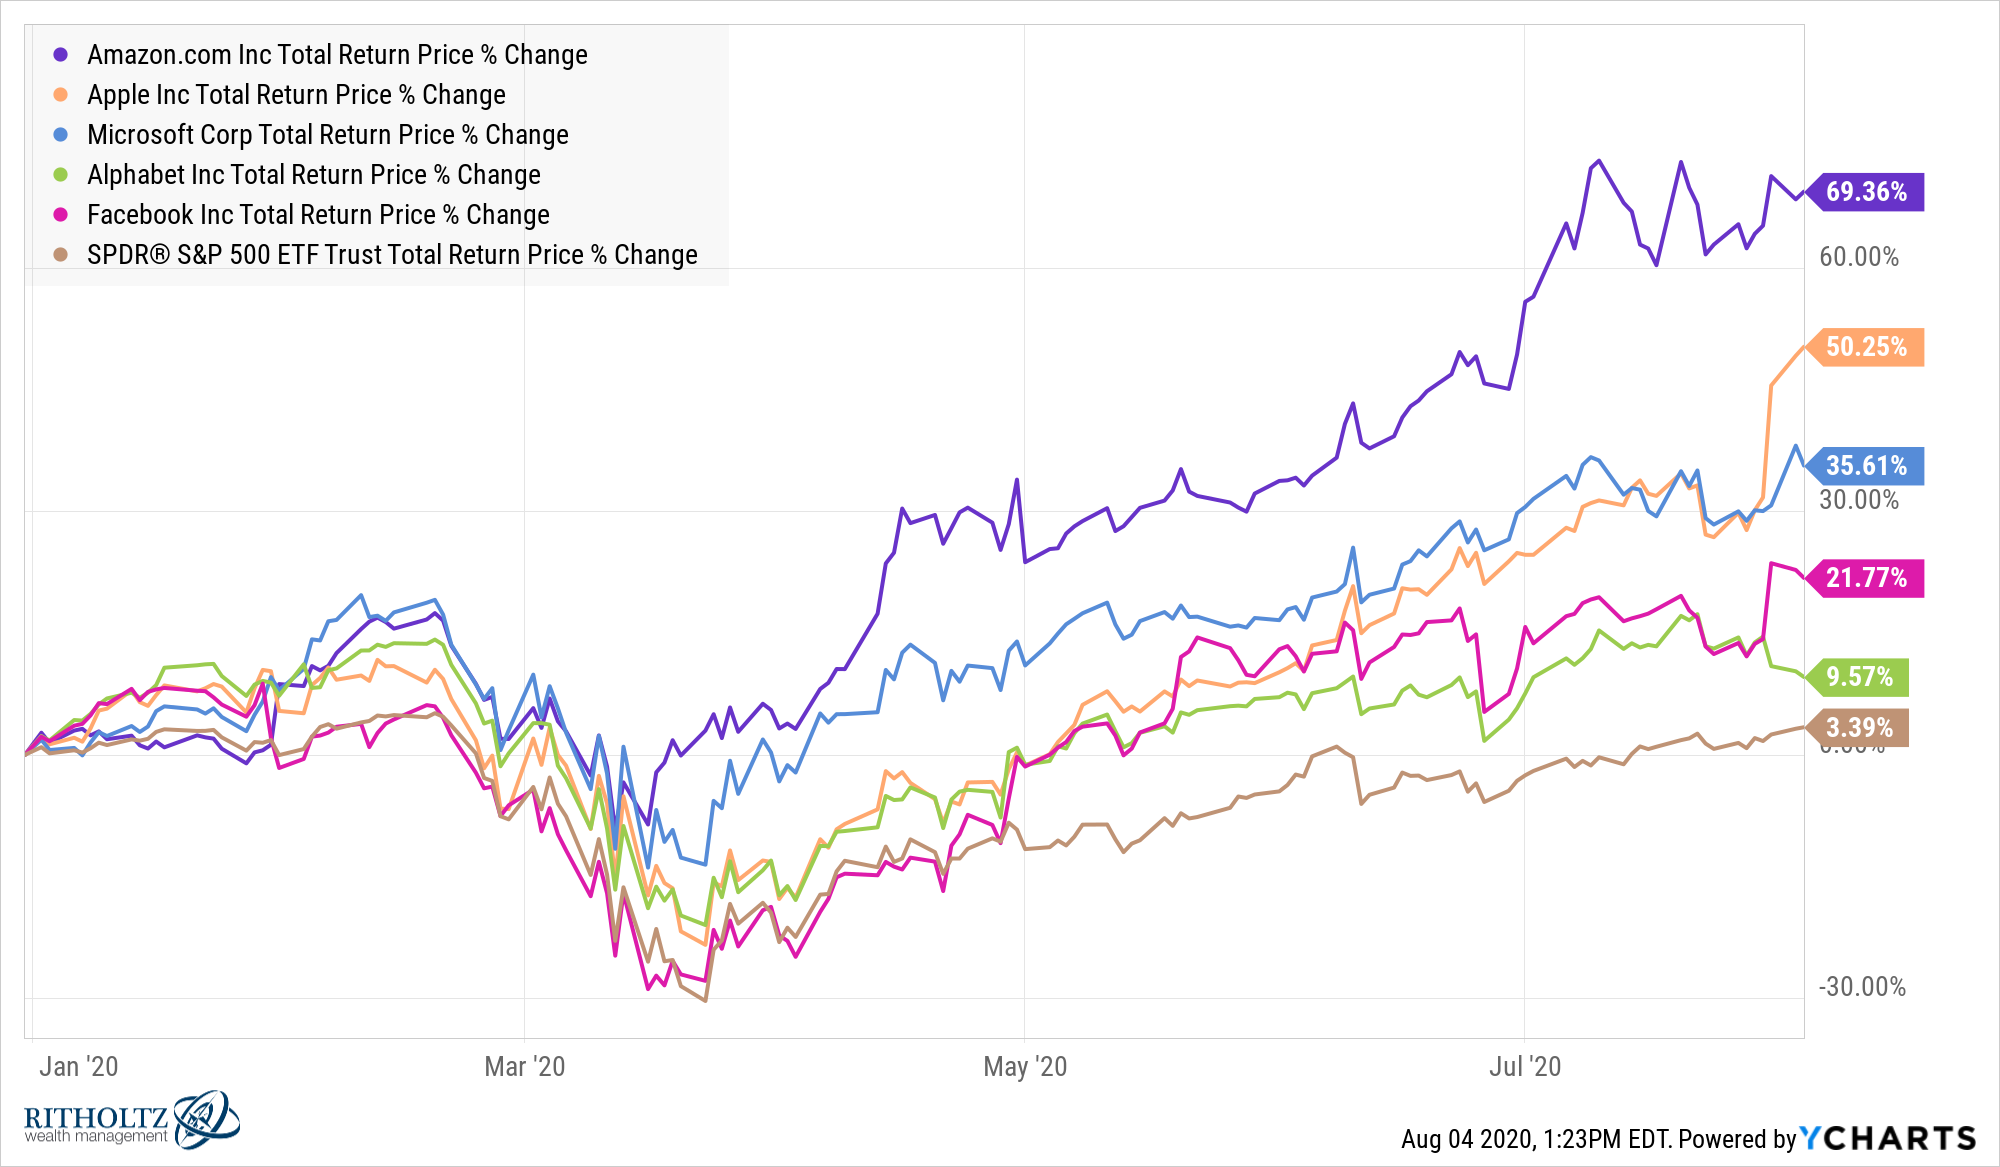
Apple now has a market cap within a stone’s throw of $1.9 trillion. Microsoft, Amazon and Google all have trillion-dollar market caps as well. Facebook is the 5th largest corporation in the index with a market cap of more than $770 billion, more than double Exxon’s size when it was king of the mountain.
This chart from Goldman Sachs is pretty telling in terms of how things have gone in the stock market this year because of the growth in these gigantic names:
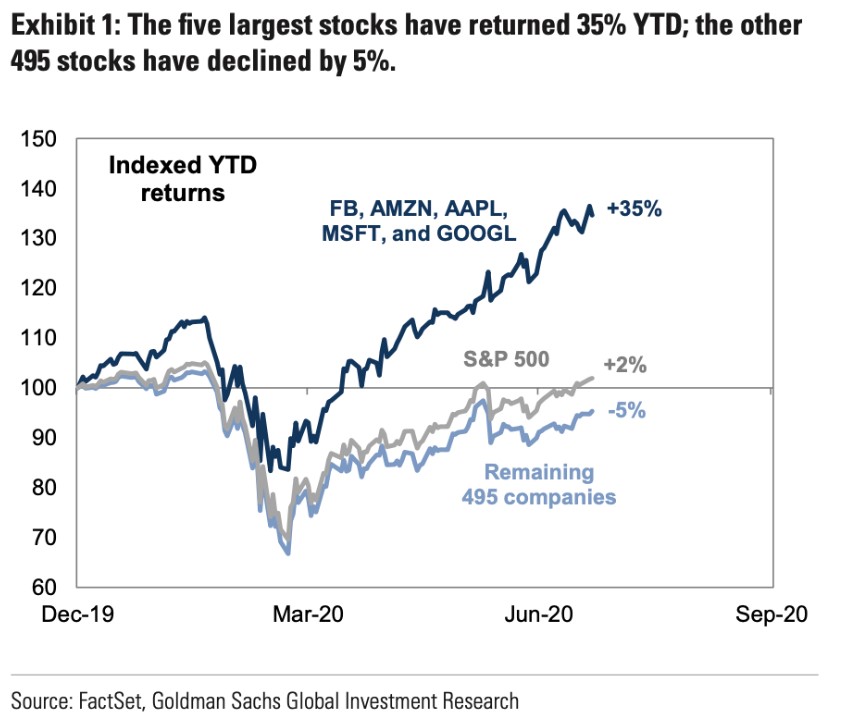
The biggest tech stocks have only gotten bigger. Here are the year-to-date returns compared to the S&P 500:
It’s a miracle the S&P 500 is now up more than 3% on the year but that number looks tiny compared to the returns of our tech overlords.
So tech stocks are ruling the day yet again and remain the only stocks doing well this year, right?
Not necessarily.
Yes, these gargantuan companies continue to pile up huge returns even as they have reached market caps in the cuatro common club. But that chart from Goldman Sachs is a tad misleading, even though it’s technically accurate.
While the S&P 500 is up a 3% or so this year, there are 142 stocks (as of yesterday’s close) in the S&P 500 that are up at least 10% or more. On the other hand, there are 220 stocks down 10% or more this year.
This is a list of the top 30 performers in the S&P 500 through yesterday:
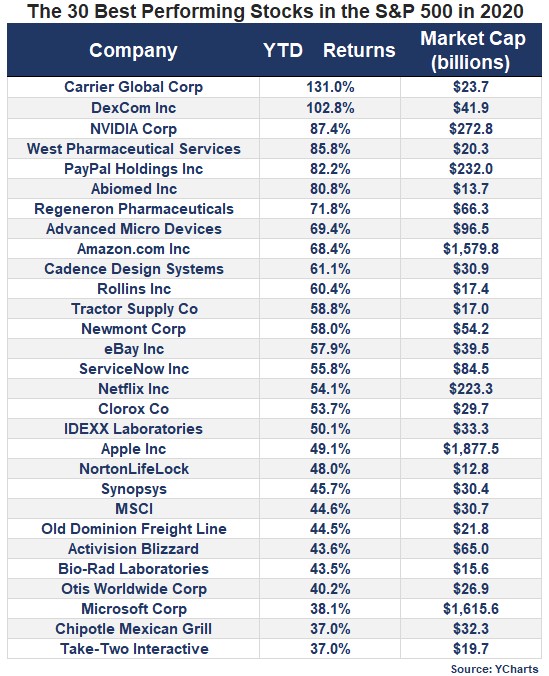
The big stocks are on here but it’s not all of these stocks are the mega-caps. It’s just that the mega-caps have a bigger share of the market.
Here’s an update of the distribution of returns within the S&P 500 this year:
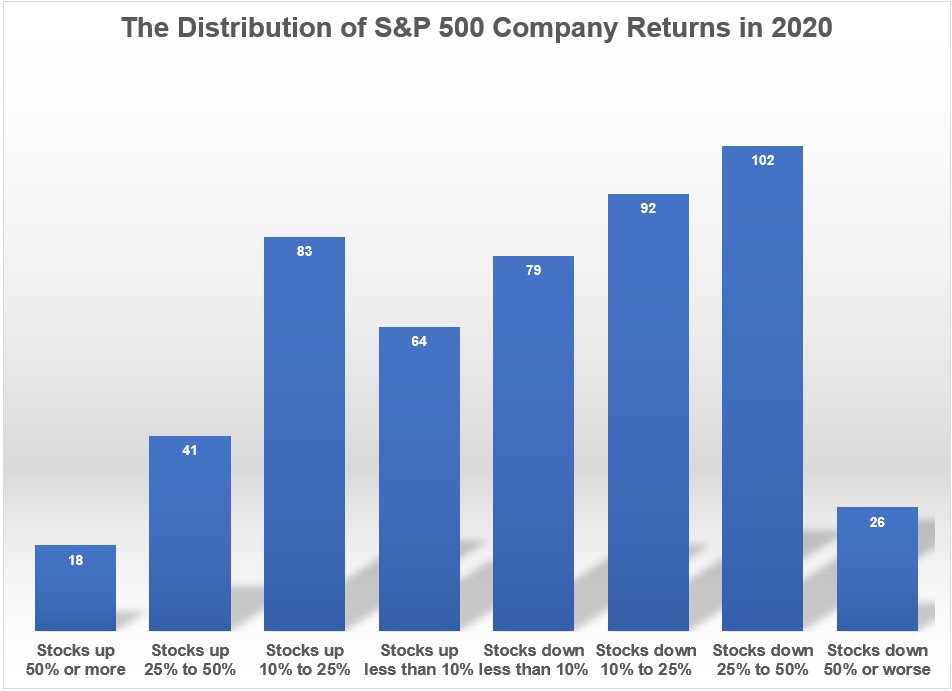
There is always a wide range of returns within the stock market itself. The best performer this year (Carrier Global) is up more than 130% while the worst performer (Norwegian Cruise Lines) is down almost 80%.
When Exxon was the largest company in the S&P 500 in 2010 the largest 5 companies made up less than 11% of the index. Today, the 5 largest companies make up nearly 23% of the entire S&P 500.
The nature of market cap-weighted strategies means the companies with the largest market caps will always have a say in the performance. The market has been this concentrated in the past but it’s been a while since the numbers have been this high.
It’s just that now the concentration in the index is so much greater than it was in the recent past so the biggest stocks are going to have an outsized impact on the results.
This year the biggest stocks have helped performance. In future years they could hurt results.
Right or wrong, the winners write the history books in the stock market. And for now, Apple, Amazon, Microsoft, Google and Facebook are the winners.1
Further Reading:
Explaining the 2020 Stock Market
1Until one or more of them are displaced by other companies in the future. It doesn’t feel like it now but this will happen.

