We touched on the yield curve on this week’s Animal Spirits because it seems to be the main point of contention in the markets right now. It’s all any of us market nerds can talk about, partly because the markets are somewhat boring this year and partly because investors love to try their hand at predicting the next recession.
I ran the numbers for a piece earlier this year to show that what follows a yield curve inversion typically isn’t great for stocks or the economy.
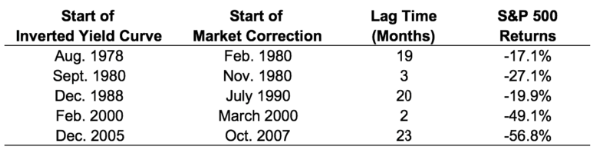
For a quick refresher, here’s the data on stocks:
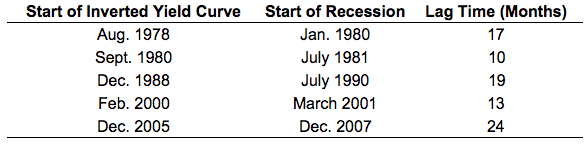
And now the recessions:
And here’s what investors are holding out hope for:
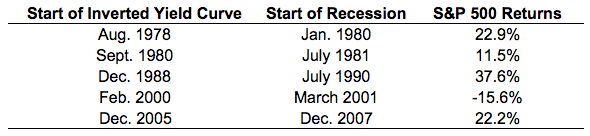
The evidence looks fairly conclusive and everyone seems to agree that in inverted yield curve means (a) a recession shouldn’t be too far behind, (b) stocks will likely take a big from a recession and (c) stocks should still have some room to run before any of this occurs.
I’m always a tad skeptical when people assume they have a magical signal that will tell them exactly when or why something will happen in the markets or the economy. Of course, there is a legitimate reasoning behind the inverted yield curve signal, as I mentioned previously:
This matters because bond yields are typically used to gauge the health of the economy. Wider spreads between short-term and long-term bonds lead to an upward sloping yield curve, which can indicate healthy economic prospects — most likely faster growth and inflation in the future. Narrower spreads lead to a flatter or even negatively sloped yield curve, which can indicate poor economic prospects — most likely slower growth and inflation.
When quants look at signals for their models they like to run the data across a number of different asset classes, market caps, and geographies to test for how robust their work is. I’ve seen plenty of work on the strength of the yield curve relationship in the U.S. but not much about how it has worked historically overseas.
A reader sent me a research paper that looks into this one. It’s called The Predictive Power of the Yield Curve Across Countries and Time by Menzie Chinn and Kavan Kucko of the National Bureau of Economic Research.
Here’s what they discovered on the impact on industrial production numbers across a number of different countries:
The yield spread in the United States, Germany, France and Canada explains more than 20 percent of the changes in annual industrial production growth. In contrast, the yield spread explains less than 10% of the variation in output in Italy, the Netherlands, and Sweden.
Overall, when using the entire data series from 1970‐2009, in‐sample results suggest the yield spread is indeed important and has significant predictive power when forecasting industrial production growth over a one‐year time horizon.
Now here’s the takeaway on the recession signal:
Generally speaking recessions were well predicted by the yield curve across countries in the 1970s and 1980s. When we look at recessions in the 1990s and 2000s however, results are less consistent. Across most countries recessions earlier in the data set were predicted better when including the short‐term interest rate level whereas more recent recessions tend to be better predicted with the yield spread alone. While this stylized fact may be indicative of a structural change in the relationship between interest rates and future economic activity, it could also be due to the decline in short‐term interest rate volatility relative to the decline in yield spread volatility since 1995.
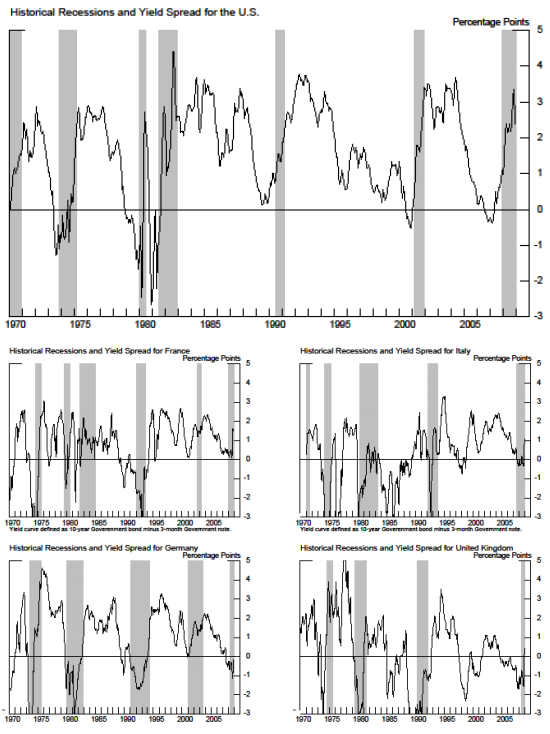
They also included a nice set of charts to visualize this relationship in the U.S., France, Italy, Germany, and the UK:
And finally the conclusion:
The marked deterioration of the significance in the Japan model when using data corresponding to Japan’s period of zero interest rate policy (ZIRP) might presage a weakening of the significance of the relationship in the United States, given the effective Federal funds rate has reached the zero lower bound.
In other words, we do not obtain a simple story for the yield curve’s predictive power. The yield curve clearly possesses some forecasting power. However, there is also some evidence the United States is something of an outlier, in terms of its usefulness for this purpose. And overall, the predictive power of the yield curve seems, with some notable exceptions, to be declining over time.
I’m not going to argue with an inverted yield curve. It seems like every time this happens people come up with reasons for it not working anymore. I think you have to give it the benefit of the doubt until it’s proven wrong.
But the fact that the Fed has been suppressing interest rates at levels never seen before does provide a smidge of doubt that the future will turn out just like the past when looking at this signal.
All of which is to say, I don’t really know what’s going to happen but it always makes sense for investors to have a game plan in mind for the possibility of a recession striking, no matter the reason for it.
There’s no such thing as never or always in the markets but this is still something worth watching.
Source:
The Predictive Power of the Yield Curve Across Countries and Time
Now here’s what I’ve been reading this week:
- Learning how to invest by doing (Abnormal Returns)
- The story of my life (Russ Roberts)
- The humble express (Real Smartica)
- The most important asset (Dollars and Data)
- When I’m 64… (Humble Dollar)
- Young investors: here are your first steps (Reformed Broker)
- Pareto in the stock market (Irrelevant Investor)
- The history of the printed word 1400-1499 (Prepressure)
- Can hindsight bias be inherited? (Morningstar)
- How to be less wrong (The Polymath Project)
