Boy that escalated quickly.
Markets sold off in a hurry this week.
The S&P 500 is down almost 6% from the recent highs. The Nasdaq 100 is in an 11% drawdown.
After an extremely calm year, the past week or so has finally seen some volatility in the stock market.
Here’s the thing — it’s what happened before this that was not normal:
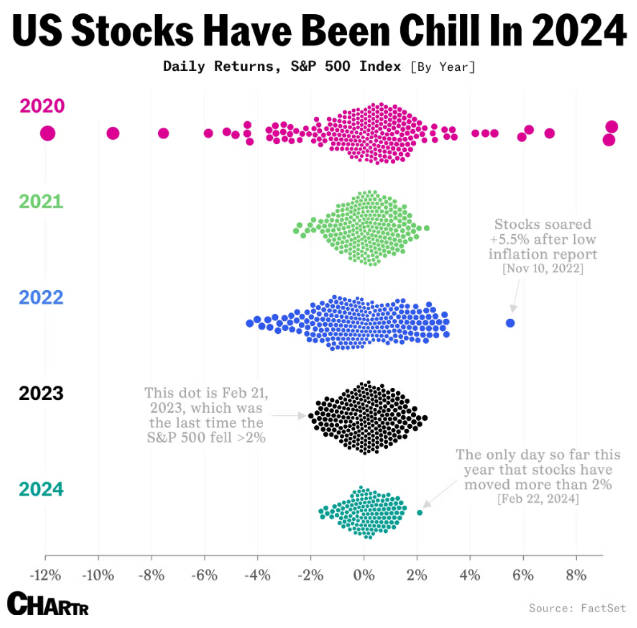
This really cool chart came out a couple of weeks ago (via Sherwood). It shows how abnormally calm the stock market was in 2024 before the current correction.
That situation couldn’t last forever so it didn’t.
I hate love to be the guy who provides these reminders during every single correction but this is perfectly normal.
The stock market is supposed to fall every once in a while. It can’t just keep going up forever.
The U.S. stock market experiences a correction almost every year:
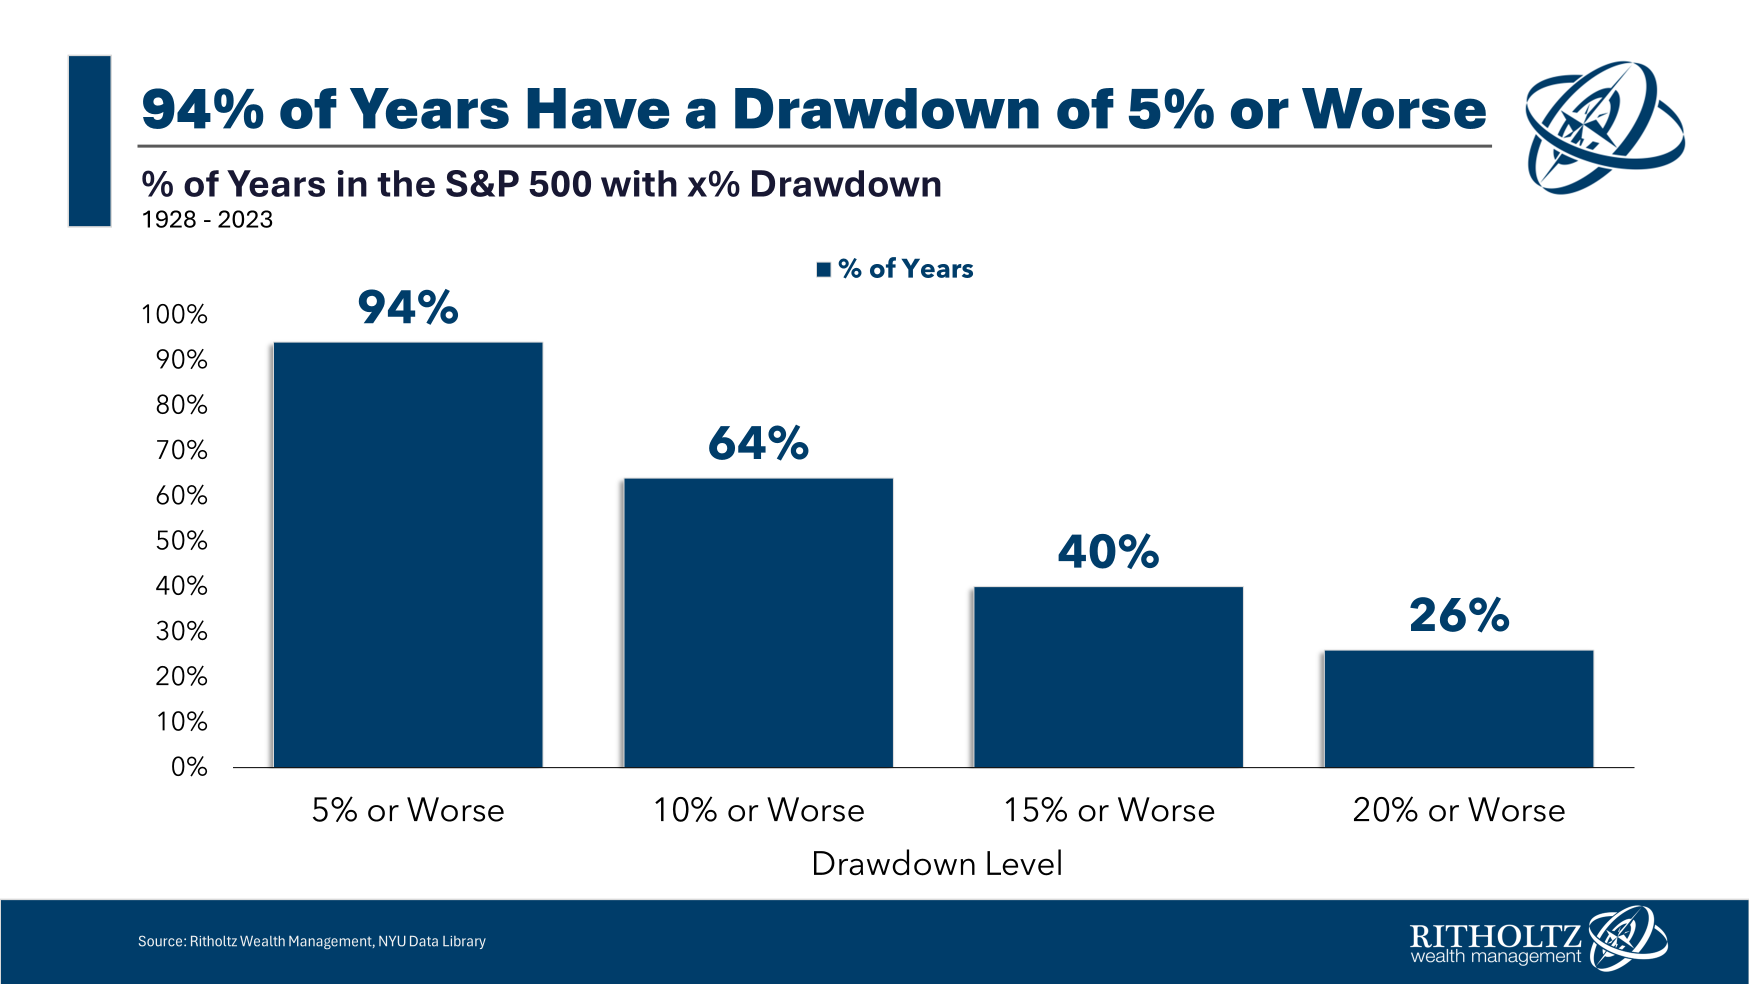
A 5% downturn is all but guaranteed in most years.1
A double-digit drawdown happens around two-thirds of all years since 1928.
The average intrayear drawdown from 1928 to 2023 was -16.4%. Since 1950, the average correction in a given year was -13.7%. This century it’s been -16.2%.
If anything, the current correction is weak based on historical data.
It could get worse. I don’t know what’s going to happen the rest of the year. One week does not a market make.
The S&P 500 is still up nearly 13% on the year. It was up as much as 20% at one point but we’re still looking at a double-digit total return in 2024 (so far).
I don’t know if that will hold for the remainder of the year but it’s perfectly normal to experience a decent-sized correction even when the market finishes the year with solid gains.
From 1928 through 2023, the S&P 500 was up 70 out of the 96 years (73% of the time). In 35 of those 70 years with positive returns, there was a double-digit correction along the way. So half of all years with a gain experienced double-digit losses to get there.
The stock market goes down even when it goes up.
This is true even when stocks go up a lot.
The S&P 500 has finished the year up double-digits in 56 out of 96 years since 1928 (almost 60% of the time). In 24 of those 56 years with double-digit gains, there was a double-digit loss at some point in the same year. That means nearly 45% of the time when the stock market has been up 10% or more, there has been a correction of 10% or worse on the path to those gains.
Maybe this year finishes with yet another double-digit gain, maybe not.
Maybe we see another double-digit drawdown, maybe not.
When investing in the stock market you have to be prepared for both possibilities. Big gains and big losses are par for the course when it comes to investing in stocks.
Volatility is the price of admission when it comes to investing in equities.
That’s true when markets go up or down.
Further Reading:
What Does a Healthy Correction Look Like?
1The last year the S&P 500 didn’t experience a drawdown of at least 5% was 2017. That was an exceptionally boring year for the market.
