Here’s a look at the annual performance of the various sectors in the S&P 500 going back to 2009 using the State Street sector ETFs:
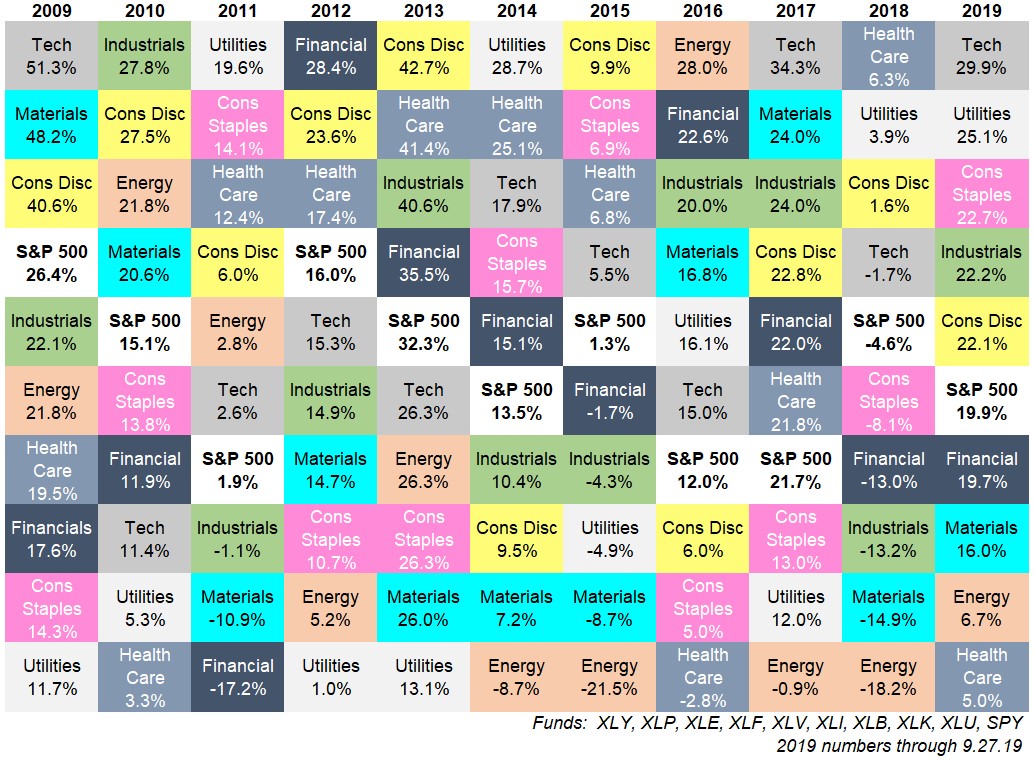
Some observations:
Opportunities abound. The range of returns by sector is wide enough to drive a truck through it. The average difference between the best and worst performing sectors from 2009-2019 is more than 31% (and the lowest range was 25% from high to low). The market is full of opportunities, for both outperformance and underperformance depending on your sector of choice.
The surprising best performer. Here are the total returns by sector going back to 2009:
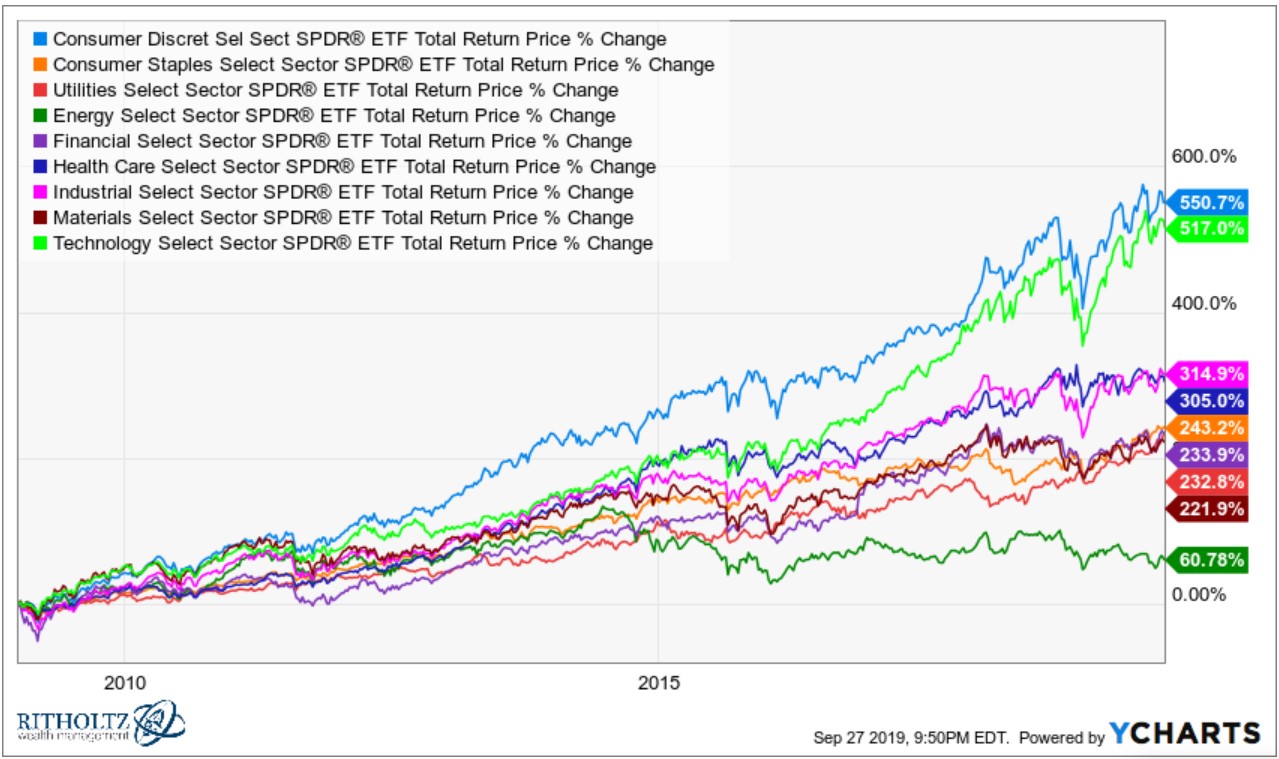
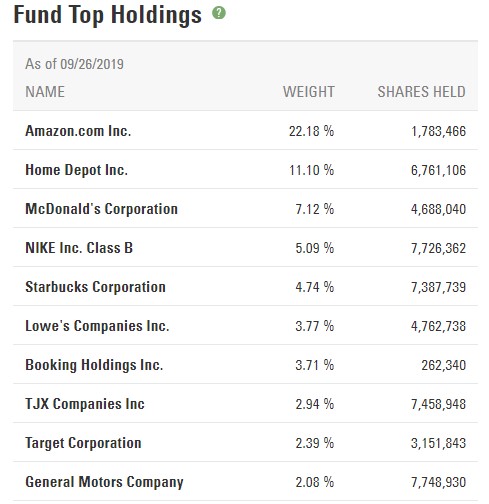
It’s surprising the consumer discretionary sector (XLY) is the best performer. I was sure it would be the tech sector (XLK). But this makes more sense when you consider Amazon makes up more than 20% of XLY:
Energy is sucking wind. Energy stocks are by far the worst performer since 2009. Things look even worse on a relative basis since 2014:
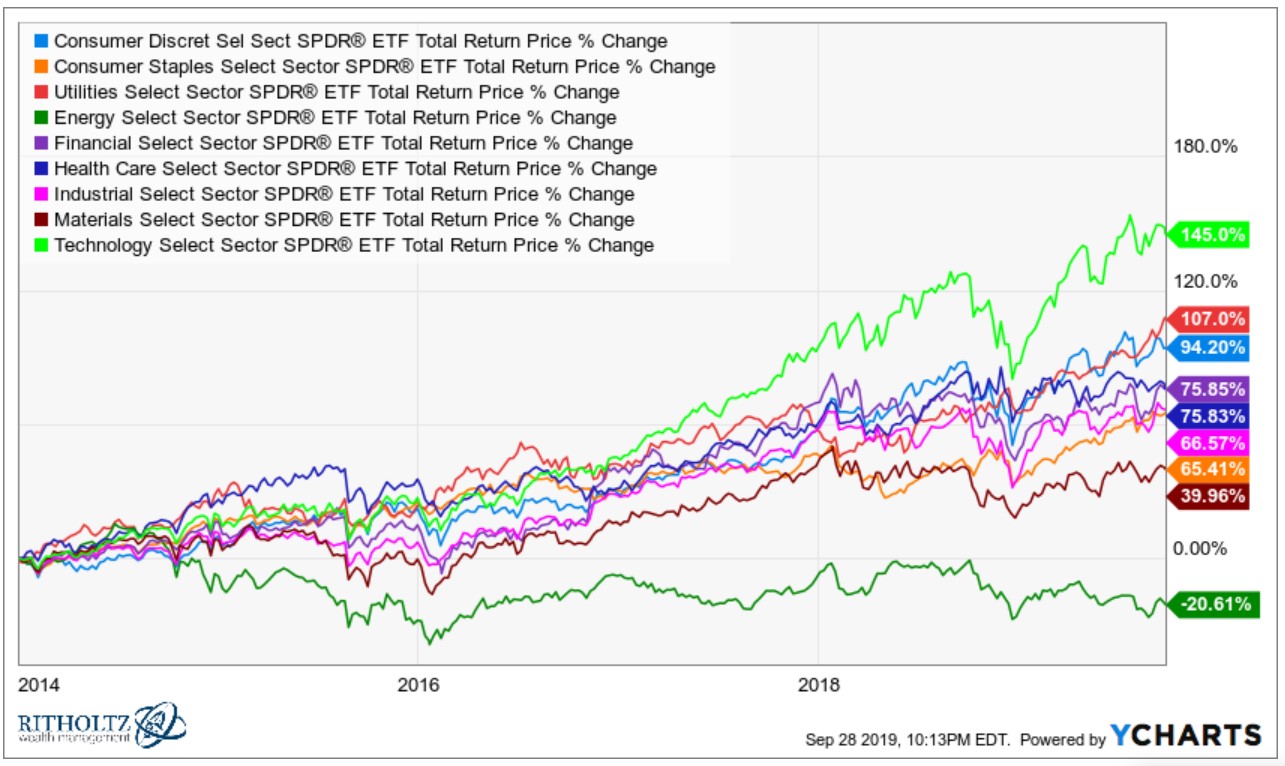
Energy stocks are down by more than 20% while the S&P 500 is up nearly 80% in total.1
There are two general reactions from investors when a subset of stocks is underperforming by such a wide margin: (1) it’s time to back up the truck on the beaten-down stocks or (2) there’s a good reason for the underperformance and no reason to believe the pain is over just yet.
So you’re either buying when there’s blood in the streets or catching a falling knife.2
Beaten down sectors don’t always offer a fat pitch. Financials were the worst performers from 2007-2008 by a wide margin:
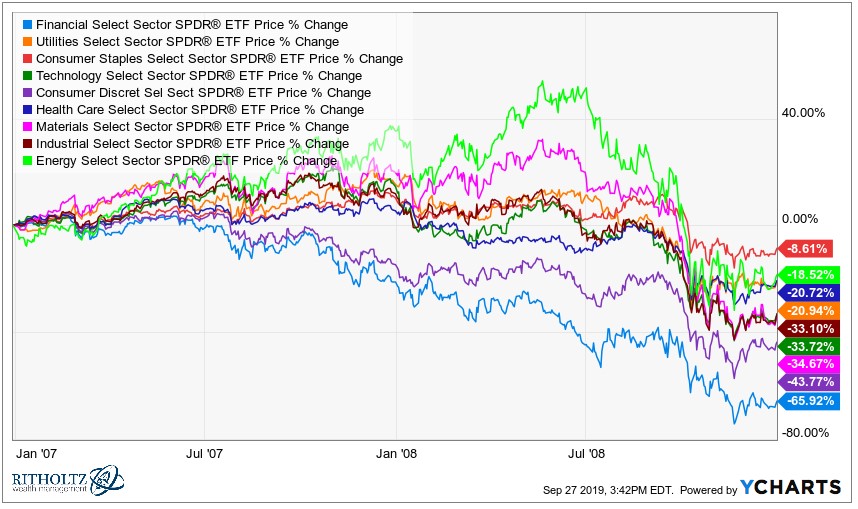
I recall a number of fund managers were loading up on financials during the crisis and its aftermath after they got crushed so badly.
More than 10 years later, financials were the 5th best-performing sector (out of 9 in total) from the start of 2009. That opportunity has yet to materialize.
Energy stocks may very well present a wonderful opportunity at the moment since they’ve performed so poorly. But there’s no rule written in stone that says the most beaten-down sector will automatically outperform on the other side.
Backtesting sector rotation strategies is tricky business. Backtesting sector strategies is tough because it’s harder than ever to bucket many of these companies.
Just in the last few years they’ve added two new sectors, real estate (XLRE) and communications (XLC). Here are the top holdings in the new communications sector:
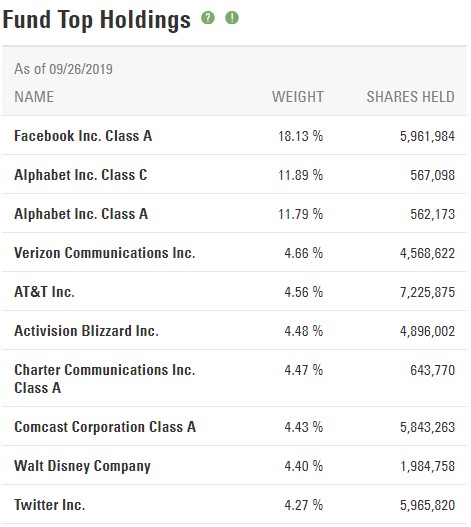
What’s the right sector label for Google, Facebook, Twitter, Amazon or Apple? For most investors it probably doesn’t make a difference. But if you’re using historical data to rotate between different sectors, these labels can make a big difference.
Picking the right sector requires more than simply picking the best sector. You can be the best stock-picker in the world but if you choose the wrong sector you’re out of luck.
Or you could pick the best sectors but if you choose the wrong geography then you’re out of luck.
Or you could pick the best geography to be in but if you choose the wrong asset class then you’re out of luck.
Picking the best stocks or sectors can lead to outsized gains in the markets and that’s why many people play this game.
Unfortunately, investing in extremes and consistently trying to pick only the biggest winners in the market can open you up to the prospect of big losses.
Further Reading:
One Way to Beat the Market
1Maybe something, probably nothing but it is surprising to note that tech stocks are the only sector to outperform the S&P 500 since the start of 2014.
2I guess in both cases blood is involved?
