The S&P 500 last hit a new all-time high on January 3, 2022.
The market has been slowly but surely working its way back to new highs but we’ve been underwater for nearly two years now:
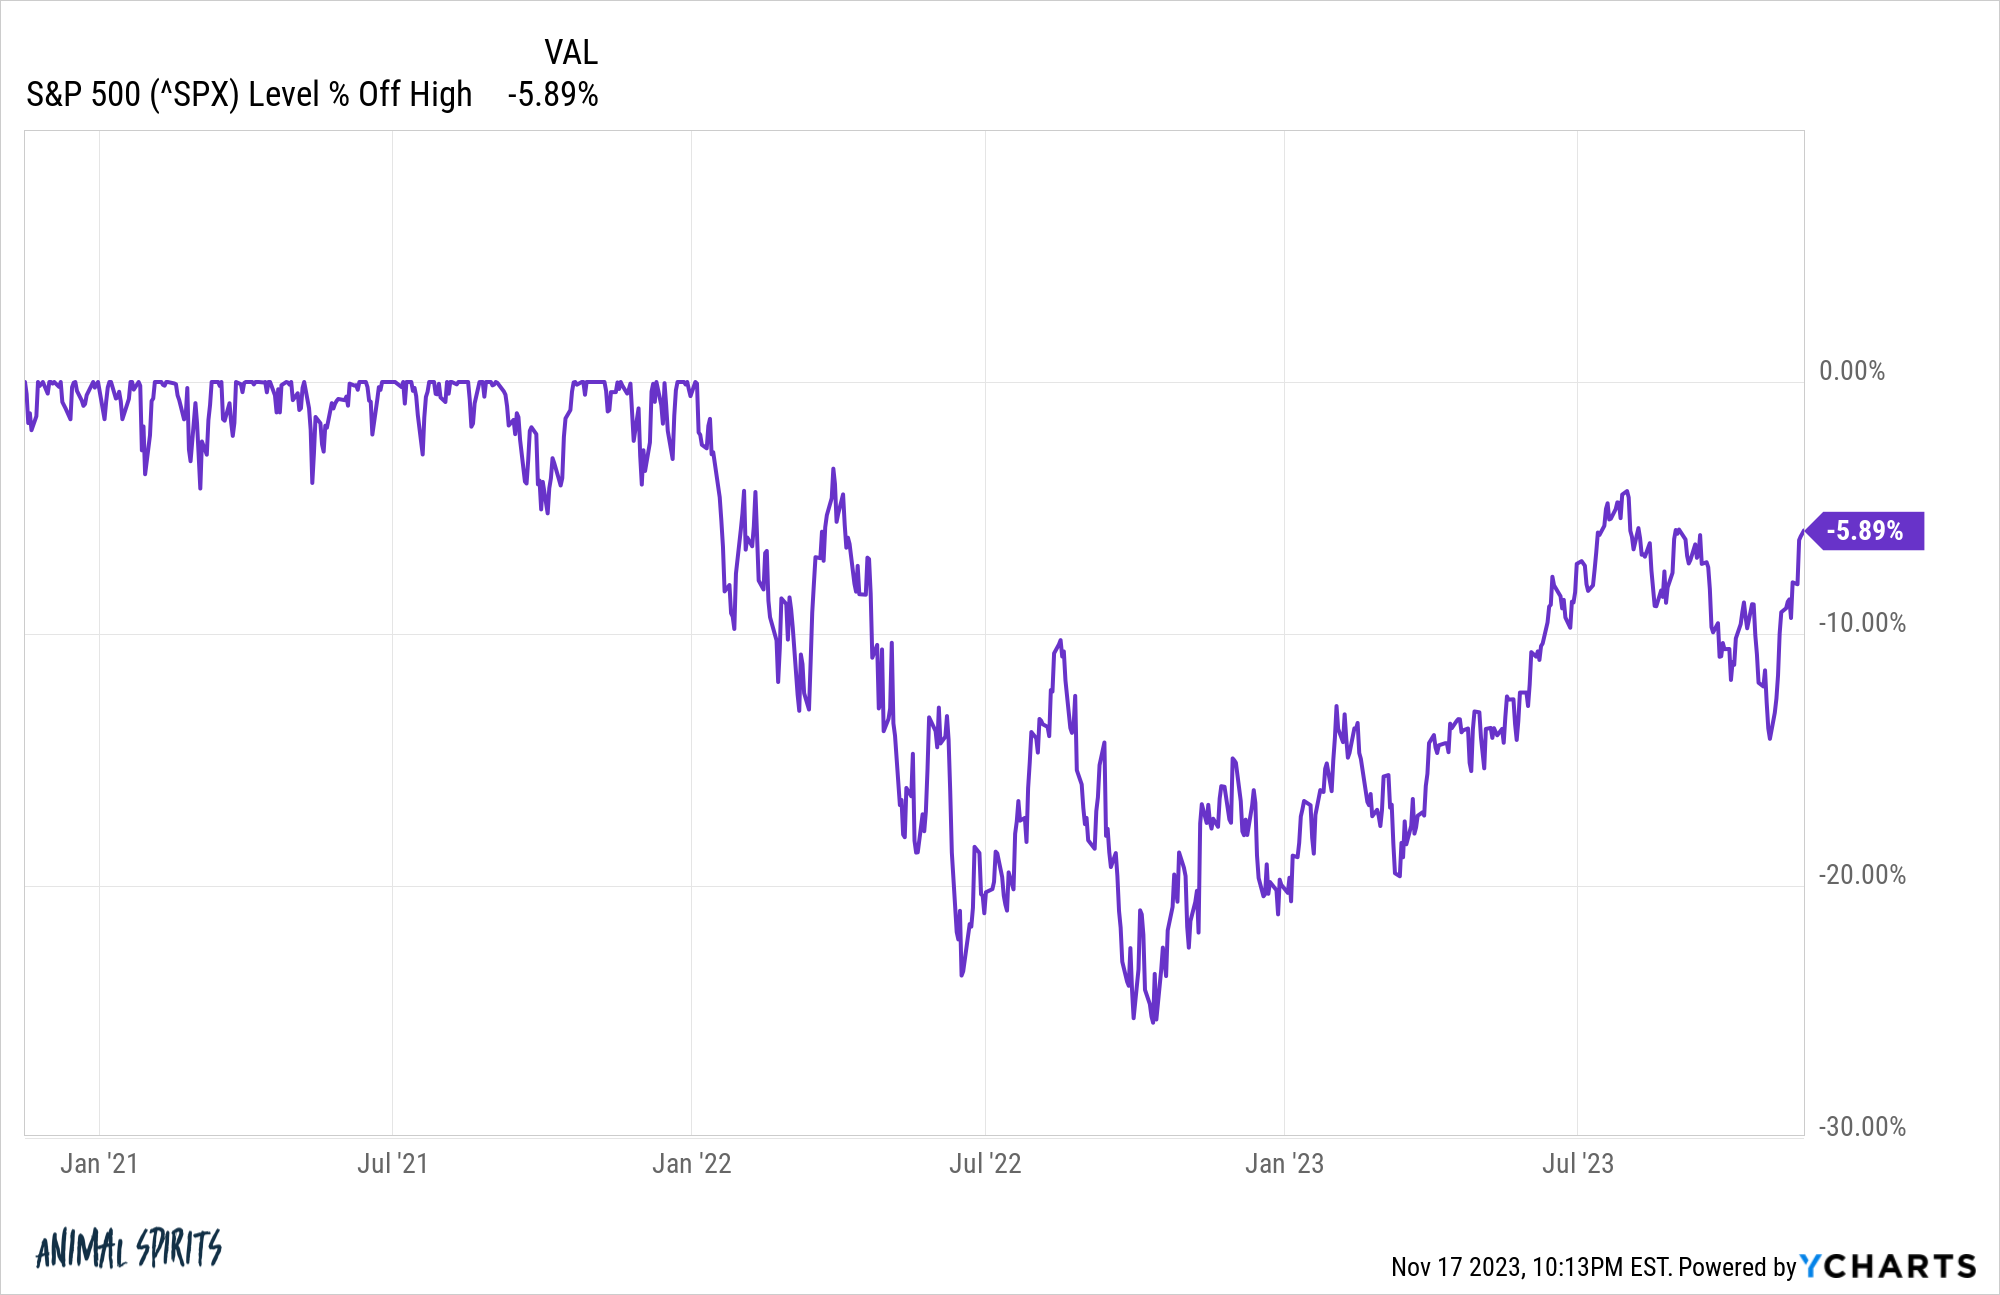
The market is within spitting distance of new highs but stocks have gone nowhere for almost two years.
We’re a little less than four years into the 2020s and half of those years have seen no new highs but there have already been plenty of them this decade.
Here are the number of new all-time highs by decade1 going back to the 1950s:
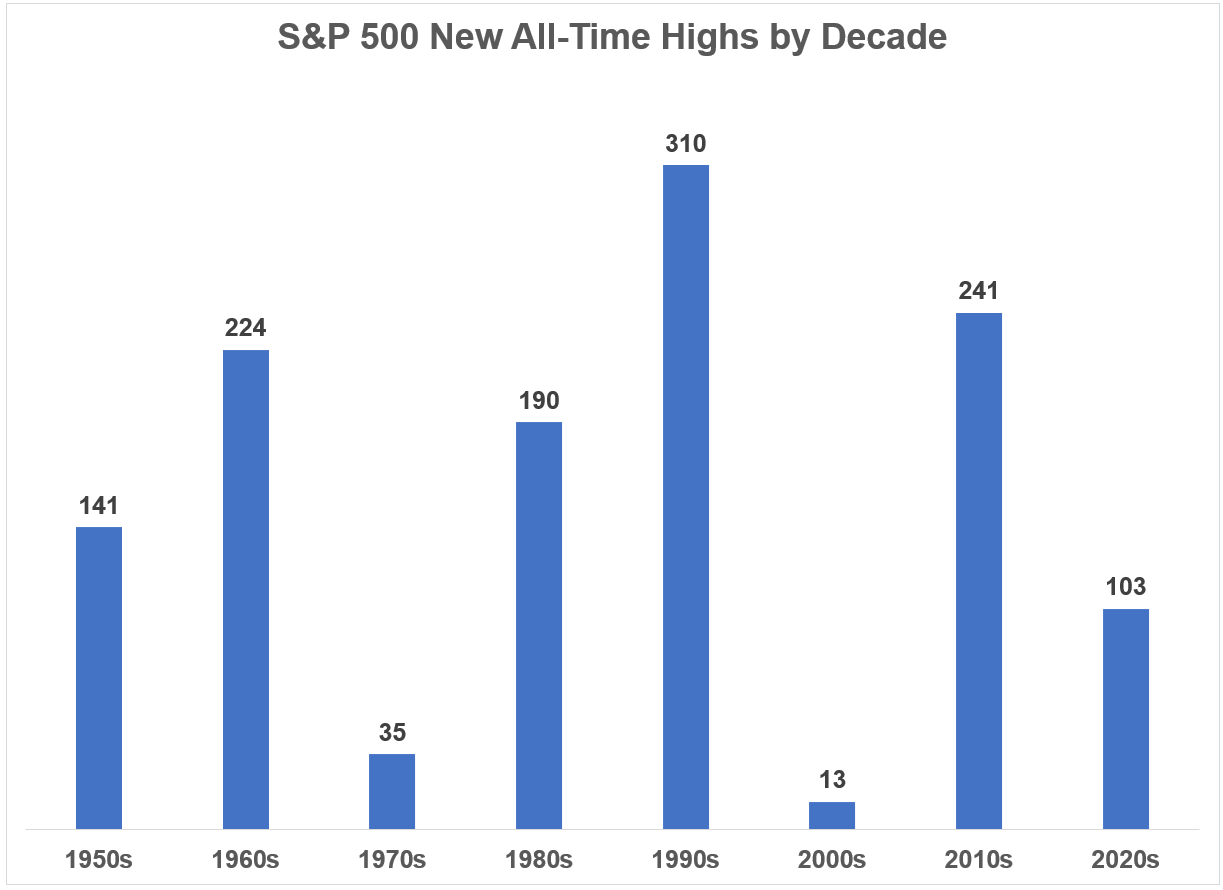
The stock market is erratic so some decades we get lots of new highs while others we get very few.
By my calculations, we’ve now gone 473 trading days without new highs for the S&P 500.
That’s actually the fifth longer streak since 1950:
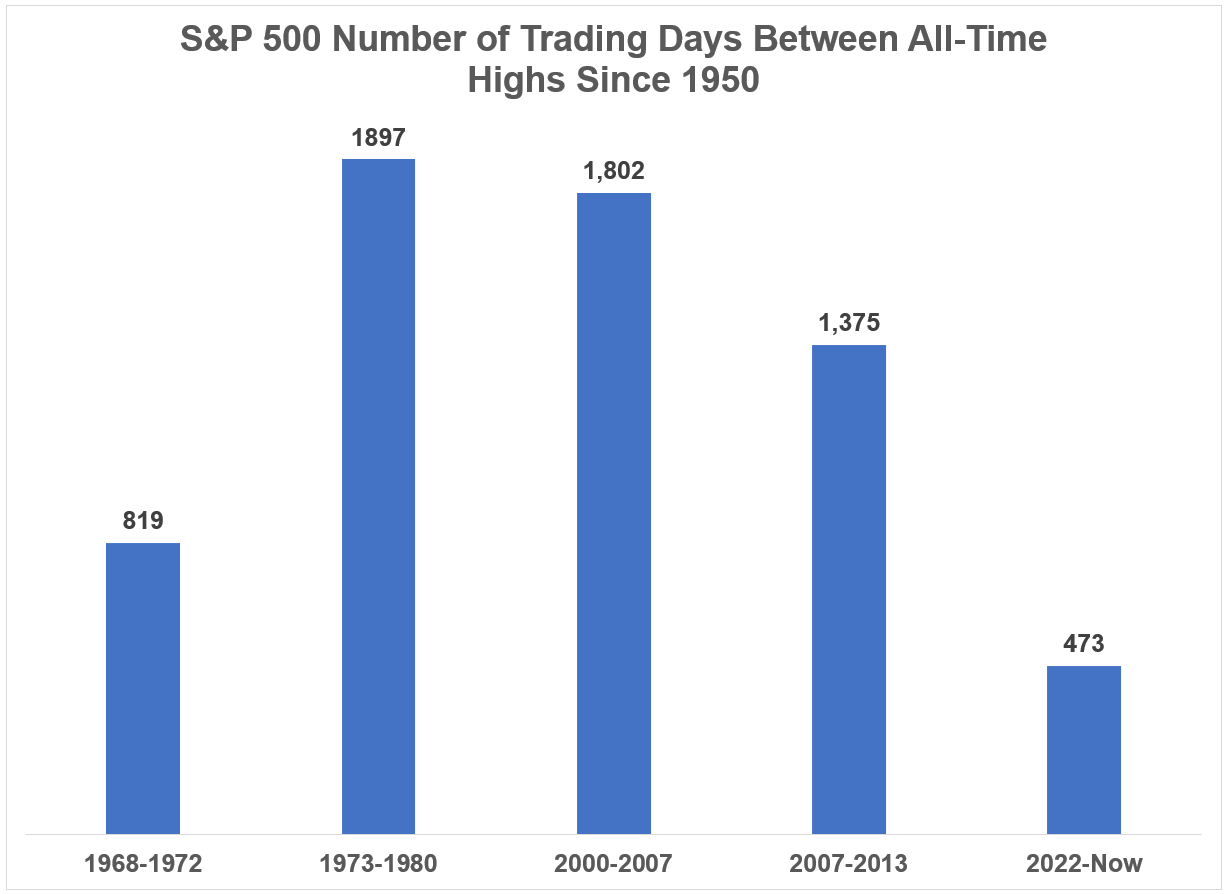
The craziest thing about those other streaks is how close they were in proximity.
In each instance, you had a downturn, followed by a brief reprieve bull market and then an even bigger downturn in short order.
Both periods saw the stock market more or less tread water for 13 years.
The bear market at the end of the go-go years from 1968-1970 is one of the more forgotten crashes in history, followed a few short years later by the nasty 1973-1974 bear market.2
And we all know about the lost decade that kicked off this century which saw the stock market get cut in half twice.
The S&P 500 was up 6.8% per year from 1968-1980 but that return was completely eaten up by the 7% inflation rate in that time.
The market was up a total of 23% from 2000-2013, an annual return of 1.6% per year.
Despite the fact that you had two extended periods where investors saw few new all-time highs, if we look at the returns from 1968-2013, the stock market was still up almost 10% per year.3
This is one of the reasons the stock market can be so maddening. Returns are lumpy. They can be horrifying for extended periods of time. You could be underwater for years at a time.
It’s possible we could see new all-time highs on the S&P 500 by the end of this year or early next year. And then we could experience another bear market that sees stocks go nowhere for even longer. Or we could be witnessing the birth of a new bull market.
The truth is no one knows what comes next for stock prices.
This is one of the reasons stocks offer a risk premium over other asset classes.
There is always the possibility of a lost decade or a raging bull market.
The important thing for investors is your financial plan should build in the expectation that both of these scenarios are probable over your investing lifecycle.
You just don’t know when.
Further Reading:
All-Time Highs, Risk & Consequences
1I started here in the 1950s because there weren’t any new all-time highs in the 1930s or 1940s. It took until the early-1950s to roundtrip from the 1929 highs following the Great Depression.
2The 1973-1974 bear market needs to hire a publicist. I don’t know how this near-50% crash (worse after inflation) didn’t get a nickname. The Great Inflation is OK but I’m open to suggestions.
3Real returns were close to 6% per year after inflation.

