Stories about value investing are the equivalent of your kids asking “Are we there yet?” over and over again on a road trip:
The value investing equivalent of “Are we there yet?” is this:
June 23, 2019: Is value investing dead? It might be and here’s what killed it (CNBC)
September 6, 2018: Is value investing dead? (Morningstar)
September 24, 2017: Is value investing dead? It depends on how you measure it (WSJ)
September 22, 2016: Is value investing dead? (Common Fund)
May 29, 2015: Is value investing dead? (Globe and Mail)
April 11, 2013: The death of value investing (Business Insider)
January 14, 2010: Is value investing dead? (Motley Fool)
Value investing has had a tough go at it so it’s not surprising to see these stories pop up on a regular basis. Growth has handily outperformed value going all the way back to 2003:
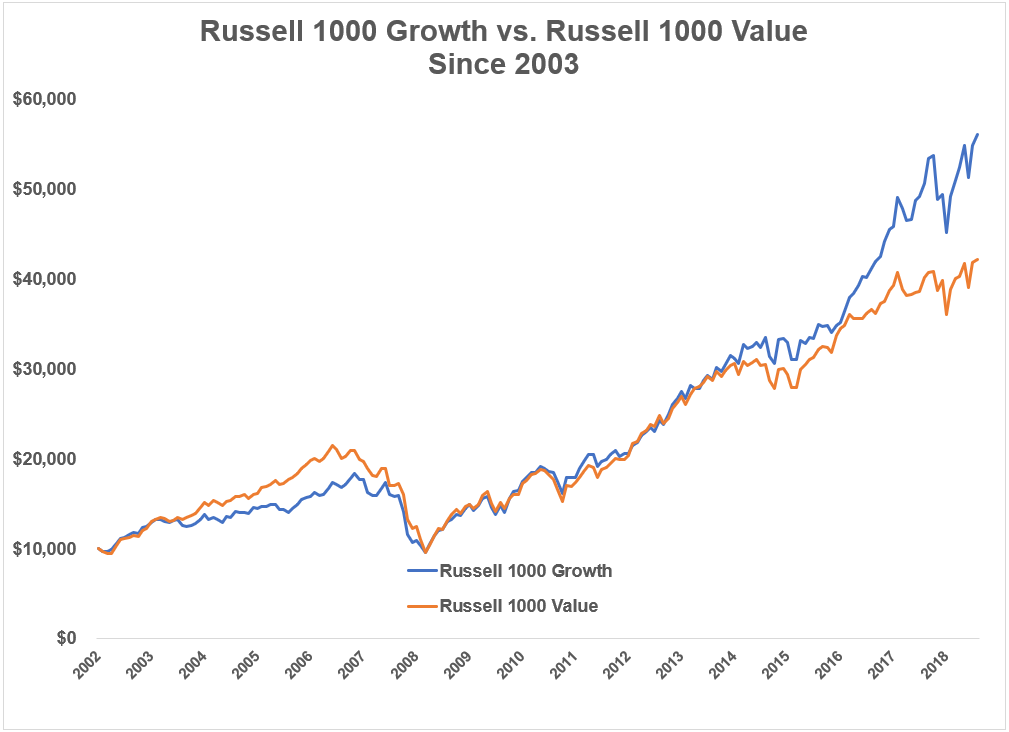
The Russell 1000 Growth Index is up 11.0% per year from 2003 through the end of July 2019. That’s nearly 2% higher than the 9.1% annual gain in the Russell 1000 Value Index.1
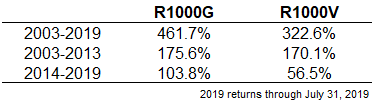
But you can see from the chart that much of the outperformance has come in recent years. From 2003-2013, the annual returns were virtually identical (9.7% vs. 9.5%). The outperformance has really come since 2014 as you can see from the total returns over various periods:
The same thing occurred during the end of the tech bubble. From 1984-1999, growth dominated value, outperforming by over 2% per year (18.6% vs. 16.5%). But that entire outperformance came at the tail end of the dot-com mania when tech stocks went crazy in 1998 and 1999:
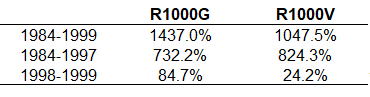
Value actually outperformed growth by more than 90% from 1984-1997. Then growth went on a tear in the last two years of the century, thus outperforming value significantly over the entire period.
Russell indexes go back to 1979. Since then, growth and value show fairly similar returns, with value having a slight annual edge, 11.9% vs. 11.5%.
There are plenty of examples like this where the short-term can have a significant impact on the long-term.
From January 1969-February 2009, long-term government bonds outperformed the S&P 500, 8.5% to 8.4% in annual returns. That’s more than 40 years where bonds outperformed stocks!
Under the basic risk-reward relationship of financial markets, this type of thing seems impossible. Of course, this mostly has to do with the end date I chose here. February 2009 was basically the bottom of the market crash. You can see from 1969-2007, stocks outpaced bonds by a decent margin:
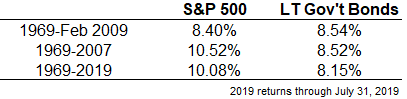
Then from 2008-February 2009, stocks fell nearly 50% while bonds were up more than 11%. So in 14 months, the entire lead stocks had spent almost 4 decades building, completely evaporated. Now that markets have recovered, lo and behold, it’s back.
U.S. stocks have crushed foreign markets for the past decade-plus. From 2008 through July 2019, the S&P 500 is up nearly 160%. In that same time, the MSCI Europe Index is up just 10% in total. Going back to the inception of MSCI data in 1970, the S&P has earned 10.5% annual returns while European stocks are up 8.8%.
But all of that outperformance has come during this cycle:
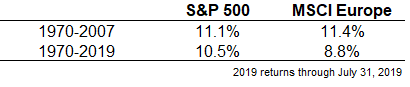
European stocks actually outpaced U.S. stocks from 1970-2007. Then the financial crisis hit and foreign stocks have badly lagged U.S. shares ever since, causing a wide gap between the two regions.
I could go on.
My point here is not to say that these relationships will always revert back to the way they once were. It remains to be seen if value really is dead or if U.S. stocks will continue to outpace international stocks.2 But it is important to recognize what can happen when short-term performance impacts long-term results:
Markets happen fast. Jack Reacher once said his work involves, “Long slow periods of nothing much, with occasional bursts of something.” Markets work much in the same way.
Years of gains can evaporate in an instant in the stock market. But 5-10 years’ worth of performance can also completely change the way investors view long-held beliefs about how markets tend to operate.
Professional investors often talk about judging performance “over a full market cycle.” I’m not sure such a thing even exists.
Even long-term market data can be confusing. By now everyone who follows market commentary should know it’s important to ignore the short-term noise and focus on the long-term. I’ve been beating the drum on this for years now.
Yet even a long-term focus can trick you if you’re not careful. At the extremes, long-term financial data can get out of whack.
Sure, there are always going to be paradigm shifts on occasion. Market relationships are far from static. But it’s important to remember than any historical market data requires context and should be taken with a grain of salt.
Market history can play tricks on you if you’re not careful.
Further Reading:
How to Win Any Argument About the Stock Market
1These Russell indexes aren’t perfect. There are tons of different value metrics but they have some of the longest track records so they work for historical comparisons.
2These two are actually related in some ways, since tech is such a large part of both growth and U.S. stocks, while Europe has a tiny tech sector relative to the U.S. and many of its companies are more of the value variety.
