The S&P 500 just posted its first down quarter since the third quarter of 2015. Prior to the latest quarter, the S&P 500 saw gains in 19 out of 20 quarters going back to the start of 2013. This included gains in 15 straight months, a streak which was broken in February of this year.
Stocks were down just 76 basis points on the year through the end of Q1 but the biggest takeaway from the first three months of the year is that volatility is back.
Stocks just experienced gains or losses in excess of 1% in eight out of nine days through Wednesday’s close. At the end of February, the S&P saw five straight days of gains or losses that were 1% or more. 2018 has already seen 13 losses of 1% or worse. 2017 saw just four 1% down days the entire year. February and March were down 3.7% and 2.5%, respectively. The last time the S&P 500 experience back-to-back down months of 2.5% or worse was in August and September of 2011.
It would appear we have experienced a regime shift in the markets from a period of low volatility to a period of high volatility. It’s impossible to predict how long this change will last but here’s what investors can expect during periods of heightened volatility:
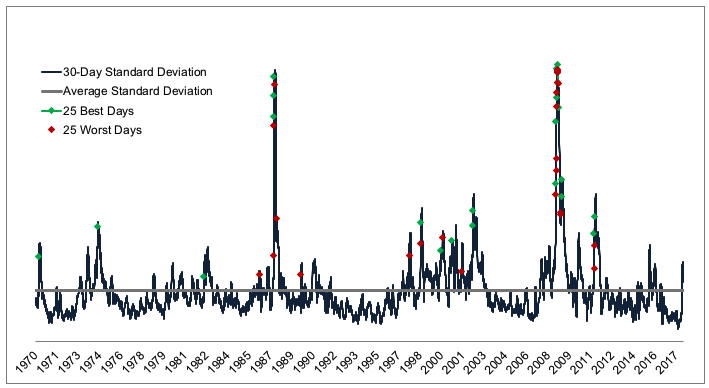
Volatility clusters. Volatility in the stock market can be counterintuitive. Bull markets aren’t typically filled with huge up days. Instead, rising markets tend to experience a slow and methodical rise higher. The best up days are usually seen in the same market environments as the worst down days, which occur during down-trending, volatile markets. The following chart shows the rolling 30-day volatility of the S&P 500 going back to 1970:

The best daily gains and worst daily losses are plotted on this chart in green and red. You can see that the best and worst days tend to cluster during periods of heightened volatility. In fact, the 25 best and 25 worst daily stock market returns since 1970 have all occurred during periods of above-average market volatility. You can see from the latest readings of this chart that volatility has very quickly surged into above-average territory.
This is one of the reasons it can be so difficult to make money during a downturn, even for those with a bearish posturing. The swings in price become so wild that even short sellers often get whipsawed out in their positions.
The more you look the more painful it will feel. The reason volatility clusters in the market is because losses instinctively hurt twice as bad as gains feel good. This loss aversion is a big reason why investors tend to make more emotionally-charged decisions when stocks are falling, which causes both panic selling and panic buying during a market downtrend.
Richard Thaler and Cass Sunstein take the idea of our aversion to loss one step further. They posit that investors also suffer from myopia, meaning the more often we evaluate our portfolios, the more likely we are to see losses. And the more often we see losses the more often we experience loss aversion, which can become a vicious cycle.
During volatile market environments, it becomes tempting to pay more attention than usual to your portfolio, but myopic loss aversion tells us this will likely only lead to more pain and potential investment mistakes. Volatile market environments tempt us into taking unnecessary risks and making unnecessary portfolio changes.
Prepare for a wider range of possible market outcomes. The stock market only hits new all-time highs in roughly 7% of all trading days. This means the majority of the time stocks in the midst of a drawdown from those highs. When stocks are in a period of above-average volatility (based on the chart from above), the average drawdown is 17.5%. But when stocks are in a period of below-average volatility, the average drawdown is just 8.4%.
No one can predict exactly how things will play out in the markets over time, whether volatility is high or low. But understanding how markets typically function under different volatility regimes can provide situational awareness.
Situational awareness of volatile market environments can help investors prepare for a much wider range of outcomes, even if we don’t know precisely what those outcomes will be in advance.
Further Reading:
My Evolution on Asset Allocation
Now here’s what I’ve been reading lately:
- Unanswered questions (Humble Dollar)
- 6 ways of influence (Of Dollars and Data)
- What has changed since the financial crisis? (Abnormal Returns)
- How to talk to people about money (Collaborative Fund)
- The limits to data (Irrelevant Investor)
- The most insane law ever passed by Congress (Bloomberg)
- Why we fail to learn from history (Novel Investor)
- When did the sales profession take off in America? (A Teachable Moment)
- Podcast: Bill Bernstein talks with Steve Chen about retirement hurdles (New Retirement)
