A few years ago I wrote a post that is still far and away my most popular called What if You Only Invested at Market Peaks? I still regularly receive comments, caveats, and questions about this one.
A recent follow-up question from a reader asks:
What if you only put your money to work at below average P/E ratios?
In theory, it would make sense that investing at lower valuations would give you better results considering that lower valuations tend to lead to higher long-term returns. But this exercise is not as easy as it would appear at first glance.
I looked at data from 1928-2016 and found the average Shiller cyclically-adjusted price-to-earnings (CAPE) ratio was 17.9. To keep things simple I then looked at the actual CAPE ratio at the start of each year going forward. If the CAPE was above average, I assumed you invested in cash (t-bills) that year and if it was below average I assumed you invested in stocks (S&P 500). Here are the results:

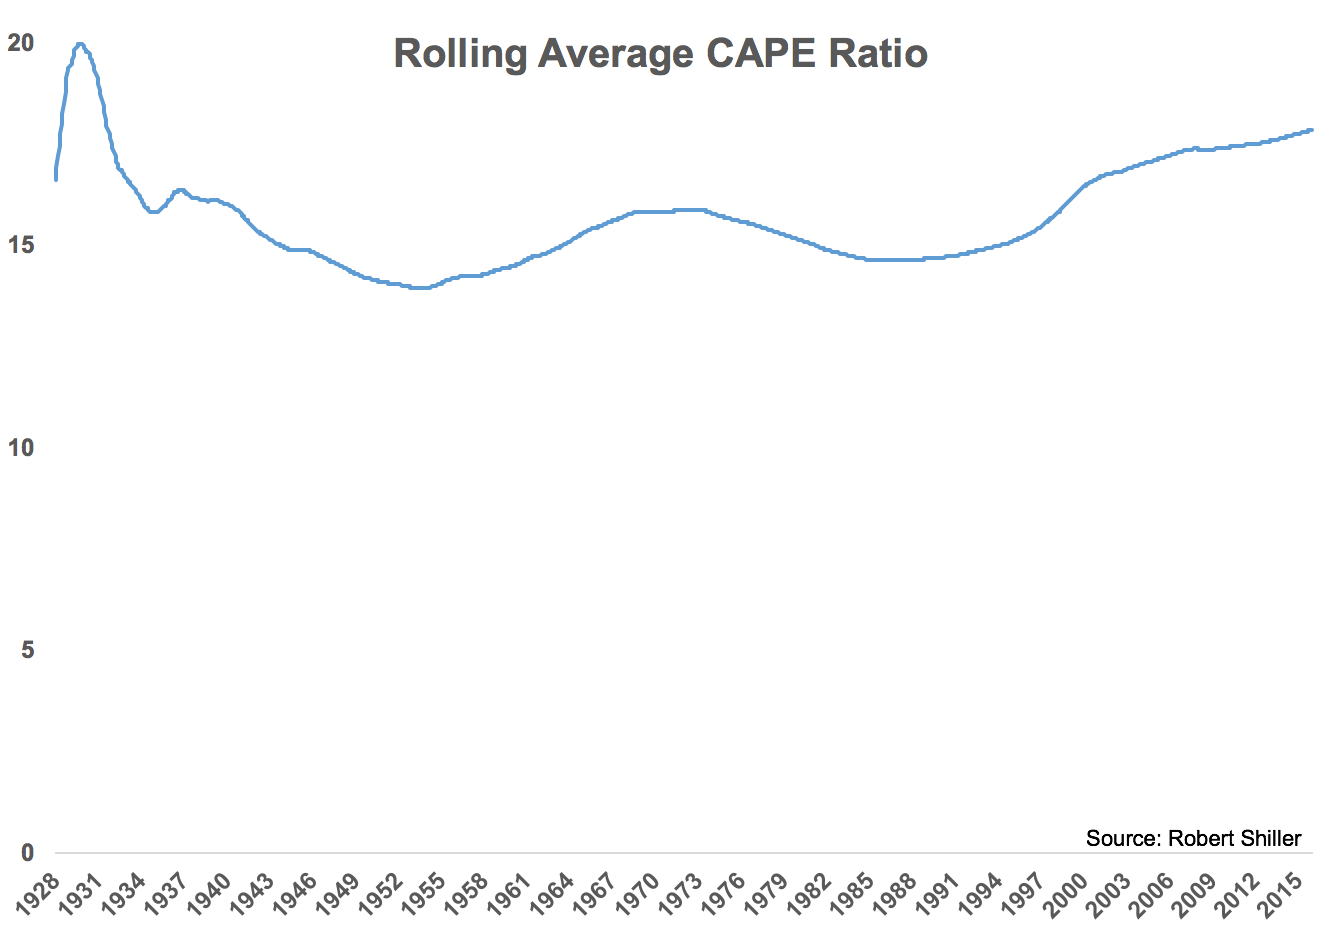
The problem here is that we now know what the average CAPE ratio is going back 90 years or so. But investors at the time didn’t know this (and technically the CAPE wasn’t rolled out until the late-1980s but I digress). Here’s what the rolling average CAPE looks like:

To account for the changing nature of the data, I used this rolling average of the CAPE ratio and assumed a 1970 start date to give the data series enough time to marinate, updating the average each year using the same above and below average rules as before:

You can see the performance numbers drop off substantially when using the rolling average data that would have been available at that time.
The CAPE ratio has been above the 17.9 average 49 years and below average 40 years since 1928. But since 1990 there’s only been one year (2009) when it began the year below the rolling average historical CAPE. Here’s how this has impacted these results since then:

Valuations have been trending higher throughout this period which isn’t something that has to last forever. Every year from 1973-1988 saw the CAPE start the year out below the long-term average valuation levels. It really depends on the market and economic environment but it could be a long wait for investors looking to take advantage.
There are obviously other ways of looking at this data. You could rotate into other equity markets or even bonds but the deeper you look into historical market valuations the more you realize how difficult it is to your them as a timing tool.
I’ve looked at a number of studies that are more in-depth than the simple exercise I’ve shown here but the main takeaway is that it’s really difficult to time the market using historical valuations (although data-mining is always an option).
Nothing is impossible but the longer I’m in this game the easier it is to see that there’s no perfect strategy to game the system.
Further Reading:
What If You Only Bought Near Market Bottoms?
