Meet Bob.
Bob is the world’s worst market timer.
What follows is Bob’s tale of terrible timing of his stock purchases.
Bob began his career in 1970 at age 22. He was a diligent saver and planner.
His plan was to save $2,000 a year during the 1970s and bump that amount up by $2,000 each decade until he could retire at age 65 by the end of 2013 (so $4,000/year in the 80s, $6,000/year in the 90s then $8,000/year until he retired).
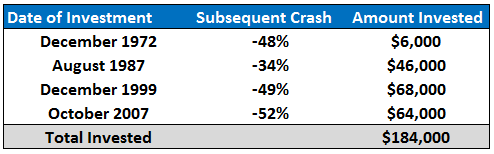
He started out by saving the $2,000 a year in his bank account until he had $6,000 to invest by the end of 1972.
Bob’s problem as an investor was that he only had the courage to put his money to work in the market after a huge run-up.
So all of his money went into an S&P 500 index fund at the end of 1972 (I know there were no index funds in 1972, but just go with me here…see my assumptions at the bottom of the post).
The market dropped nearly 50% in 1973-74 so Bob basically put his money in at the peak of the market right before a crash.
Yet he did have one saving grace. Once he was in the market, he never sold his fund shares. He held on for dear life because he was too nervous about being wrong on both his sell decisions too.
Remember this decision because it’s a big one.
Bob didn’t feel comfortable about investing again until August of 1987 after another huge bull market. After 15 years of saving he had $46,000 to put to work. Again he put it in an S&P 500 index fund and again he invested at a market peak just before a crash.
This time the market lost more than 30% in short order right after Bob bought his index shares.
Timing wasn’t on Bob’s side so he continued to keep his money invested as he did before.
After the 1987 crash, Bob didn’t feel right about putting his future savings back into stocks until the tech bubble really ramped up at the end of 1999. He had another $68,000 of savings to put to work. This time his purchase at the end of December in 1999 was just before a 50%+ downturn that lasted until 2002.
This buy decision left Bob with some more scars but he decided to make one more big purchase with his savings before he retired.
The final investment was made in October of 2007 when he invested $64,000 which he had been saving since 2000. He rounded out his string of horrific market timing calls by buying right before another 50%+ crash from the credit blow-up.
After the financial crisis, he decided to continue to save his money in the bank (another $40,000) but kept his stock investments in the market until he retired at the end of 2013.
To recap, Bob was a terrible market timer with his only stock market purchases being made at the market peaks just before extreme losses.
Here are the purchase dates, the crashes that followed and the amount invested at each date:
Luckily, while Bob couldn’t time his buys, he never sold out of the market even once. He didn’t sell after the bear market of 1973-74 or the Black Monday in 1987 or the technology bust in 2000 or the financial crisis of 2007-09.
He never sold a single share.
So how did he do?
Even though he only bought at the very top of the market, Bob still ended up a millionaire with $1.1 million.
How could that be you might ask?
First of all Bob was a diligent saver and planned out his savings in advance. He never wavered on his savings goals and increased the amount he saved over time.
Second, he allowed his investments to compound through the decades by never selling out of the market over his 40+ years of investing. He gave himself a really long runway.
He did have to endure a huge psychological toll from seeing large losses and sticking with his long-term mindset, but I like to think Bob didn’t pay much attention to his portfolio statements over the years. He just continued to save and kept his head down.
And finally, he had a very simple and low-cost investment plan — one index fund with minimal costs.
Obviously, this story was for illustrative purposes and I wouldn’t recommend a portfolio consisting of 100% in stocks of a single market in the S&P 500 unless you have an extremely high risk tolerance. Even then a more balanced portfolio in different global markets with a sound rebalancing policy makes much more sense.
And if he would have simply dollar cost averaged into the market on an annual basis with his savings he would have ended up with much more money in the end (over $2.3 million).
But then he wouldn’t be Bob, The World’s Worst Market Timer.
Lessons from Bob’s Journey:
- If you are going to make investment mistakes, make sure you are biased towards optimism and not pessimism. Long-term thinking has been rewarded in the past and unless you think the world or innovation is coming to an end it should be rewarded in the future. As Winston Churchill once said, “I am an optimist. It does not seem too much use being anything else.”
- Losses are part of the deal when investing in stocks. How you react to those losses is one of the biggest determinants of your investment performance.
- Saving more, thinking long-term and allowing compound interest to work in your favor are your biggest accelerants for building wealth. These factors have nothing to do with picking stocks or a complex investment strategy. Get these big things right and any disciplined investment strategy should do the trick.
*******
***Assumptions and disclaimers: This is fictional and is in no way how you should invest your money. It takes nerves of steel to hold 100% of your portfolio in stocks for decades on end. This is purely an exercise in the power of long-term thinking and compounding. I used the S&P 500 less a 0.20% expense ratio from the 1972 until 1977 when the Vanguard 500 Fund had its first full year. I used the Vanguard 500 Fund from 1977 on so these were actual results from a real fund, not purely hypothetical.


You said “world’s” worst market timer, right? How did Bob’s distant relatives in Japan, Greece, Italy and Iceland fare?
Hopefully Bob’s cousins in those countries realized their stock markets made up a very small % of world stock mkt cap. Japan is currently under 10%, Italy is about 1% and Iceland is a rounding error while the US is close to 50%.
We are lucky in the US that companies/mgmt/govt protect shareholders relatively better than other countries. We also have a much more diverse economic system and stock market industry make-up.
Still, it’s a global economy today so those mkts are a great example for global diversification and the need to get rid of your home bias if you live elsewhere.
Wonder what Bob’s annualized rate of return was.
It’s difficult to give a good answer because most of the mistakes and lost returns came from the opportunity cost of holding cash for the majority of the period.
Compounding is the key here. For example, that initial $6K invested in 1972 grew to about $300K by 2013. I did calculate the S&P 500 from 1972-2013 and it was over 10%/yr.
The annualized return is easy to work out. We know the dates and $ amounts invested (whether they went into the market or the bank is not relevant). A simple IRR calc in excel gives the annualized rate of return as 7.3%. Still better than cash.
A question – did you take dividends into account in the calc of $1.1m terminal value?
Yes, dividends included. I thought about doing an IRR calc. but it’s really misleading because of the nature of the timing of the CFs. It’s why I think a multiple of invested capital makes more sense here (roughly 5x).
If I understood the setup of your example, the cashflows are very regular – once per year Bob has an outflow of cash (starting at $2k and ending at $8k). When he switches the cash from bank to stock market is not an outflow. So in this case his total return over the 40 years of 7.3% pa is the most relevant number.
I find multiple of capital can be misleading over long periods of time.
Yes, you are right. I was trying to make it too complicated. Good call.
XIRR 10.95%
12/1/1972 -$6,000.00
8/1/1997 -$46,000.00
12/1/1999 -$68,000.00
10/1/2007 -$64,000.00
12/31/2013 $1,100,000.00
http://www.moneychimp.com/features/market_cagr.htm
10.3%
So the worst timer appears to be better.
Interesting. Thanks for running the numbers.
Great story and illustration of the power of holding investments for the long term. Looks like Bob did really well despite his terrible market timing on the buy side.
I recall back in 2007-2008 when the market was tanking everyone was panicking and selling out. While it was difficult to do psychologically, those who didn’t panic and instead kept investing ended up much better in the long run.
Thanks Dan. There are smart investors out there who can sidestep market crashes, but it’s extremely rare to get both decisions right. A consistent buying process is probably the best bet for the majority of investors out there. Not perfect, but much better than the alternatives.
So assuming that you don’t sell, there is basically no point waiting for a ‘good time’ (whatever that means) to entering the market? Another way of asking is what if Bob had timed his purchases a bit better, like waiting for the correction before making his first purchase?
As I showed, Bob would have been better off with a simple dollar cost average on a periodic basis (weekly, monthly, quarterly, etc.). He would have done better timing his purchases, but no one can really do that very well and since the general trend in the markets have been up over time, you are much better off emotionally making periodic contributions instead of trying to time your buys. It’s an impossible game to play when you constantly have to try to guess when it’s a good time to get invested. Your time horizon matters too, but psychologically, a simple DCA to your set asset allocation is the simplest way to get market exposure without losing sleep at night.
[…] may be to combine the two types of funds (WSJ) see also What if You Only Invested at Market Peaks? (A Wealth of Common Sense) • Emerging, but No Longer a Mother Lode of Profits (NY Times) • The Cost of Bitcoin […]
[…] of the stock market.” Also, even if you are terrible at timing the market and invest only at market peaks, you would still generate a pretty nice […]
[…] What If You Only Invested at Market Peaks? (A Wealth of Common Sense) […]
[…] ‘What if you invested only at Market Peaks?’ – A Wealth of Common Sense […]
[…] Vir: A wealth of common sense, 2014 […]
Hi Ben, inspired by your article, a blogger on the Spanish site Rankia did a similar analysis for many countries……and came to the same conclusion.
http://www.rankia.com/blog/etfs-pm/2271047-peor-inversor-historia
He suggests everyone should read your article but many people there will not have sufficient English to do so.
May I translate your article into Spanish and post it on Rankia?
Yesm the blogger actually sent me his article and I was impressed with the analysis and the outcomes.
Always happy to spread the news…feel free to pe-post on Rankia and thank you for checking. Maybe send me a copy when it’s up so I can share?
Hi Ben, here’s my translation, hope it will be of use.
http://www.rankia.com/foros/fondos-inversion/temas/2277524-peor-market-timer-historia
With best wishes.
[…] few months ago I looked at what would happen if you only invested at market peaks over a long time frame. It turned out the results weren’t as bad as you would […]
[…] not far from buy-and-hold and even worse for some indexes. (Regular readers will note that we cited prior research showing that you did not lose much from investing at market […]
[…] far from buy-and-hold and even worse for some indexes. (Regular readers will note that we cited prior research showing that you did not lose much from investing at market […]
[…] Further Reading: Learning From Vanguard Investors What if you only invested at market peaks? […]
Very misleading. Sure, if you also invest through the greatest bull market in history. That will overcome a lot of investing glitches.
Furthermore, statistics show that the average investor invests at the wrong times. It’s very unlikely that someone who jumped into a hot trend with very high stock valuations would also have the patience to hold through a steep fall.
[…] Fierro was following up on a different thought experiment run by Ben Carlson: What if you were the worlds worst market timer, and you only bought stocks just before major […]
[…] is no better story that I have found to illustrate this point than that of hypothetical Bob, the world’s worst market timer. Long story short, Bob starts saving at 1970. However, he is incredibly unlucky and decides to […]
[…] to alleviate some of your concerns about lump sum investing, I will remind you about the story of Bob, the world’s worst market timer. Bob only invested lump sums right before four major market crashes, but despite his bad luck he […]
[…] **Read more about the assumptions and the example here. […]
[…] **Read more about the assumptions and the example here. […]
Very interesting post. Do you have the spreadsheet data to show how this was calculated? What I find odd is that when I do the math, Bob would have ended up with $634k if every year he got a consistent 7% return. Far less then the $1.1m he ended up with with the poor market timing he persevered through. Could (obviously) be a math error on my end.
$6k compounded at 7% for 41 years = $96k
$46k compounded at 7% for 26 years = $267k
$68k compounded at 7% for 14 years = $175k
$64k compounded at 7% for 6 years = $96k
——-
Total = $634k
Maybe he factored in all the dividends reinvested over the span of 4 decades as well.
I don’t see how that could have accounted for such a difference though.
Historically, dividends are about half of stock market returns.
See my analysis above. Even with dividends invested, the final value is less than half of what is claimed.
Now use 10% which is closer to reality and you end up with:
298,711+548,236+258,229+113,379 = 1,218,555.
Right. 7% would be the IRR not the compounded returns. This includes dividends
I may have answered my own question – doing a bit more research, the annualized return on the S&P 500 between 1972 and 2013 was 10.49%. Using that number, he would have had $1.37M if he had the “average” return consistently every year. Certainly surprising that the numbers aren’t that far off considering his bad luck with market timing (or error in not dollar cost averaging consistently…).
Excellent reminder about time in the market!
Mark
[…] Carlson of A Wealth of Common Sense had a great story about a guy who only invested at the market peaks, and nevertheless ended up a […]
[…] In his famous book Stocks for the Long Run Jeremy Siegel stated that “Investing over time in stocks has been a winning strategy whether one starts such an investment plan at a market top or not”. I came across this article recently and thought it was a great example. Meet the world’s worst market timer, who is so unlucky that every time he invested, market collapsed. But he still made a lot of money by just sticking to a simple long-term investing strategy. https://awealthofcommonsense.com/worlds-worst-market-timer/ […]
[…] What if You Only Invested at Market Peaks? – A Wealth of Common Sense […]
Former Benistar head charged with misappropriating $9M in client funds – The former chairman of Newton-based Benistar Property Exchange Co. has been charged with mail and wire fraud by a federal grand jury in connection with a scheme that allegedly resulted in the misappropriation of roughly $9 million in client funds, the Justice Department has announced.
[…] “What if You Invested Only at Market Peaks?” by Ben Carlson of A Wealth of Common Sense. […]
[…] a non-investor over the 20-year period from 1993 to 2012, as explored in this post from A Wealth of Common Sense? Even more surprising, the world's worst market timer would have out performed a non-investor […]
[…] What If You Only Invested at Market Peaks: Probably my most popular post. I think the reason this one has worked so well is because I used a simple story to illustrate my point about thinking and acting for the long-term in the markets. […]
[…] Read more here: https://awealthofcommonsense.com/worlds-worst-market-timer/ […]
How are you getting $1.1 million?!
Here is the adjusted close of the S&P 500, which includes dividends. These dates are the high before the crashes. One of them is almost 4 months from the date in your table.
Jan 11, 1973: 120.24
August 25, 1987: 366.77
March 24, 2000: 1527.46
October 9, 2007: 1565.15
S&P adjusted close for December 31, 2013 when Bob retired: 1848.36
Value of investment deposits as of December 31, 2013, excluding expense ratios and taxes, including dividends:
$6000 deposited Jan 11, 1973 —> $92,233.53 (+1437.72%, ≈ 6.9% annual return)
$46,000 deposited August 25, 1987 —> $252,470.71 (+448.85%, ≈6.7% annual return)
$68,000 deposited March 24, 2000 —> $82,285.94 (+21.01%, ≈1.4% annual return)
$64,000 deposited October 9, 2007 —> $65,187.37 (+1.86%, ≈0.4% annual return)
Total value at the end of 2013: $492,177.55
Total return on investment at the end of 2013: +167.49% (excluding expense ratio and taxes, including dividends)
In every case, he would have been better buying long term Treasury bonds or CDs. The interest rates in the 1970’s and 1980’s were in the double digits.
I fully recognize that my analysis might be flawed, so please let me know.
Looks to me like your analysis doesn’t include dividends. The adjusted values your using aren’t really adjusted…those are just the price levels. For example, from both 1973 and 1987 the annual returns have been roughly 10.3%. Your return numbers are far too low.
“I used the Vanguard 500 Fund from 1977 on so these were actual results from a real fund, not purely hypothetical”
I’m also curious about how much real return was lost just to inflation while Bob was holding cash instead of DCAing into a safer asset class that whole time?
For example, $100 in 1988 had the same purchasing power as $140 in 1999 according to http://inflationdata.com/Inflation/Inflation_Calculators/Inflation_Rate_Calculator.asp.
Even assuming the DCA’d investments only matched inflation until the stock crashes happened (e.g. TIPS or something, that he would rebalance into 100% stock at the same time as the hypothetical cash dumps here) he would have come out WAY ahead of the $1.1 million suggested here.
I love this article and I keep coming back to it, sharing it with my friends who are “market timers”. Thanks Ben!
What about the 40 years following the 1929 peak? The strategy doesn’t look so clever now, does it? Do you think Nikkei investors in 1989 have got their money back yet?
Even idiots get bailed out in a rising market, but to ignore market timing is to play wall st’s game – they make their money by convincing you to buy right now whatever the price with because after a few years it will be higher. If you wait, they starve.
And also, if Bob is really the world’s worst market timer, then when the day comes that he wants to cash out, it will of course be at the bottom of a huge bear market, not near the peak of a 6 year bull market. That final sum isn’t guaranteed until he actually cashes out.