I’m not good at timing the markets.
I’m not good at predicting turning points.
I don’t know when certain asset classes, stocks, or strategies will over- or underperform.
I do know nothing is more dependable in the markets than cycles.
John Templeton famously said the four most dangerous words in investing are “this time is different.” The hard part about cycles is sometimes things really are different.
Templeton himself once said roughly 20% of the time things really are different.1
This stuff is hard sometimes.
I don’t have all the answers so I want to play a little game of Can This Continue?2
Here’s what I got:
U.S. interest costs. Torsten Slok shared a chart last week that shows the U.S. government is paying out $3 billion per day in interest expenses on our debt:
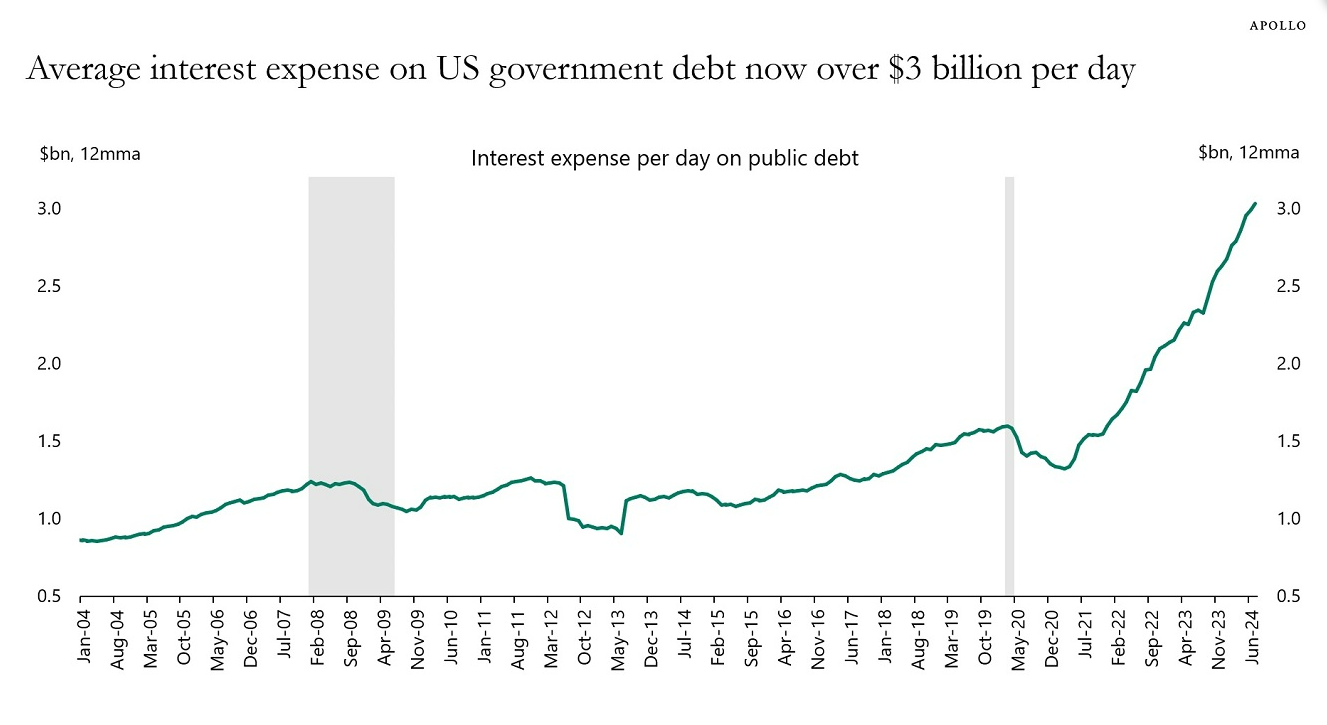
Higher interest rates and increased government spending during the pandemic sent this number vertical.
One of the reasons I thought the Fed would be hesitant to raise rates as high as they did is because of our huge debt load. I didn’t think this was politically feasible. I obviously underestimated how much people hate inflation.
To be fair, that $3 billion number requires some context. As a percentage of GDP, it’s still lower than it was in the 1980s and early-1990s:
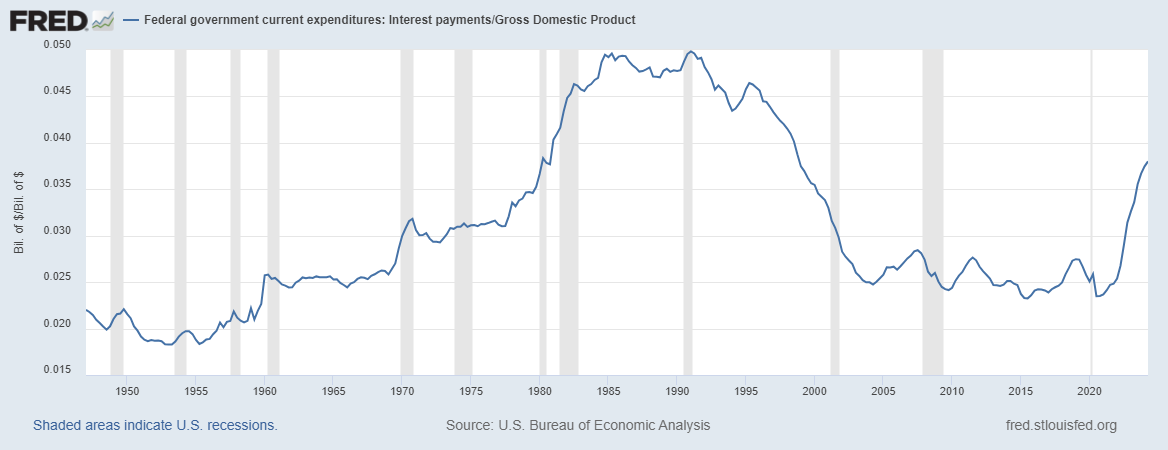
But it is increasing at a fast clip. People have been worried about government debt for decades but it seems like this could become a political issue in the coming years.
Nothing can stop the runaway freight train of government spending, but we probably need much lower rates to service that debt.
Can the government continue spending so much money on interest before it becomes a problem (politically or otherwise)?
U.S. large cap outperformance. Here are the returns for the S&P 500, MSCI EAFE and Russell 2000 over the past 10 years:
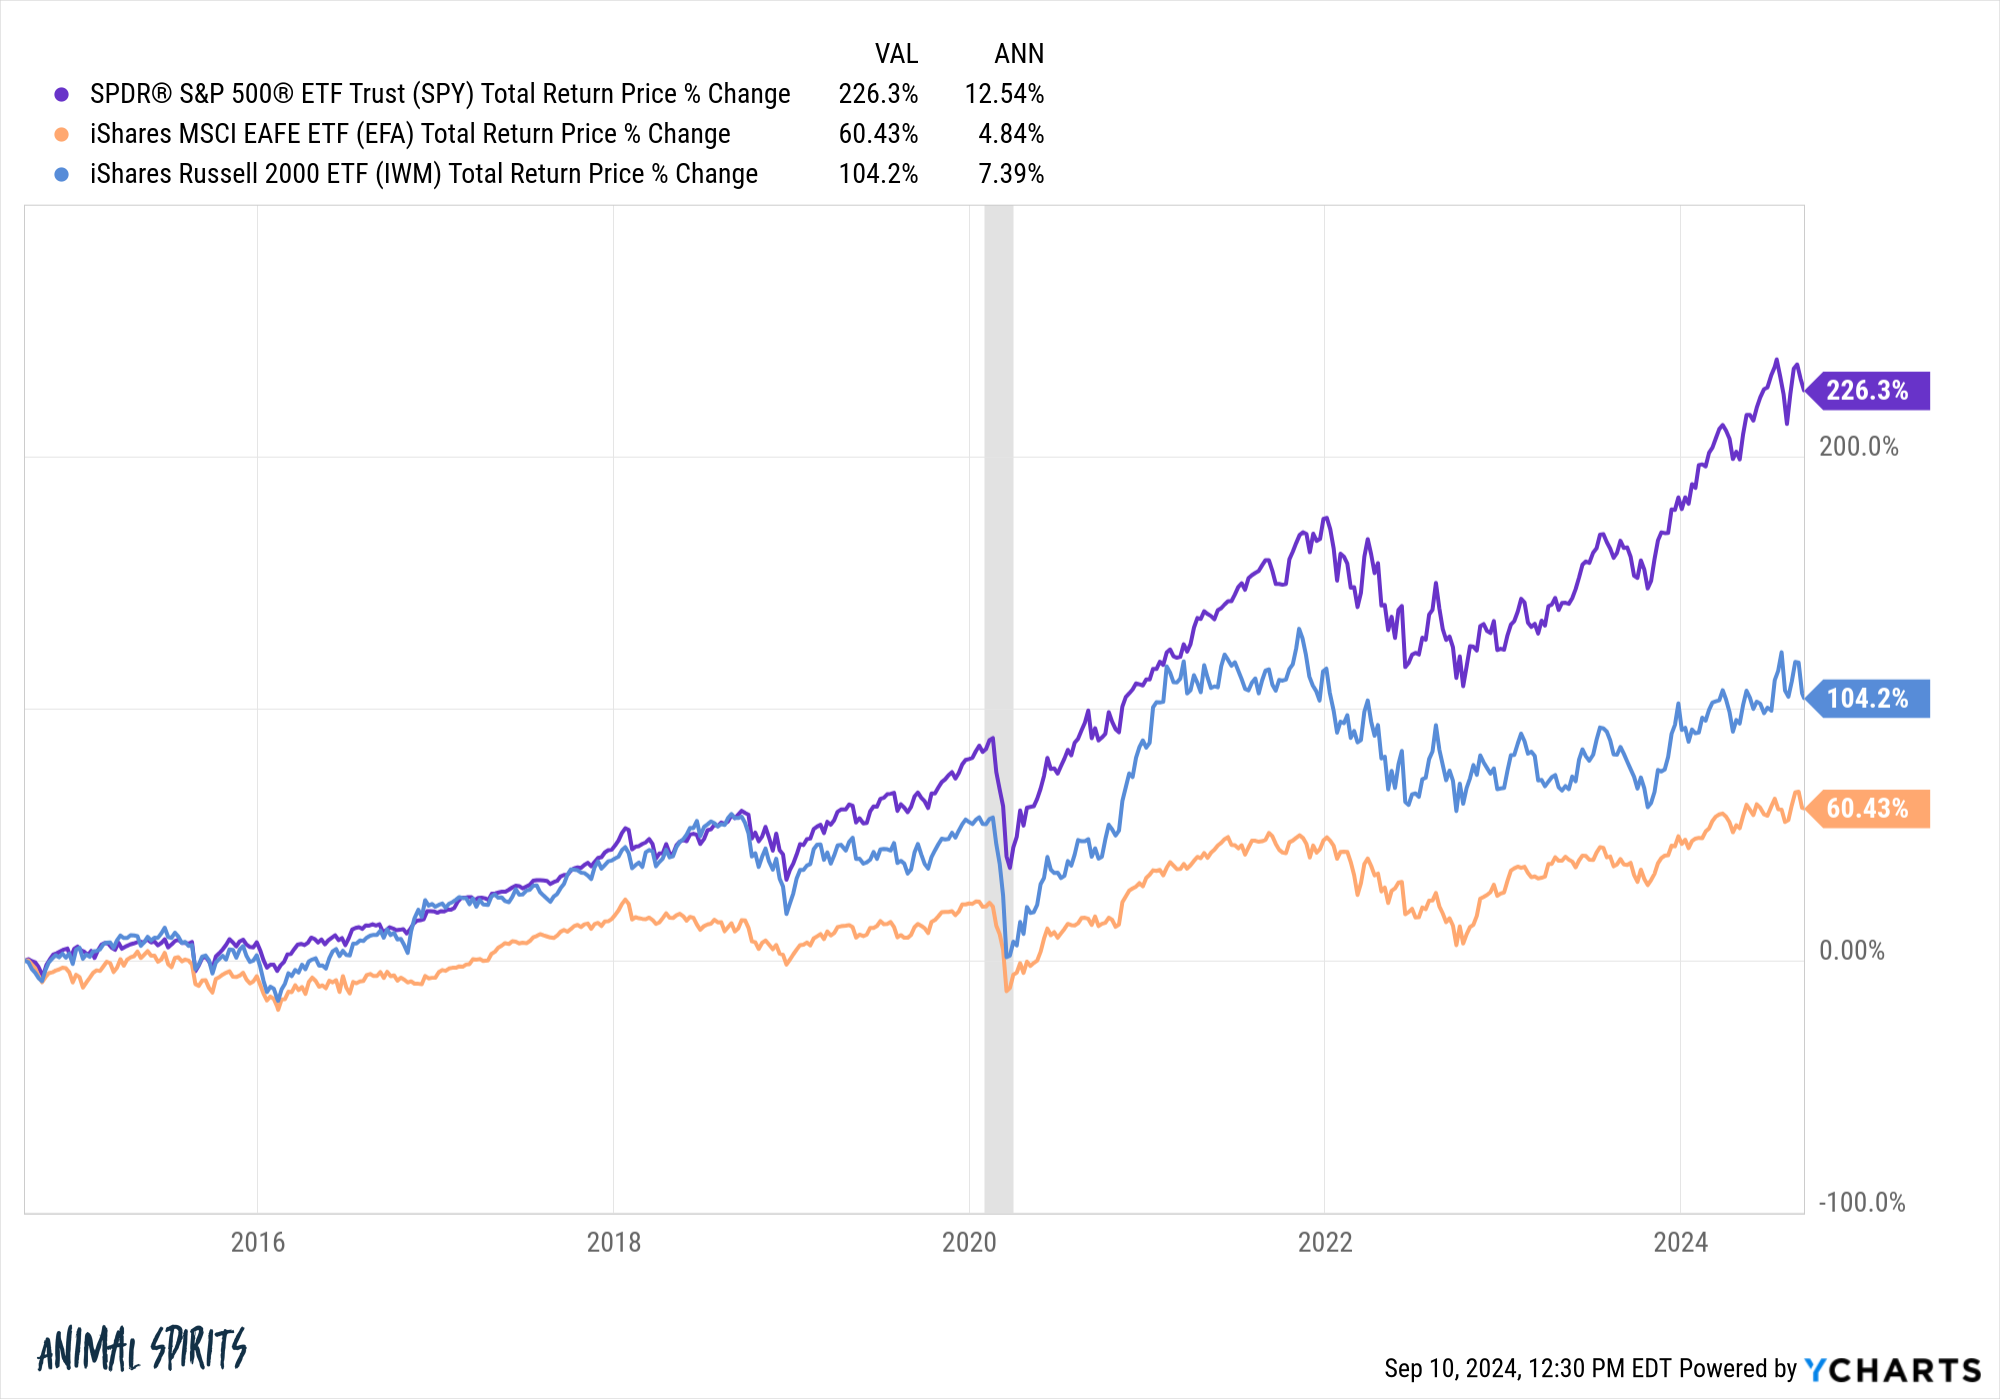
Large U.S. corporations have dominated small corporations and their foreign counterparts. It’s not even close really.
Everything I’ve studied about markets tells me this is cyclical.
Large caps will underperform because they get too expensive or interest rates will fall or the U.S. dollar will fall relative to other currencies or something else happens I’m not even thinking about.
But the longer this goes on the harder it becomes to envision a scenario where U.S. large caps lag other areas of the global stock market.
Can large caps continue this insane run of outperformance?
The Magnificent 7. There is a reason for mega-cap outperformance — those stocks have had the best fundamentals. Here’s a good summary from JP Morgan:

Look at the share price of Nvidia relative to earnings growth:
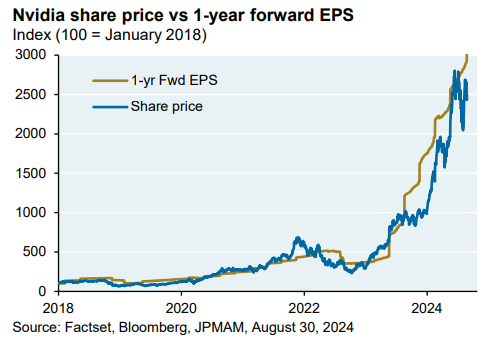
I know everyone thinks these companies are a massive bubble but so far the fundamentals have kept up.
Of course, the top 10 stocks in the S&P 500 now make up 35% of the total index. Ten years ago, it was less than 19% (and most of the stocks weren’t even in the top 10).
These companies have already defied the laws of gravity.
Can they continue to put up such big numbers now that many of these stocks are trillion-dollar corporations?
Housing prices. Here’s another one from Apollo that looks at the ratio of housing prices to rents: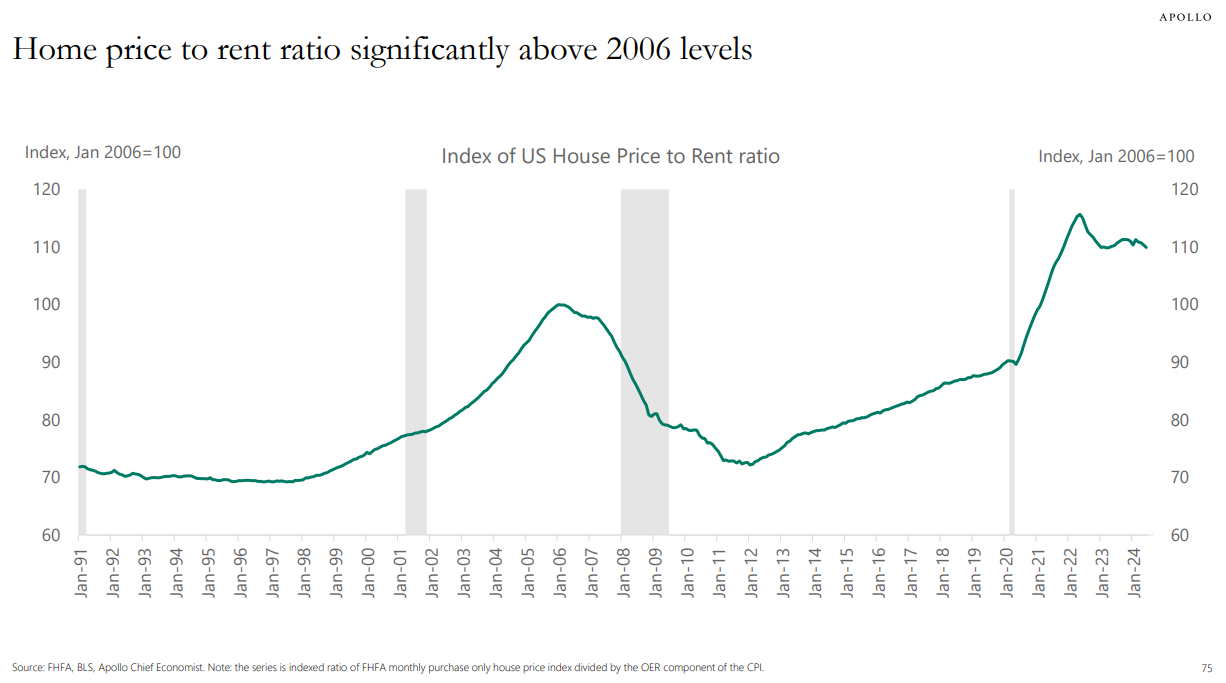
I don’t know what the right ratio is for this relationship.
I do know that this was a pretty good tell during the last housing bubble.
Do I think we are in another housing bubble? No, I don’t.
But this is one of those charts that makes me feel uncomfortable just looking at it. It looks like something has to give.
Does it mean housing prices have to fall? Not necessarily.
Does it mean rents have to rise? I hope not but that wouldn’t surprise me if we don’t build more multi-family housing.
How long can we continue seeing housing prices and costs out of whack with historical norms?
Further Reading:
7 Questions I’m Pondering
1Here’s what The NY Times wrote in a story about Templeton in 1987: Even Mr. Templeton concedes that when people say things are different, 20 percent of the time they are right.
2In my head you just read that like a gameshow where the audience shouts each word with a slight pause in-between.
