There are now six stocks in the S&P 500 with trillion-dollar valuations:
- Microsoft ($3.1 trillion)
- Apple ($2.9 trillion)
- Nvidia ($1.8 trillion)
- Amazon ($1.8 trillion)
- Google ($1.9 trillion)
- Facebook ($1.2 trillion)
The numbers are getting so big it’s almost hard to comprehend.
Bank of America noted in a research piece last week that Nvidia by itself is now worth more than the entire Chinese stock market. That means Google, Amazon, Apple and Microsoft are all bigger than China’s market as well and Facebook is close.
Tech stocks continue to dominate the stock market and are becoming more and more concentrated.
Here’s an updated list of the top 10 holdings in the S&P 500 through the close last week:
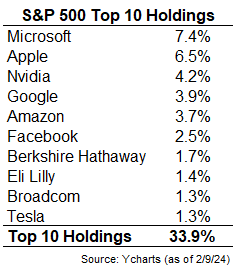
We’re now looking at one-third of the index in the top 10 names alone. If we broaden out to the top 25 holdings, they make up 46% of the index.
As recently as 2015, the top 10 stocks in the S&P 500 made up less than 20% of the total.
It’s important to note that these weights are cyclical and all over the map historically.
Throughout the 1950s and 1960s the top 10 stocks regularly made up around a third of the total market cap of the S&P. Then the Nifty Fifty one-decision stocks took over in the late-1960s/early-1970s and the top 10 holdings jumped to more than 40% of the index.
Concentration would fall below 20% by the end of the 1980s before rising yet again to nearly 30% by the end of the dot-com bubble in the early-2000s. So, relative to the recent past, concentration levels look high, but relative to history, it’s not like we haven’t seen these levels before.
It can also be helpful to put these numbers into context by looking at other stock markets around the globe.
I looked at the top 10 holdings for every G7 country using MSCI country stock market ETFs to compare to the weights in the S&P 500:
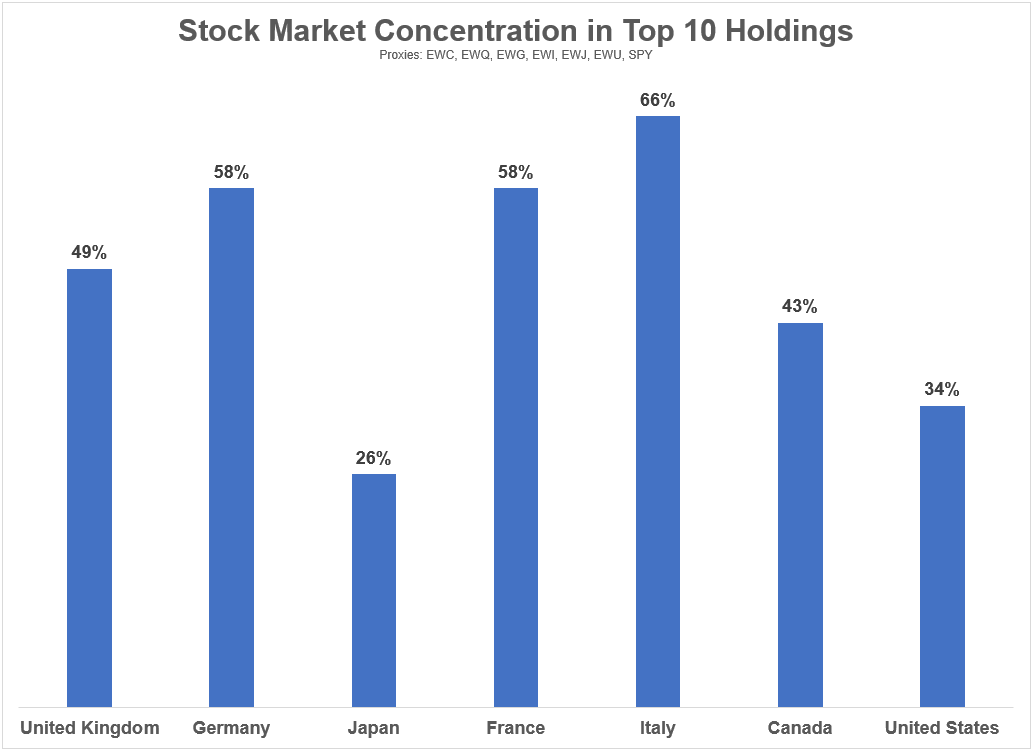
Most of these countries are far more concentrated than the United States in the top 10 names. The only country that’s more diversified is Japan and it’s not that far off. The UK, France, Italy, and Germany all have one-half to two-thirds of their stock markets concentrated in the 10 biggest stocks.
Concentration is the norm in stock markets around the globe.
In China the top 10 stocks are more than 57% of the index (ticker FXI). The five biggest companies are nearly 38% of the market cap. South Korea has 49% of its market cap in the top 10 stocks, including 22% in Samsung alone. Australia’s top 10 stocks make up 60% of the index.
I understand why some investors are nervous about the sheer size and scale of the tech behemoths in the U.S. stock market. It almost doesn’t feel natural.
But it’s perfectly normal to have a handful of huge companies make up the bulk of the stock market.
That doesn’t mean these large stocks can’t or won’t crash. They likely will at some point.
In fact, most of them already did in 2022. Nvidia (-66%), Facebook (-77%), Apple (-31%), Google (-45%) and Amazon (-56%) all crashed far worse than the S&P 500 (-25%) during the recent bear market.
So while the biggest stocks have had an outsized impact on the gains during the recent cycle, there are other stocks and sectors that can step up if and when the tech stocks falter.
Concentration is a feature of market cap weighted stock market indexes.
It’s perfectly normal.
Further Reading:
Power Laws in the Stock Market
